Climate Science Glossary

Term Lookup

Enter a term in the search box to find its definition.

Settings

Use the controls in the far right panel to increase or decrease the number of terms automatically displayed (or to completely turn that feature off).

Term Lookup

Settings


All IPCC definitions taken from Climate Change 2007: The Physical Science Basis. Working Group I Contribution to the Fourth Assessment Report of the Intergovernmental Panel on Climate Change, Annex I, Glossary, pp. 941-954. Cambridge University Press.

Home Arguments Software Resources Comments The Consensus Project Translations About Support

Bluesky Facebook LinkedIn Mastodon MeWe

Twitter YouTube RSS Posts RSS Comments Email Subscribe


Climate's changed before
It's the sun
It's not bad
There is no consensus
It's cooling
Models are unreliable
Temp record is unreliable
Animals and plants can adapt
It hasn't warmed since 1998
Antarctica is gaining ice
View All Arguments...


Username
Password
New? Register here
Forgot your password?

Latest Posts

Archives

Sun & climate: moving in opposite directions

What the science says...

Select a level... Basic Intermediate Advanced

The sun's energy has decreased since the 1980s but the Earth keeps warming faster than before.

Climate Myth...

It's the sun

"Over the past few hundred years, there has been a steady increase in the numbers of sunspots, at the time when the Earth has been getting warmer. The data suggests solar activity is influencing the global climate causing the world to get warmer." (BBC)

At a glance

Thankfully for us, our Sun is a very average kind of star. That means it behaves stably over billions of years, steadily consuming its hydrogen fuel in the nuclear reaction that produces sunshine.

Solar stability, along with the Greenhouse Effect, combine to give our planet a habitable range of surface temperatures. In contrast, less stable stars can vary a lot in their radiation output. That lack of stability can prevent life, as we know it, from evolving on any planets that might orbit such stars.

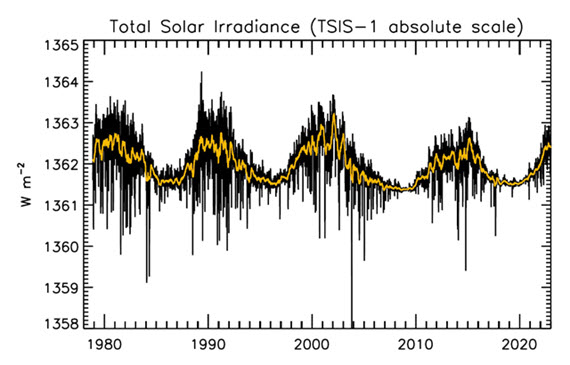
That the Sun is a stable type of star is clearly demonstrated by the amount of Solar energy reaching Earth's average orbital position: it varies very little at all. This quantity, called the Total Solar Irradiance, has been measured for around forty years with high accuracy by sensitive instruments aboard satellites. Its average value is 1,362 watts per square metre. Irradiance fluctuates by about a watt either way, depending on where we are within the 11-year long sunspot cycle. That's a variation of no more than 0.15%.

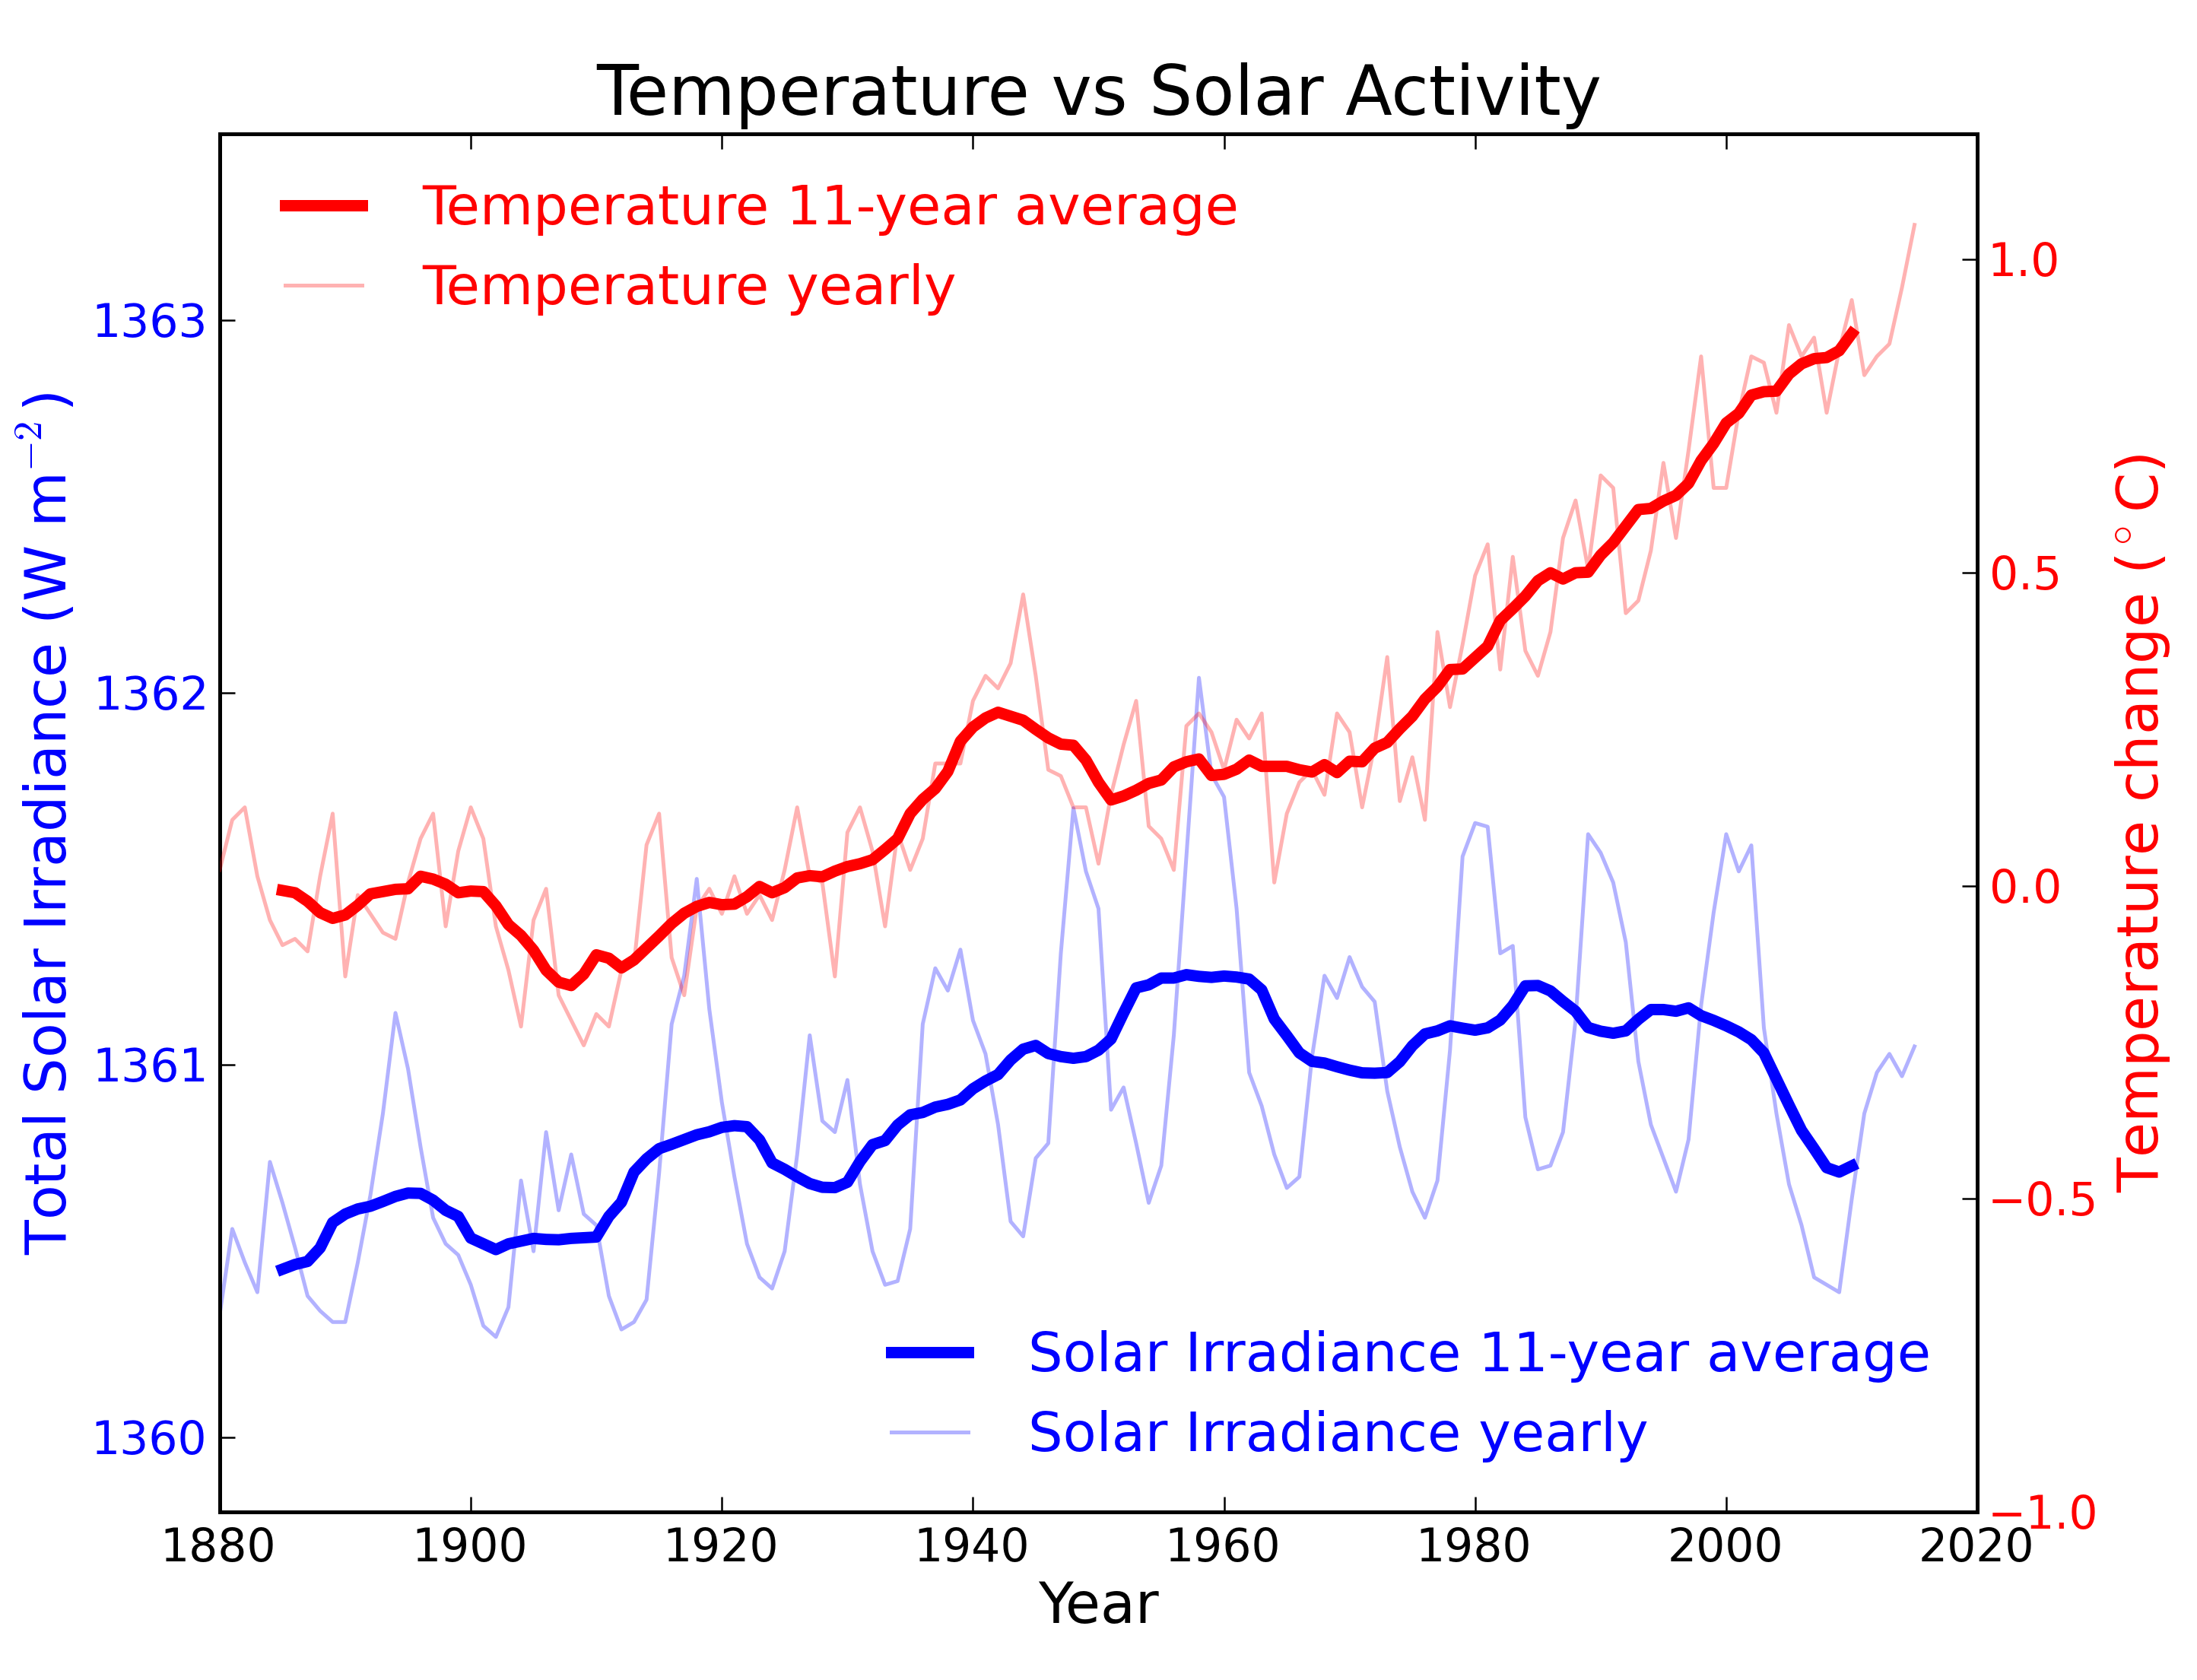
From the early 1970s until today, the Solar radiation reaching the top of Earth's atmosphere has in fact shown a very slight decline. Through that same period, global temperatures have continued to increase. The two data records, incoming Solar energy and global temperature, have diverged. That means they have gone in opposite directions. If incoming Solar energy has decreased while the Earth continues to warm up, the Sun cannot be the control-knob of that warming.

Attempts to blame the sun for the rise in global temperatures have had to involve taking the data but selecting only the time periods that support such an argument. The remaining parts of the information - showing that divergence - have had to be ditched. Proper science study requires that all the available data be considered, not just a part of it. This particular sin is known as “cherry-picking”.

Please use this form to provide feedback about this new "At a glance" section, which was updated on May 27, 2023 to improve its readability. Read a more technical version below or dig deeper via the tabs above!


Further details

Our Sun is an average-sized main sequence star that is steadily using its hydrogen fuel, situated some 150 million kilometres away from Earth. That distance was first determined (with a small error) by a time consuming and complex set of measurements in the late 1700s. It led to the first systemic considerations of Earth's climate by Joseph Fourier in the 1820s. Fourier's number-crunching led him to realise a planet of Earth's size situated that far from the Sun ought to be significantly colder than it was. He was thereby laying the foundation stone for the line of enquiry that led after a few decades to the discovery of what we now call the Greenhouse Effect – and the way that effect changes in intensity as a response to rising or falling levels of the various greenhouse gases.
TSI Solar cycles

Figure 1: Plot of the observational record (1979-2022) on the scale of the TSIS-1 instrument currently flying on the space station. In this plot, the different records are all cross calibrated to the TSIS-1 absolute scale (e.g., the TSIS1-absolute scale is 0.858 W/m^2 higher than the SORCE absolute scale) so the variability of TSI in this plot is considered to be its “true variability” (within cross calibration uncertainties). Image: Judith Lean.

The Sun has a strong magnetic field, but one that is constantly on the move, to the extent that around every 11 years or so, Solar polarity flips: north becomes south, until another 11 years has passed when it flips back again. These Solar Cycles affect what happens at the surface of the Sun, such as the sunspots caused by those magnetic fields. Each cycle starts at Solar Minimum with very few or no sunspots, then rises mid-cycle towards Solar Maximum, where sunspots are numerous, before falling back towards the end. The total radiation emitted by the Sun – total solar irradiance (TSI) is the technical term – essentially defined as the solar flux at the Earth's orbital radius, fluctuates through this 11-year cycle by up to 0.15% between maximum and minimum.

Such short term and small fluctuations in TSI do not have a strong long term influence on Earth's climate: they are not large enough and as it's a cycle, they essentially cancel one another out. Over the longer term, more sustained changes in TSI over centuries are more important. This is why such information is included, along with other natural and human-driven influences, when running climate models, to ask them, “what if?"

An examination of the past 1150 years found temperatures to have closely matched solar activity for much of that time (Usoskin et al. 2005). But also for much of that time, greenhouse gas concentrations hardly varied at all. This led the study to conclude, "...so that at least this most recent warming episode must have another source."
TSI vs. T
Figure 2: Annual global temperature change (thin light red) with 11 year moving average of temperature (thick dark red). Temperature from NASA GISS. Annual Total Solar Irradiance (thin light blue) with 11 year moving average of TSI (thick dark blue). TSI from 1880 to 1978 from Krivova et al. 2007. TSI from 1979 to 2015 from the World Radiation Center (see their PMOD index page for data updates). Plots of the most recent solar irradiance can be found at the Laboratory for Atmospheric and Space Physics LISIRD site.

The slight decline in Solar activity after 1975 was picked up through a number of independent measurements, so is definitely real. Over the last 45 years of global warming, Solar activity and global temperature have therefore been steadily diverging. In fact, an analysis of solar trends concluded that the sun has actually contributed a slight cooling influence into the mix that has driven global temperature through recent decades (Lockwood, 2008), but the massive increase in carbon-based greenhouse gases is the main forcing agent at present.

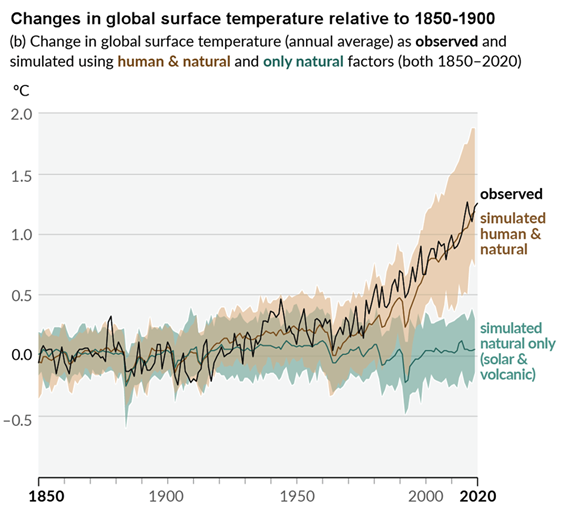
Other studies tend to agree. Foster & Rahmstorf (2011) used multiple linear regression to quantify and remove the effects of the El Niño Southern Oscillation (ENSO) and solar and volcanic activity from the surface and lower troposphere temperature data.  They found that from 1979 to 2010, solar activity had a very slight cooling effect of between -0.014 and -0.023°C per decade, depending on the data set. A more recent graphic, from the IPCC AR6, shows these trends to have continued.

AR6 WGI SPM Figure 1 Panel p

Figure 3: Figure SPM.1 (IPCC AR6 WGI SPM) - History of global temperature change and causes of recent warming panel (b). Changes in global surface temperature over the past 170 years (black line) relative to 1850–1900 and annually averaged, compared to Coupled Model Intercomparison Project Phase 6 (CMIP6) climate model simulations (see Box SPM.1) of the temperature response to both human and natural drivers (brown) and to only natural drivers (solar and volcanic activity, green). For the full image and caption please click here or on the image.

Like Foster & Rahmstorf, Lean & Rind (2008) performed a multiple linear regression on the temperature data, and found that while solar activity can account for about 11% of the global warming from 1889 to 2006, it can only account for 1.6% of the warming from 1955 to 2005, and had a slight cooling effect (-0.004°C per decade) from 1979 to 2005.

Finally, physics does not support the claim that changes in TSI drive current climate change. If that claim had any credence, we would not expect to see the current situation, in which Earth's lower atmosphere is warming strongly whereas the upper atmosphere is cooling. That is exactly the pattern predicted by physics, in our situation where we have overloaded Earth's atmosphere with greenhouse gases. If warming was solely down to the Sun, we would expect the opposite pattern. In fact, the only way to propagate this myth nowadays involves cherry-picking everything prior to 1975 and completely disregarding all the more recent data. That's simply not science.

Longer-term variations in TSI received by Earth

It's also important to mention variations in TSI driven not by Solar energy output but by variations in Earth's orbit, that are of course independent of Solar activity. Such variations, however, take place over very long periods, described by the Milankovitch orbital cycles operating over tens of thousands of years. Those cycles determine the distance between Earth and the Sun at perihelion and aphelion and in addition the tilt the planet's axis of rotation: both affect how much heat-radiation the planet receives at the top of its atmosphere through time. But such fluctuations are nothing like the rapid changes we see in the weather, such as the difference between a sunny day and a cloudy one. The long time-factor ensures that.

Another even more obscure approach used to claim, "it's the sun" was (and probably still is in some quarters) to talk about, "indirect effects". To wit, when studies can't find a sufficiently large direct effect, bring even lesser factors to the fore, such as cosmic rays. Fail.

In conclusion, the recent, post 1975 steep rise in global temperatures are not reflected in TSI changes that have in fact exerted a slight cooling influence. Milankovitch cycles that operate over vastly bigger time-scales simply don't work quickly enough to change climate drastically over a few decades. Instead, the enormous rise in greenhouse gas concentrations over the same period is the primary forcing-agent. The physics predicted what is now being observed.

Last updated on 27 May 2023 by John Mason. View Archives

Printable Version  |  Offline PDF Version  |  Link to this page

Argument Feedback

Please use this form to let us know about suggested updates to this rebuttal.

Related Arguments

Further viewing

Related video from Peter Sinclair's "Climate Denial Crock of the Week" series:

Further viewing

This video created by Andy Redwood in May 2020 is an interesting and creative interpretation of this rebuttal:

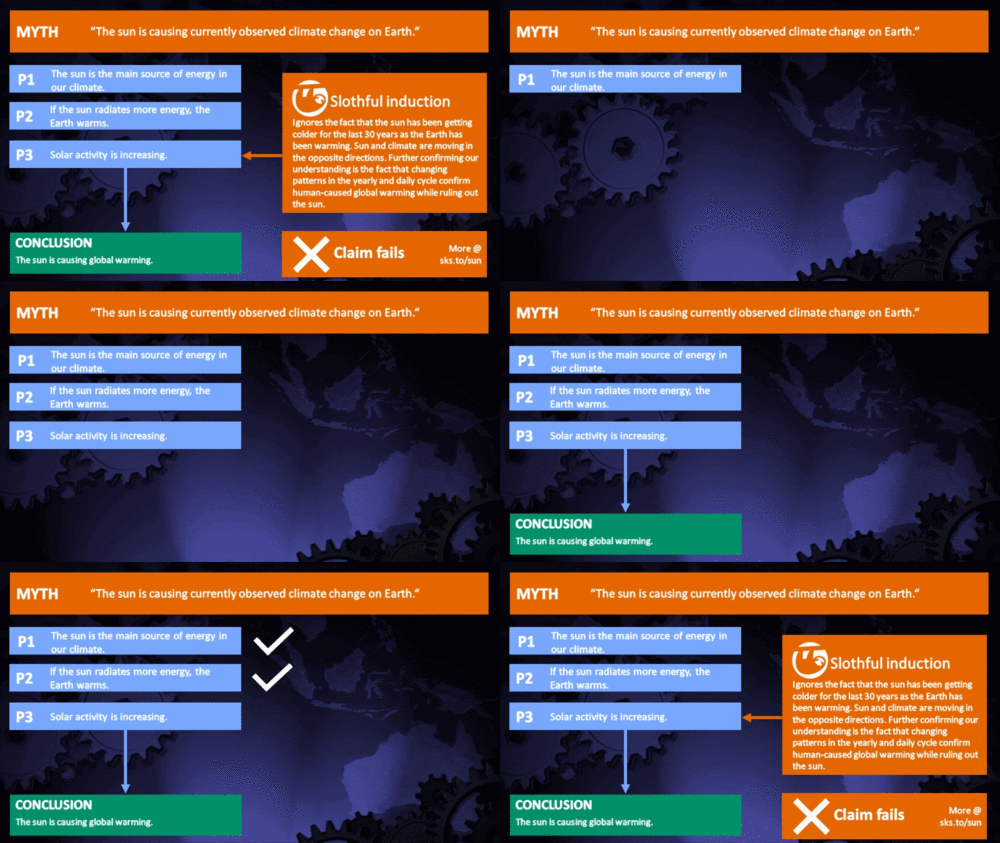
Myth Deconstruction

Related resource: Myth Deconstruction as animated GIF

MD Sun

Please check the related blog post for background information about this graphics resource.

Denial101x videos

Related lecture-videos from Denial101x - Making Sense of Climate Science Denial

and

Additional video from the MOOC

Expert interview with Mike Lockwood

Comments

Prev  16  17  18  19  20  21  22  23  24  25  26  27  28  29  30  31  32  33  34  35  Next

Comments 626 to 650 out of 957:

  1. John Cook - Perhaps a statistical analysis thread would be helpful? I'm afraid I'm not the person to write it, unfortunately...
  2. KR #625 I quite like to recommend this book to people who want to get started with statistics. Although a lot of applied statistics is a bit of a black art that comes from experience of analysing your own data. I'm open to the idea of writing a piece on statistical basics when time permits, but what would be nice would be a statistical naïve to collaborate with :)
  3. kdkd - I'll take a look at your recommended book; if it's as good as their one on genetics, which I've given or pointed out to a number of people, it should be excellent. I can certainly supply some naive if you'd like!
  4. KR #623 kdkd #624 There is no way that the above chart could allow Solar forcing to be dominant in the first half of the 20th century as concluded mostly correctly by kdkd. By setting the Solar forcing to zero in AD1880, when all other forcings except the volcanic aerosol (mainly from Krakatoa) are in fact zero or negligible in order to measure 'differences' ignores the fact that the actual value of the Solar forcing is in the range of 0.3 - 0.5W/sq.m and ongoing since about AD1700. See: http://www.ncdc.noaa.gov/paleo/pubs/ipcc2007/fig613.png There is a major dip in Solar and huge Volcanic cooling around AD1815 coinciding with Tambora, but the Solar forcing curve is positive and increasing in the 0.3 - 0.5W/sq.m range up to the present. If you agree that the areas under the curves represents the energy attributable to each forcing, then there is positive area under the Solar forcing curve since AD1700.
  5. Ken writes: the actual value of the Solar forcing is in the range of 0.3 - 0.5W/sq.m and ongoing since about AD1700. "Since about 1700"? Ken, on the IPCC graph you link to, the black line is well below 0.3 until the 1930s. It never rises as high as 0.5. It also turns downward after 1975. Looking at the period since 1750 to the late 20th century, solar forcing goes from about 0.15 to 0.45. Over the same time period, GHGs go from 0 to over 2.5. So yes, solar irradiance does account for a large part of the warming from 1750 to 1900, and a smaller part of the warming from 1900 to 1940. It accounts for very little of the warming post 1940. Both KR's graph and the IPCC one you link to show this.
  6. Ken - Thank you for that chart, it's very interesting: It also clearly shows my point. Given that the chart I linked from GISS shows deltas from 1880 (not 1750), and in agreement with your chart indicates a TSI delta over that time of ~+0.4W/m^2, while the "All other forcings" in both charts from GHG's sum to ~2W/m^w at the current time, I fail to see any disagreement in our data. The slight rise in TSI seems to be important ('tho not overwhelmingly so) in the early part of this century, warming was damped by high aerosols mid-century, and in the 70's (accompanied by the Clean Air acts and aerosol reduction) GHG forcing became the very dominant factor. Now, as regards to ...setting the Solar forcing to zero in AD1880"", Ken, you still appear to be suffering from some misapprehensions regarding what delta (anomaly) baselines are used for. The chart I linked from the CO2 is not the only driver of climate looks at deltas since 1880, while the one you linked from NOAA/IPCC (here's the article link backing that chart) looks at deltas since ~900AD. Was the climate at equilibrium in 900AD? No. Was it in equilibrium in 1880? In 1750? No and no. But we can certainly look at changes in forcings versus changes in climate, and determine from magnitude and correlation which forcing changes are the dominant drivers of the current temperatures. And, given that information, it's clear that it's not the sun driving late 20th century temperature rises. Nor, for that matter, is it a badly mis-measured TSI at the start of any of these time periods, integrated over the period, as that would show up as a monotonic temperature change over the period of mis-measure, a difference in slope between TSI and temperature. That simply isn't present; there is no unmeasured offset.
  7. Even more interesting in that NOAA/IPPC article you referred to, Ken, 2007 Intergovernmental Panel on Climate Change Working Group I: The Physical Science Basis of Climate Change, Chapter 6 Paleoclimate, is this graph: What's illustrated here are the various forcings on climate, temperature reconstructions (gray bands covering uncertainty ranges on lower graph), and multiple climate model runs with and without anthropogenic forcings. Looking at the lower right of the bottom graph you can see matched color traces with/without GHG additions. It's clear that without the GHG forcings (but with the solar forcing) none of the models can match the current temperature trend. They all predict temperatures going back to levels of the early 1800's. Add the GHG forcings back in, and voila - all the models track measured temperatures fairly closely. It's not the sun.
  8. One side note - the previous posting included a graph that only runs to 2000, not up through 2010.
  9. Ken #629: "By setting the Solar forcing to zero in AD1880, when all other forcings except the volcanic aerosol (mainly from Krakatoa) are in fact zero or negligible in order to measure 'differences' ignores the fact that the actual value of the Solar forcing is in the range of 0.3 - 0.5W/sq.m and ongoing since about AD1700." As has been explained to you before, a 'forcing' is a CHANGE from the baseline value. If 1880 is the baseline then BY DEFINITION the forcing in 1880 is zero. Has to be. That's what the words MEAN.
  10. Well my model was derived empirically from IPCC data. It was pretty naïve statistically speaking, and the model wasn't without its violations of assumptions. On the other hand as the magnitude of CO2 versus solar forcing was roughly consistent with my regression model, I don't see how Ken reaches his conclusion that "is no way that the above chart could allow Solar forcing to be dominant in the first half of the 20th century" (it would be nice if Ken referred to which chart). I think he's got to get over the confirmation bias.
  11. Ned #630 How about we agree on 0.2-0.5W/sq.m for the range of Solar forcing since AD1725. Gridding a very small scale graph I get AD1725 for when the Solar forcing crosses above the 'zero' axis which is pretty close to the end of the Maunder minimum around AD1715. KR #631 "Was the climate at equilibrium in 900AD? No. Was it in equilibrium in 1880? In 1750? No and no. But we can certainly look at changes in forcings versus changes in climate, and determine from magnitude and correlation which forcing changes are the dominant drivers of the current temperatures." Well you tell me KR. How do you know it was NO and NO? Prima facie, the zero axis on the graph implies that positive Solar forcings will add energy and warm the Earth and negative forcings will lose energy and cool the Earth. Is the 'zero' axis not the zero Solar forcing and equilibrium TSI where the Earth neither warms nor cools due to Solar?? If not what else could it be?? If you look at the areas under both Solar and 'All other Forcings' curves in Fig 613 back to the start of the current warming ARO AD1725 they both represent the energy added to the Earth system and they both add together. I don't have an electronic way of doing this but could scan this with an ACAD planimeter and get an estimate on a reasonably scaled graph. kdkd could probably do this with the raw data. Using some crude geometry I have calculated the area under the Solar curve at 9300E20 Joules and the 'All Other Forcings' curve at 10600E20 Joules. I assume that 'all other' means every forcing on your chart at #623 netted into one curve. This gives a roughly 45/55% ratio Solar/All Other for not just the first half of the 20th century - but the whole period 1725 up to 2000. My point which brought on this debate is that if the 'zero' axis on any of the forcings (but Solar is most important due to its constant presence) was shifted down or up by a small amount - a large extra slice of area is added or subtracted from the area under the curve. eg 0.05W/sq.m shift over 250 years is over 2000E20 Joules in added or lost energy. I assume you are also not including the climate response forcings (IR cooling and WV feedbacks) in this analysis which net currently is -0.7 W/sq.m and would give a significant energy loss area under its curve to add to the Solar and All Other above. We are assuming here that Volcanic evens itself out over time which curve seems to be roughly equal in area above and below its 'zero' axis. When you talk of modelling temperatures and forcings - I assume you mean land and ocean temperatures - the response of which would have a thermal lag, as 90%+ of the calculated energy imbalance should reside in the oceans which have huge thermal mass. What would be the models' general assumptions regarding thermal lags in that composite temperature?
  12. Ken Lambert - You ask "How do you know it was NO and NO?"; how do I know that the climate wasn't in equilibrium in 900, 1750, 1880? Very simple, Ken. The slope of temperature change entering into those years, as shown by instrumental and proxy records, was not at or even close to zero. If the world was at equilibrium, you would see only seasonal changes in temperature. But given the time constants for ocean energy change, variations in forcings, etc., it would take a fairly significant time period for equilibrium to settle. [Side note - the fact that the various models track the paleoclimate record using historic forcings indicates that they are doing a reasonable job of dealing with thermal lags] 1750 has perhaps the best (not perfect) chance of being at equilibrium of those three dates - 900 temps have a steady downward trend, part of the Little Ice Age, I suspect, while 1880 is in early industrialization with numerous forcing changes from early CO2. But as the various forcings move around, the climate can only follow, only hitting equilibrium if (a) forcings don't change for a period long enough for the oceans to catch up, or (b) forcings reverse and pass climate change going the other way. I believe (IMO) that you are stuck on the "baseline" definition here, Ken. A proper analysis starting from a baseline includes not only changes after the baseline (forcing deltas, in this case), but the original trajectory of the system prior to the baseline, which includes all forcings at that date. Given those you can measure magnitude and correlation of trajectory changes relative to forcing changes. Failing to incorporate the baseline trajectory, the history, would be a massive error - but as far as I can see nobody has made that particular mistake. Only you, if you insist that existent forcings at the baseline are not included in the original temperature trajectories. Your "large extra slice of area" is part and parcel of the non-equilibrium trajectory at the baseline date; part of the history. I really don't know what else I can say, Ken. It's really that simple.
  13. Ken Lambert writes: How about we agree on 0.2-0.5W/sq.m for the range of Solar forcing since AD1725. How about we don't try to maximize confusion by blurring the distinction between time periods? You claimed that a graph showed that "the actual value of the Solar forcing is in the range of 0.3 - 0.5W/sq.m and ongoing since about AD1700" That was a highly misleading statement, since the actual graph showed it not even rising up to 0.3 -- the bottom end of your claimed range for the past three centuries -- until the 1930s. Ken continues: Is the 'zero' axis not the zero Solar forcing and equilibrium TSI where the Earth neither warms nor cools due to Solar?? If not what else could it be?? Ken, there is no unique "equilibrium TSI where the Earth neither warms nor cools due to Solar". No such number exists! There are infinitely many possible values of TSI which would produce neither warming nor cooling of the Earth. I keep making this point and you keep ignoring it. Assume that TSI is currently X. Now, assume that it increases to X+0.25 W/m2. The additional irradiance causes the planet to heat up, and feedbacks in the climate system amplify that warming slightly. As the planet warms, outgoing longwave radiation increases per Stefan-Bolzmann, until the planet reaches a new equilibrium where all of the following are true: (1) TSI is X+0.25 (2) Outgoing longwave radiation has risen to balance that increase in TSI (3) The temperature is stabilized at a new, higher level, and the planet is neither being warmed nor cooled. You keep assuming that any departure from some imaginary equilibrium TSI would lead to perpetually increasing or decreasing temperature. That is just plain wrong -- fortunately, because if you were right there would probably be no life on this planet! Ken continues: Using some crude geometry I have calculated [...] This gives a roughly 45/55% ratio Solar/All Other for not just the first half of the 20th century - but the whole period 1725 up to 2000. You are once again lumping together different periods of time. I assume you're just inadvertently deceiving yourself rather than deliberately trying to deceive others. Before the early 20th century, solar forcing is much larger than GHG forcing. By the mid 20th century, GHGs are catching up and passing solar. In the late 20th century, GHG forcing is very large and solar is not merely smaller in relative terms, it's actually decreasing post 1975.
  14. Gah - writing too fast. In my previous post I should have said "1750 was part of the end of the LIA", not "900".
  15. "You claimed that a graph showed that "the actual value of the Solar forcing is in the range of 0.3 - 0.5W/sq.m and ongoing since about AD1700" That was a highly misleading statement, since the actual graph showed it not even rising up to 0.3 -- the bottom end of your claimed range for the past three centuries -- until the 1930s." You are exaggerating and splitting hairs Ned. Some of the proxies are higher than the black line average and some naturally below. The highest is about 0.4W/sq.m circe AD1750. I can dig up the actual numbers from the site and check it - but for now 0.2 - 0.5 is good enough. My point about the area under the curve being the total energy is the critical one. "Ken, there is no unique "equilibrium TSI where the Earth neither warms nor cools due to Solar". No such number exists! There are infinitely many possible values of TSI which would produce neither warming nor cooling of the Earth. I keep making this point and you keep ignoring it." Again - such a number MUST exist for the pre-industrial (unforced by AG forcings) Earth. Conservation of mass would indicate that the Earth has a constant amount of dirt, water (in ice of liquid form) air etc etc. There would be an overall function which takes into account the specific heats, latest heats etc of the whole Earth system subject to warming by external forcings. "I assume you are also not including the climate response forcings (IR cooling and WV feedbacks) in this analysis which net currently is -0.7 W/sq.m and would give a significant energy loss area under its curve to add to the Solar and All Other above." I have already mentioned S-B IR cooling plus feedbacks as being added to the other forcings which will bring the system toward equilibrium. S-B cooling is currently -2.8W/sq.m and proportional to T^4 so will rise rapidly with actual temperature increase - closing the forcing gap (unless WV and ice feedbacks rise faster) The S-B IR + WV response curves should be included in these 'AG Radiative Forcing' charts with Solar so the viewers can get the real picture of the overall warming curve for the planet. Try harder next time Ned.
  16. Has anyone a comment on this report of variations in solar output during 2004-2007? "The amount of visible radiation entering the lower atmosphere was increasing, which implies warming at the surface," says atmospheric physicist Joanna Haigh of Imperial College London, who led the research, published in Nature on October 7. But the change from 2004 to 2007 in the sun's output of visible light, and the attendant warming at Earth's surface of 0.1 watt per square meter, is roughly equivalent to the overall forcing of the sun on the climate over the past 25 years—estimated by the U.N. IPCC to be an additional 0.12 watt per square meter. That suggests scientists may have overestimated the sun's role in climate change. Regardless, the solar change is dwarfed by the impact from the extra heat trapped by CO2 alone since 1750: an additional 1.66 watts per square meter, an effect that other greenhouse gases, such as methane, strengthen further. In other words, whereas the new satellite measurements call into question computer models of solar output, it does not change the fundamental physics of human-induced global warming.
  17. RC have a post up on it - which is basically "wait and see, we think it is instrument error".
  18. Ken Lambert - You haven't responded to my latest post. Do you understand that the 'baseline' is the starting point for forcing deltas, and that the incoming trajectory for temperature incorporates the forcings existing at the baseline timepoint? The offset you are so concerned about?
  19. *Including* the offset you are so concerned about?
  20. Ken writes: Try harder next time Ned. Not going to happen. After the fiasco of the Waste Heat thread, I'm no longer willing to expend indefinitely large efforts on repeatedly explaining the same points over and over again without any evidence of benefit. Yes, you do mention the OLR negative feedback that leads all forcings to decay towards 0 over time, as the planet's outgoing radiation increases or decreases. But you are still blindly ignoring this when you talk about your imaginary "equilibrium TSI". In fact, there is a continuous range of TSI values, any one of which can be balanced by a corresponding OLR value, leading to some particular stable temperature. There is no reason why one particular TSI value can or should be artificially promoted as the uniquely special equilibrium TSI that the Earth wants to be in balance with. If you still don't get this, someone else can take over, because I'm done.
  21. muoncounter #641: Yes, I saw that report too. The bit about the magnitude of any solar change being "dwarfed" by the increase in CO2 forcing makes it somewhat of a minor issue AND the researchers note that the results need further verification... but it is certainly an interesting new wrinkle. Unfortunately, if validated it would essentially mean that we can't be sure about precise solar forcings prior to this kind of detailed spectral analysis. Is a solar minimum ALWAYS accompanied by higher output of VISIBLE light or was that the case for this particular minimum but not all? Are solar maximums characterized by DECREASED visible light or exceptionally increased levels? However, again... the possible range of variation here is more than an order of magnitude less than GHG forcings. The report also shows that while the solar forcing for 2004-2007 may have been greater than would have been suggested by looking at total solar irradiance (rather than a specific wavelength analysis)... it was still less than the IPCC projected for this time period.
  22. KL #various Your "area under the curve" stuff is (from a statistical perspective) just a calculus-centric view of talking about regression models. We've done that to death elsewhere, and it doesn't confirm your over-complex, often illogical, statistically illiterate and difficult to ascertain argument. Come up with something new and I'll be happy to assess your arguments on its merits. This particular dead horse however is well and truely flogged.
  23. CBD, "the possible range of variation here is more than an order of magnitude less than GHG forcings. ... solar forcing for 2004-2007 ... was still less than the IPCC projected for this time period. " I thought those were the salient take-aways, especially in the context of 'its the sun' and 'its only the sun'. Funny how order of magnitude seems to get lost when discussing the role of various deltas.
  24. Ned #645 Clearly the waste heat thread went pear-shaped after I left. Ned: "Yes, you do mention the OLR negative feedback that leads all forcings to decay towards 0 over time, as the planet's outgoing radiation increases or decreases. But you are still blindly ignoring this when you talk about your imaginary "equilibrium TSI". In fact, there is a continuous range of TSI values, any one of which can be balanced by a corresponding OLR value, leading to some particular stable temperature. There is no reason why one particular TSI value can or should be artificially promoted as the uniquely special equilibrium TSI that the Earth wants to be in balance with. If you still don't get this, someone else can take over, because I'm done." Ned, you have just confirmed exactly my contention about a 'unique' TSI corresponding to a particular 'Equilibrium' temperature. Let's repeat what you say above: "In fact, there is a continuous range of TSI values, any one of which can be balanced by a corresponding OLR value, leading to some particular stable temperature." Question: And can you guess what that particular temperature of interest is? Answer: The Earth's temperature in AD1750 which according to you and the AGW community is 0.8 degC COOLER than today's temperature. And what follows from that is that we have a TSI AD1750 corresponding to Temp AD1750. Pray tell me then Ned what is the value of TSI AD1750? And after you have done that you should than be able to advise what particular TSI value corresponds to an Earth temperature 0.8 degrees higher than that of AD1750.
  25. Ken Lambert - I would agree, there is one TSI for one equilibrium temperature of the Earth, with all other variables held constant. Of course, if you change (for example) CO2 levels, the equilibrium temperature for a particular TSI will change, as the radiative efficiency of the Earth will change. But all other variables are not held constant. The other radiative influence changes are much much larger over the last 150 years. This is a multi-variate issue, and you're only looking at TSI vs. Temperature!!! So: - You insist upon equilibriums, when it's obvious from the temperature record that temps were not at equilibrium in 1750 (cooling slightly), - You don't recognize that existing forcings at any baseline date are incorporated in the temperature trajectory entering that baseline (your offset concerns), - You're going on about equilibrium TSI, when the TSI deltas are an order of magnitude less than the other forcing changes, - And most importantly, you're not (in any of the recent comments here, here, or elsewhere) including the CO2 or aerosol radiative deltas in your 'equilibrium' considerations. This horse has been flogged to death, Ken - you are hunting for a solar cause, you are not considering the relative magnitudes and importance of the radiative factors, and have ceased to add content to the discussion some time ago. I'm out of here...

Prev  16  17  18  19  20  21  22  23  24  25  26  27  28  29  30  31  32  33  34  35  Next

Post a Comment

Political, off-topic or ad hominem comments will be deleted. Comments Policy...

You need to be logged in to post a comment. Login via the left margin or if you're new, register here.

Link to this page


The Consensus Project Website

THE ESCALATOR

(free to republish)


© Copyright 2024 John Cook
Home | Translations | About Us | Privacy | Contact Us