Climate Science Glossary

Term Lookup

Enter a term in the search box to find its definition.

Settings

Use the controls in the far right panel to increase or decrease the number of terms automatically displayed (or to completely turn that feature off).

Term Lookup

Settings


All IPCC definitions taken from Climate Change 2007: The Physical Science Basis. Working Group I Contribution to the Fourth Assessment Report of the Intergovernmental Panel on Climate Change, Annex I, Glossary, pp. 941-954. Cambridge University Press.

Home Arguments Software Resources Comments The Consensus Project Translations About Support

Bluesky Facebook LinkedIn Mastodon MeWe

Twitter YouTube RSS Posts RSS Comments Email Subscribe


Climate's changed before
It's the sun
It's not bad
There is no consensus
It's cooling
Models are unreliable
Temp record is unreliable
Animals and plants can adapt
It hasn't warmed since 1998
Antarctica is gaining ice
View All Arguments...


Username
Password
New? Register here
Forgot your password?

Latest Posts

Archives

Sun & climate: moving in opposite directions

What the science says...

Select a level... Basic Intermediate Advanced

The sun's energy has decreased since the 1980s but the Earth keeps warming faster than before.

Climate Myth...

It's the sun

"Over the past few hundred years, there has been a steady increase in the numbers of sunspots, at the time when the Earth has been getting warmer. The data suggests solar activity is influencing the global climate causing the world to get warmer." (BBC)

At a glance

Thankfully for us, our Sun is a very average kind of star. That means it behaves stably over billions of years, steadily consuming its hydrogen fuel in the nuclear reaction that produces sunshine.

Solar stability, along with the Greenhouse Effect, combine to give our planet a habitable range of surface temperatures. In contrast, less stable stars can vary a lot in their radiation output. That lack of stability can prevent life, as we know it, from evolving on any planets that might orbit such stars.

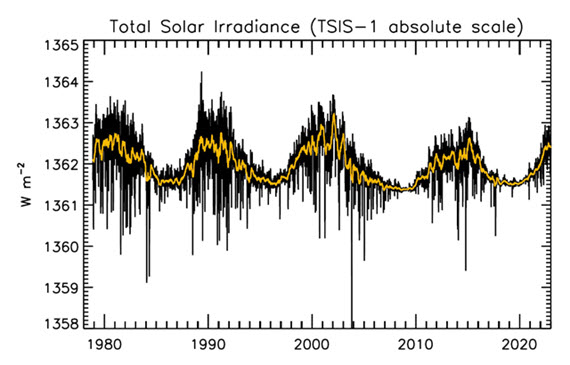
That the Sun is a stable type of star is clearly demonstrated by the amount of Solar energy reaching Earth's average orbital position: it varies very little at all. This quantity, called the Total Solar Irradiance, has been measured for around forty years with high accuracy by sensitive instruments aboard satellites. Its average value is 1,362 watts per square metre. Irradiance fluctuates by about a watt either way, depending on where we are within the 11-year long sunspot cycle. That's a variation of no more than 0.15%.

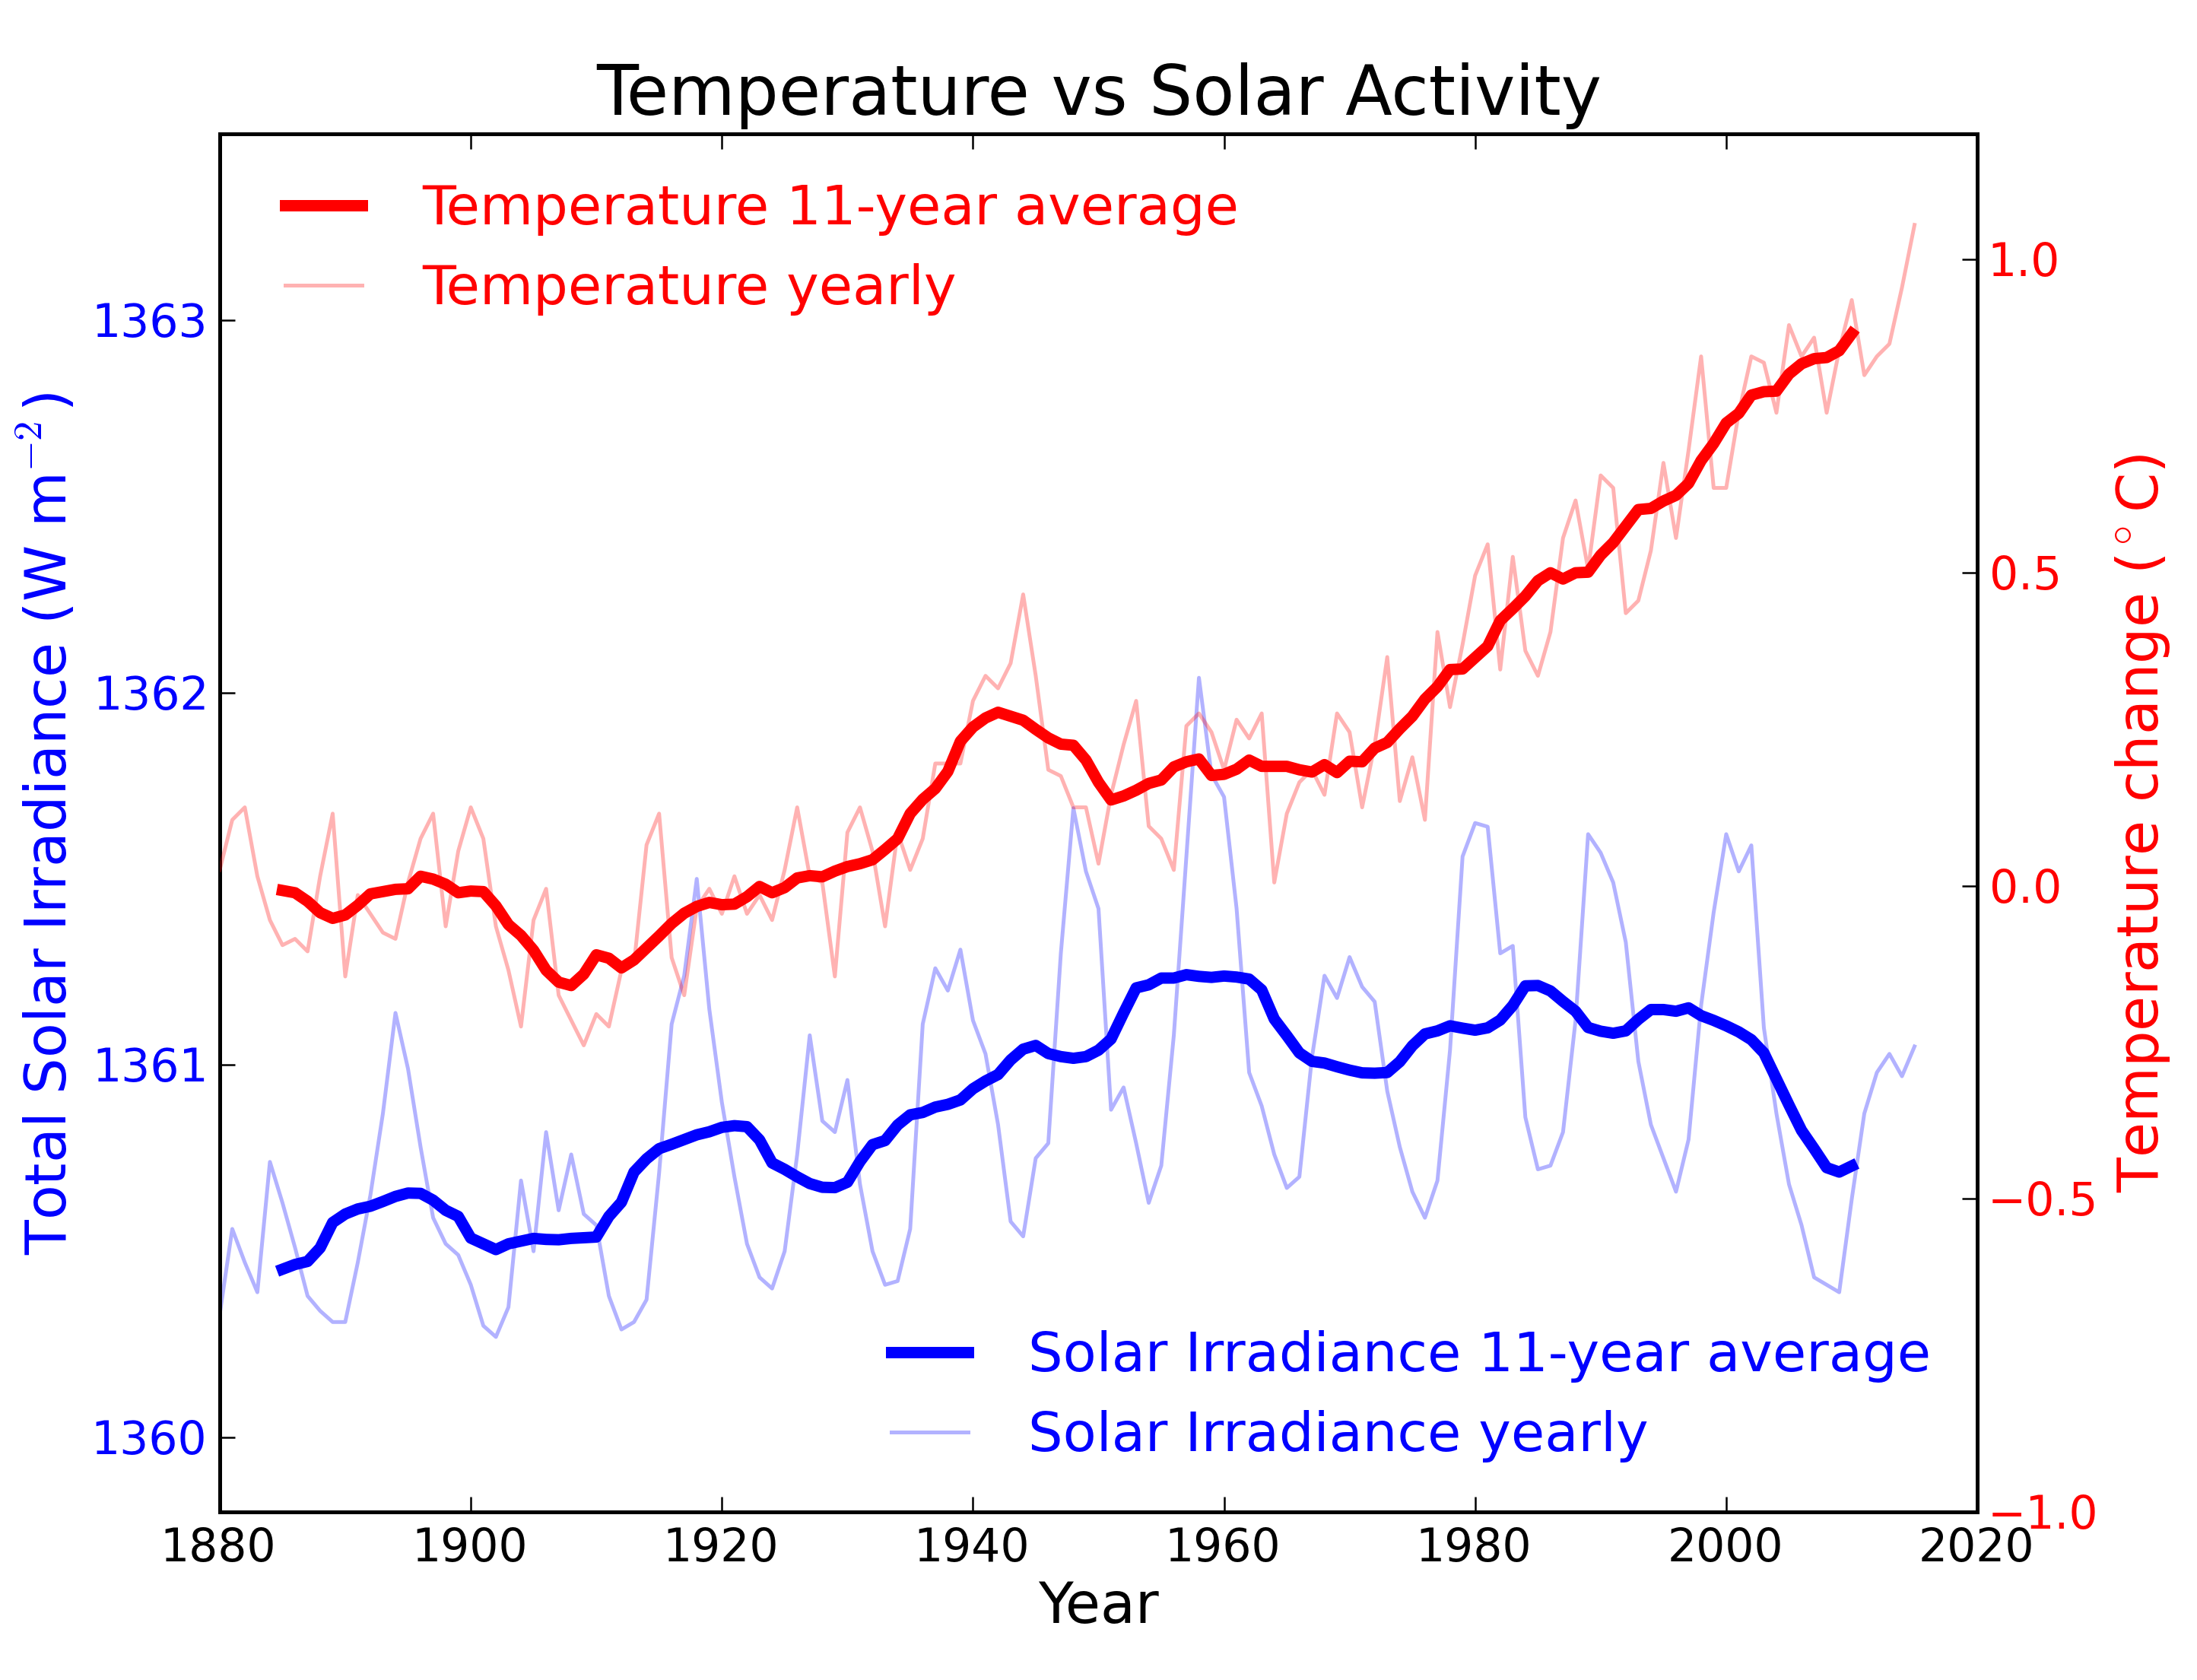
From the early 1970s until today, the Solar radiation reaching the top of Earth's atmosphere has in fact shown a very slight decline. Through that same period, global temperatures have continued to increase. The two data records, incoming Solar energy and global temperature, have diverged. That means they have gone in opposite directions. If incoming Solar energy has decreased while the Earth continues to warm up, the Sun cannot be the control-knob of that warming.

Attempts to blame the sun for the rise in global temperatures have had to involve taking the data but selecting only the time periods that support such an argument. The remaining parts of the information - showing that divergence - have had to be ditched. Proper science study requires that all the available data be considered, not just a part of it. This particular sin is known as “cherry-picking”.

Please use this form to provide feedback about this new "At a glance" section, which was updated on May 27, 2023 to improve its readability. Read a more technical version below or dig deeper via the tabs above!


Further details

Our Sun is an average-sized main sequence star that is steadily using its hydrogen fuel, situated some 150 million kilometres away from Earth. That distance was first determined (with a small error) by a time consuming and complex set of measurements in the late 1700s. It led to the first systemic considerations of Earth's climate by Joseph Fourier in the 1820s. Fourier's number-crunching led him to realise a planet of Earth's size situated that far from the Sun ought to be significantly colder than it was. He was thereby laying the foundation stone for the line of enquiry that led after a few decades to the discovery of what we now call the Greenhouse Effect – and the way that effect changes in intensity as a response to rising or falling levels of the various greenhouse gases.
TSI Solar cycles

Figure 1: Plot of the observational record (1979-2022) on the scale of the TSIS-1 instrument currently flying on the space station. In this plot, the different records are all cross calibrated to the TSIS-1 absolute scale (e.g., the TSIS1-absolute scale is 0.858 W/m^2 higher than the SORCE absolute scale) so the variability of TSI in this plot is considered to be its “true variability” (within cross calibration uncertainties). Image: Judith Lean.

The Sun has a strong magnetic field, but one that is constantly on the move, to the extent that around every 11 years or so, Solar polarity flips: north becomes south, until another 11 years has passed when it flips back again. These Solar Cycles affect what happens at the surface of the Sun, such as the sunspots caused by those magnetic fields. Each cycle starts at Solar Minimum with very few or no sunspots, then rises mid-cycle towards Solar Maximum, where sunspots are numerous, before falling back towards the end. The total radiation emitted by the Sun – total solar irradiance (TSI) is the technical term – essentially defined as the solar flux at the Earth's orbital radius, fluctuates through this 11-year cycle by up to 0.15% between maximum and minimum.

Such short term and small fluctuations in TSI do not have a strong long term influence on Earth's climate: they are not large enough and as it's a cycle, they essentially cancel one another out. Over the longer term, more sustained changes in TSI over centuries are more important. This is why such information is included, along with other natural and human-driven influences, when running climate models, to ask them, “what if?"

An examination of the past 1150 years found temperatures to have closely matched solar activity for much of that time (Usoskin et al. 2005). But also for much of that time, greenhouse gas concentrations hardly varied at all. This led the study to conclude, "...so that at least this most recent warming episode must have another source."
TSI vs. T
Figure 2: Annual global temperature change (thin light red) with 11 year moving average of temperature (thick dark red). Temperature from NASA GISS. Annual Total Solar Irradiance (thin light blue) with 11 year moving average of TSI (thick dark blue). TSI from 1880 to 1978 from Krivova et al. 2007. TSI from 1979 to 2015 from the World Radiation Center (see their PMOD index page for data updates). Plots of the most recent solar irradiance can be found at the Laboratory for Atmospheric and Space Physics LISIRD site.

The slight decline in Solar activity after 1975 was picked up through a number of independent measurements, so is definitely real. Over the last 45 years of global warming, Solar activity and global temperature have therefore been steadily diverging. In fact, an analysis of solar trends concluded that the sun has actually contributed a slight cooling influence into the mix that has driven global temperature through recent decades (Lockwood, 2008), but the massive increase in carbon-based greenhouse gases is the main forcing agent at present.

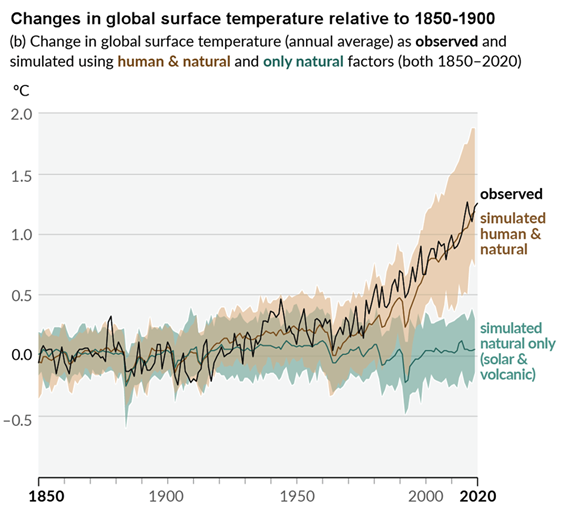
Other studies tend to agree. Foster & Rahmstorf (2011) used multiple linear regression to quantify and remove the effects of the El Niño Southern Oscillation (ENSO) and solar and volcanic activity from the surface and lower troposphere temperature data.  They found that from 1979 to 2010, solar activity had a very slight cooling effect of between -0.014 and -0.023°C per decade, depending on the data set. A more recent graphic, from the IPCC AR6, shows these trends to have continued.

AR6 WGI SPM Figure 1 Panel p

Figure 3: Figure SPM.1 (IPCC AR6 WGI SPM) - History of global temperature change and causes of recent warming panel (b). Changes in global surface temperature over the past 170 years (black line) relative to 1850–1900 and annually averaged, compared to Coupled Model Intercomparison Project Phase 6 (CMIP6) climate model simulations (see Box SPM.1) of the temperature response to both human and natural drivers (brown) and to only natural drivers (solar and volcanic activity, green). For the full image and caption please click here or on the image.

Like Foster & Rahmstorf, Lean & Rind (2008) performed a multiple linear regression on the temperature data, and found that while solar activity can account for about 11% of the global warming from 1889 to 2006, it can only account for 1.6% of the warming from 1955 to 2005, and had a slight cooling effect (-0.004°C per decade) from 1979 to 2005.

Finally, physics does not support the claim that changes in TSI drive current climate change. If that claim had any credence, we would not expect to see the current situation, in which Earth's lower atmosphere is warming strongly whereas the upper atmosphere is cooling. That is exactly the pattern predicted by physics, in our situation where we have overloaded Earth's atmosphere with greenhouse gases. If warming was solely down to the Sun, we would expect the opposite pattern. In fact, the only way to propagate this myth nowadays involves cherry-picking everything prior to 1975 and completely disregarding all the more recent data. That's simply not science.

Longer-term variations in TSI received by Earth

It's also important to mention variations in TSI driven not by Solar energy output but by variations in Earth's orbit, that are of course independent of Solar activity. Such variations, however, take place over very long periods, described by the Milankovitch orbital cycles operating over tens of thousands of years. Those cycles determine the distance between Earth and the Sun at perihelion and aphelion and in addition the tilt the planet's axis of rotation: both affect how much heat-radiation the planet receives at the top of its atmosphere through time. But such fluctuations are nothing like the rapid changes we see in the weather, such as the difference between a sunny day and a cloudy one. The long time-factor ensures that.

Another even more obscure approach used to claim, "it's the sun" was (and probably still is in some quarters) to talk about, "indirect effects". To wit, when studies can't find a sufficiently large direct effect, bring even lesser factors to the fore, such as cosmic rays. Fail.

In conclusion, the recent, post 1975 steep rise in global temperatures are not reflected in TSI changes that have in fact exerted a slight cooling influence. Milankovitch cycles that operate over vastly bigger time-scales simply don't work quickly enough to change climate drastically over a few decades. Instead, the enormous rise in greenhouse gas concentrations over the same period is the primary forcing-agent. The physics predicted what is now being observed.

Last updated on 27 May 2023 by John Mason. View Archives

Printable Version  |  Offline PDF Version  |  Link to this page

Argument Feedback

Please use this form to let us know about suggested updates to this rebuttal.

Related Arguments

Further viewing

Related video from Peter Sinclair's "Climate Denial Crock of the Week" series:

Further viewing

This video created by Andy Redwood in May 2020 is an interesting and creative interpretation of this rebuttal:

Myth Deconstruction

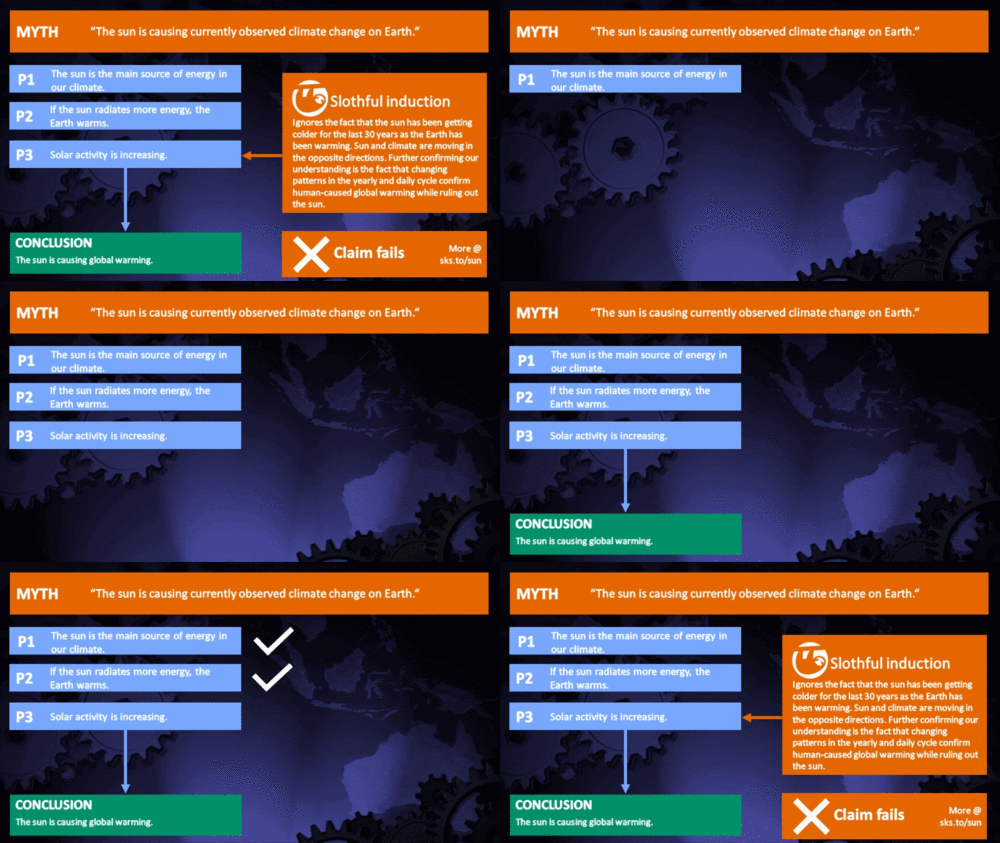
Related resource: Myth Deconstruction as animated GIF

MD Sun

Please check the related blog post for background information about this graphics resource.

Denial101x videos

Related lecture-videos from Denial101x - Making Sense of Climate Science Denial

and

Additional video from the MOOC

Expert interview with Mike Lockwood

Comments

Prev  23  24  25  26  27  28  29  30  31  32  33  34  35  36  37  38  39  40  41  42  Next

Comments 901 to 925 out of 1035:

  1. Yes Tom, If solar activity has a sginificant impact, then if sunspot numbers remain low, we should expect to see a temperature decrease similar to that observed during the early 20th century. It is too early to tell if the recent flattening will be a top similar to the previous two.
    Response: [Dikran Marsupial] What temperature decrease in the early 20th century?

    You do understand that decadal trends are not robust and signify very little?
  2. The 0.2 - 0.3C drop that occurred from 1880 - 1910. Sorry if I should have said late 19th / early 20th century, but I thought it would have been evident to anyone reading. See Tom's post of 899.
    Response: [Dikran Marsupial] The point is that you need to show the data that demonstrates your point, in this case how solar forcing affects temperature. At the moment your comments are too vague to convince or to refute effectively. The comment about decadal scale trends also applies to the present time, can you demonstrate that the current levelling off is forced or just the result of internal climate variability. If not you shouldn't be making arguments about what it means.
  3. EtR#900: "does that negate the fact that an increase has occurred?" The recent divergence between solar activity (decreasing, as measured by ssn) and rising temperature anomaly in this graph is obvious. That ssn 'increase' is over - and yet we're still warming. That's what the data show - what you 'believe' cannot negate that fact. That observation alone should cause you to question those beliefs; to cling to beliefs that so utterly conflict with data is a sign of one who is in denial. EtR#901: "too early to tell if the recent flattening will be a top" What recent flattening? Not seeing it here: Not seeing any flattening here either. Overall, the combined global land and ocean surface temperature for July 2011 was the seventh warmest July since records began in 1880, with an anomaly of 0.57°C (1.03°F) above the 20th century average. I suppose if you buy into the 'global warming stopped in ___' meme, you should see one of those threads.
  4. Every energy source accessible to the human species is created – either directly or indirectly – through nuclear reactions powering the sun and stars. Every atom of our planet – from the fissionable atoms of uranium and plutonium, to the carbon, hydrogen and oxygen atoms of our bodies, comprise the end products of nuclear processes. The numerous chemical, physical and nuclear quanta of energy transiently packaged within coal, oil, gas, wood, food, geothermal, hydrothermal, hydroelectric, wind, wave, electromagnetic, heat, solar, uranium, plutonium, hydrogen, neutrons and protons, are all sourced ultimately from fundamental nuclear reactions occurring deep within the sun and stars. No energy source is renewable in nature, only degradable, degrading inexorably with time as a cascading decay of energy states from protons through to coal. This inescapable degradation is enshrined as physical law: the second law of thermodynamics. In common with other stars, the sun steadily releases this energy as gamma radiation, deep within its central core, and primarily through the proton-proton reaction (ref1), the same nuclear reaction that powers the hydrogen bomb. In this simple reaction, four hydrogen nuclei fuse together to make one helium nucleus, releasing in the process 26.73 MeV (or 1.02 x 10^-22 ton oil equivalent) of energy in the form of gamma rays (ref2). Streaming out from the sun’s central core at some 10^38 per second (ref3), the gamma ray photons are continually absorbed and re-emitted as less energetic photons, eventually reaching the surface of the sun and escaping into surrounding space primarily as photons of visible light, along with sizable amounts of every other form of radiation. It is this lethal flux of radiation that has irradiated the naked Earth for 4.5 billion years now. It is this radiation which powers, supports, initiates and drives (through genetic mutation) the numerous processes of biochemical diversification we call life. It is this radiation which directly and indirectly, creates, supports and controls the so-called biosphere of life-tolerant conditions on Earth, conditions that nourish, support, protect, evolve and eventually extinguish each species of life on this planet. Energy is radiation. Radiation is energy. The ultimate source of both is nuclear. It is that simple in nature. Humanity’s real problem comes with the politics of energy, a vastly more complicated and intractable issue altogether. An issue it seems, which dare not be stated in four hundred words, far less solved. ref 1 http://en.wikipedia.org/wiki/Proton%E2%80%93proton_chain_reaction ref 2 http://en.wikipedia.org/wiki/Units_of_energy ref 3 http://en.wikipedia.org/wiki/Sun
    Response:

    [DB] Rambling dissertations aside, do you have a point with this?

  5. I have seen a chart which shows the record of daily hours of sunshine in England, gradually increasing over 50 years, and correlating with temperature increase in UK. Sunshine Records must go back many years, in many places. Are there any global analyses of sunshine hours from the various sources?
  6. lancelot, can you cite a source for the supposed increase? I'm also not sure what you mean by 'sunshine hours'. Are cloudy days excluded? If so, at what 'level of cloudiness'? If cloudy days are not considered then the number of hours that the sun shines on various parts of the Earth is entirely a factor of the planet's orbit and inclination... and thus should not be showing any significant long term variation. In any case, satellite readings of total incoming solar radiation should be far more accurate than whatever measurement is being suggested here.
  7. The mention of solar irradiance points to another major failing of climate models: that they totally ignore the sun, which is the source of all the energy in the world, except for minor contributions from the molten core of the planet and the decay of radioactive elements. The Total Solar Irradiance (TSI) varies in an 11 year sunspot cycle, during which the sun builds up from a small to a large number of sunspots, which then again decline in number. The importance of the Solar cycle for climate on earth is convincingly demonstrated by the Maunder Minimum, which saw the lowest temperatures of the Little Ice Age. During one 30-year period within the Maunder Minimum, astronomers observed only about 50 sunspots, as opposed to a more typical 40,000-50,000 spots in modern times. The IPCC discounted the significance of the sun for increasing temperatures, because there has been only a 0.1% increase in TSI since the seventeenth century. But, as Carter (2010: 48-50) pointed out, this is to forget the other ways in which the sun can influence climate: • Variations in the intensity of the sun’s magnetic field with cycles including the Schwabe (eleven year), Hale (22 years) and Gleissberg (70-90 years). • Effect of the sun’s plasma and electromagnetic fields on rates of the earth’s rotation, and hence the length of the day. • Effect of the sun’s gravitational field through the 18.6 year Lunar Nodal Cycle, causing variation in atmospheric pressure, temperature, rainfall, sea-level and ocean temperatures, especially at high latitudes. • Known links between solar activity and monsoonal activity, or the phases of climate oscillations such as the Atlantic Multidimensional Oscillation, a 60-year long cycle during which sea surface temperatures vary about 0.2°C above and below the long-term average, with effects on northern hemisphere air temperature, rainfall and drought. • Magnetic fields associated with solar flares, which modulate galactic cosmic ray input into the Earth’s atmosphere. This in turn may cause variations in the formation of low-level clouds. This causes cooling: a one per cent variation in low cloud cover producing a similar change in forcing to the estimated increase caused by human green-house gases. • The 1500 year-long Bond Cycle, as a result of which the three most recent warm peaks of this cycle had a major effect on the Minoan, Roman and Medieval Warm Periods As Robert Carpenter (2010) has stated: “That many of the mechanisms and possible mechanisms by which the sun influences Earth’s climate are poorly understood is no justification for ignoring them.” Of immediate relevance is the fact that solar cycles longer than the eleven year average are followed by later cycles of lesser intensity, and with it a cooler climate. According to Archibald (2010), Cycle 24 may produce cooling of up to 2.2°C for the mid-latitude grain-growing areas of the northern hemisphere. This may have already started. Dr. Vincent Courtillot, who is a professor of geophysics at the University Paris-Diderot and Chair of paleomagnetism and geodynamics of the Institut Universitaire de France, has pointed (2011) to the failure of climate models in relation to the sun. He notes that while the total solar irradiance (TSI) only varies by about 0.1% over a solar cycle, the solar UV varies by about 10% and that secondary effects on cloud formation may vary up to 30% over solar cycles. The IPCC computer models dismiss the role of the sun by only considering the small variations of the TSI and ignore the large changes in the most energetic and influential part of the solar spectrum – the ultraviolet. John Penhallurick
  8. jpenhall 46: What an incredibly poorly informed screed. It should be noted that the IPCC has examined potential additional effects from the sun such as the purported effects of Galactic Cosmic Rays (modulated by the solar magnetic field). However, most of the items on your list have no known causal mechanism whereby they could effect climate. Why changes of the length of the day should cause warming or cooling is completely unexplained, but you are here to criticize climate scientists, not for ignoring your alternative theory, but for not inventing it for you as well. Further, some of the items are not even solar related. For example the Lunar Nodal Cycle is, surprise surprise, a Lunar, not a solar effect. More bizzare is the inclusion of Bond Cycles (conjectured climate cooling events) as being a solar cycle. They may be, but the evidence for that has not been presented, and simply naming a climate cycle as a solar cycle is not evidence. Tellingly you equate the Bond cycle to warming events, whereas it is a cycle of cooling events with a quasi-periodicity of 1470 years. Of course, given that Bond events are multi-century events and that the last one peeked 1400 years ago, if they theory of Bond Cycles is any good, we should be in the middle of a massive cooling event at the moment, not a warming one. Ignoring all theory, however, you simply take the name, invert the sign and suppose that it is coming centuries early (based on your incorrect suposition that the MWP being the last event) as an explanation of the modern warming because, evidently, for you straw is preferable to following the clear evidence of anthropogenic global warming.
  9. (-snip-)
    Response:

    [DB] If you wish to discuss the science of the OP, fine.  Shamelessly self-promoting your book here is not.  Future comments of this nature posted here will simply be deleted and your commenting privileges may be revoked.

    Please note that posting comments here at SkS is a privilege, not a right.  This privilege can be rescinded if the posting individual treats adherence to the Comments Policy as optional, rather than the mandatory condition of participating in this online forum.

    Please take the time to review the policy and ensure future comments are in full compliance with it.  Thanks for your understanding and compliance in this matter.

  10. There is a direct relationship between the Solar Sunspot Cycle (11.028148 yrs)the Lunar Metonic Cycle (18.61 yrs) and the Earth/Solar Rotation Ratio (27:1)that affects the onset of 'Dry Cycles' on Earth. The scorning criticism By Tom Curtis of jpenhall46 is erroneous (and provable to be so.)
  11. Don Gaddes@910 Bring on the proof! Solid evidence is always preferable to empty claims.
  12. If you would like to contact John Cook, he can provide you with my complete 'proof',otherwise it is available from dongaddes93@gmail.com (-snip-)
    Response:

    [DB] Moderation complaints snipped.

  13. You are still posting so you are not banned (see post 911). If you want to discuss the science here then discuss the science. State your case and provide your evidence. Provide links to more details if it is too much for a single post. This is not rocket surgery, it is basic conversational skills. "Buy my book to learn the Truth" is not at all the same thing.
  14. Yes, I was 'banned' and reinstated, with further (-snip-) warning. No, I did not try to sell anything, I offered a free pdf of the 'proofs'. (-snip-) Anyhow, here is a small taste. If you are still interested you can pursue the rest. Earth's Period (No. 1 Constant) Divided by 4 (Obliquity, No 2 Constant) = Quarter Year Multiplied by 27 (Ratio, No. 3 Constant) = 6.75 Years (Regional Drought Cycle) Multiplied by 11.028148 Yrs (Sunspot Wave Frequency, No. 4 Constant) = 74.44 Years ( Quarterly Sub-cycle of a full 297.76 year Sunspot Cycle) Divided by 4 (Obliquity, No. 2 Constant) = 18.61 years (Metonic Cycle of the Moon's Nodes.) Multiplied by 27 (Ratio, No.3 Constant) = 502.47 Years (Full Tree-ring Cycle, 3x167.49 Year Tree-ring Sub-cycles.The 167.49 Year Sub-cycle is in turn made up of 9x18.61 Year Metonic Cycles of the Moon.) Multiplied by 11.028148 Yrs (Sunspot Wave Frequency, No. 4 Constant) = 5,541.3135 Years (Which equals 2x2,770.6567 Year Glacial Cycles, See J Bray.) Multiplied by 11.028148 Yrs (Sunspot Wave Frequency, No. 4 Constant = 412,495.34 Years (=?) Divided by 4 (Obliquity, No 2 Constant) = 103,123.83 Years (Precession of 'Perehelion and Aphelion') "According to Strahler,(Ref. No.17.) the rotation rate of the Sun differentiates at a slower rate from lower to higher latitudes. It seems to me that we ought to be investigating the latitude of the Sun which is rotating at the 27 day rate." (A S Gaddes, 1990.)
    Response:

    [DB] Inflammatory tone snipped.

    "I offered a free pdf of the 'proofs'."

    If no peer-reviewed published citable sources exist your claims devolve to "climastrology".  QED.

  15. My apologies if I misinterpreted DB's moderation comment @909, I did not ever see your original. I will use a more friendly tone from here on if you will do the same. The evidence you provide in @914 is not the least bit helpful without some context. It is just a Number Salad. Please provide an outline of your argument because at this point I have no idea what it is your numbers are supposed to show me.
  16. Don Gaddes - Well, that's a lot of numbers. But do they mean anything? The temperature of the Earth climate is determined by the amount of energy in it - which in turn is driven by the rate of energy in (sunlight, throttled mostly solar output and Earth albedo) and the rate of energy out (throttled by temperature, IR emissivity of Earth to space). You seem to be claiming that current temperature changes are driven by cyclic phenomena, not CO2 and other greenhouse gases. Unless these 'cycles' determine the rate of energy entering or leaving the Earth's climate, somehow modifying insolation (in ways that are not currently detected by TSI studies), albedo (again, in ways not currently detected), or IR emissivity to space, they are essentially "climastrology", "numerology". Tamino has discussed this exercise, and has most appropriately labeled it Mathturbation. Given sufficient data and imagination, it's possible to fit any natural phenomena to 'cycles', but unless there is a physical basis affecting energy rates you are looking at correlation without causation. How do these various cycles physically affect the energy balance of the climate - in some measurable fashion? Without that, these 'cycles' are simply a pointless intellectual exercise...
  17. the end of comment 914 indicates Don Gaddes compiled these numbers in 1990. I am curious how accurately his calculations predicted the global average temperature for the years 1990-2011.
  18. I agree - looks like more cycle-fitting. If this has any real scientific merit - publish it in peer-reviewed literature not a book.
  19. We believe in 'Gravity' though we don't know what it is. We know and can measure what it Does. A S Gaddes published the original Ratios Principle and 'Dry Cycle'forecasts numbers in 1990. There were no 'peers' to review such work at the time. The fantasy of El Nino ruled the waves. Alex Gaddes died in 1997, leaving his forecasts at 2001. Don Gaddes extrapolated the 'Dry Cycle' Forecasts from 2001 to 2055 and republished the original work including the added forecasts,in 2011. A.S. Gaddes never speculated what the 'catalyst' or 'Weather Factor'was, emanating from the Sunspot Latitude of the Sun and affecting the Earths climate as exactly predictable 'Dry Cycles'.(Recent work seems to indicate there is something to the production of ultra-violet and ozone affecting the Jet Stream.) The work does not predict Global Average Temperatures,(though A S Gaddes also worked on the concept of a 'Convection Still' in this regard.) It predicts 'Dry Cycle' onset and influence (moving around the planet longitudinally with the westward drift of the Earth's Magnetic field.)As an example, 2011 'Wet'/Normal, 2012 One Year 'Dry Cycle'(Reaching New Zealand mid-December 2011 and Australia, early January 2012) 2013-14 Two year 'Wet'/Normal period, 2015-19 a severe Five Year 'Dry Cycle'(Drought.) The previous Five year Drought was 1997-2001. These 'Dry Cycles' are immutable, and are only alleviated by explosive volcanic albedo, (in Australia's case,usually volcanic activity in the Indonesian Archipelago.) The 'Dry Cycle' forecasts are exact in their arrival and duration, and can be easily proven to be so via weather records dating back into Tree-ring and Deep Ice Core analysis. I do not indulge in 'Mathturbation' or 'Climastrology' and neither did A S Gaddes. ( -snip- )
    Response:

    [DB] "...in 1990. There were no 'peers' to review such work at the time."

    So you maintain that peer-review did not exist prior to 1991?  Or that Gaddes the Elder had no peer?

    "The fantasy of El Nino ruled the waves."

    If making a funny, using a smiley or Poe's Law kicks in.

    "Alex Gaddes died in 1997, leaving his forecasts at 2001."

    He published in 1990, yet his data you cite runs after his death...via Ouija board?

    "I do not indulge in 'Mathturbation' or 'Climastrology'"

    In all seriousness, extraordinary claims require an extraordinary burden of proof.  If you maintain what you do in the absence of physical mechanisms in the face of centuries of published research (which you seek to overturn with a non-peer-reviewed source) which says otherwise, then you do. 

    QED.

    Inflammatory snipped.

  20. This is like using epicycles to explain the motion of the planets. It is an overly complicated explanation that is required a for dogmatic rather than scientific reason. A much simpler explanation that explains *more* is avaialble if you abandon the premise that it must be cycles within cycles within cycles. If you stick with the Epicycle Theory of Climate you still need to account for the radiative characteristics of CO2, Water Vapor, CH4, etc since those are real and measurable.
  21. I'm saying there were no 'peers' working in the field of 'Dry Cycle' prediction. A S Gaddes sought and followed the advice of many scientific 'peers' at the time and many of them provided him with important papers and discussion pertaining to his work.(See his References) The data was able to be extrapolated after his death, because of the 'Ratios Principle.' It involves basic maths and is a perpetual equation. And yes, the Rotation and Gravitation of the Sun/Moon/Earth do include 'Physical Mechanisms.' The 'extraordinary burden of proof' you seek will be provided in the onset of future 'Dry Cycles' (if you do not wish to bother with the historical record.)How will the GBR react with an extended period of 'run-off' in 2013-14? Or how will Australian agriculture fare with a Five Year Drought From 2015-19? South-East Queensland will be in a severe state of water deprivation. pbjamm (917) mentioned the absence of Global Average Temperature prediction. This is relevant with the AGW hype surrounding the recent BEST Report. If the 'Dry Cycles,' are migrating longitudinally around the planet,(30 degrees/month with the westward drift of the Earth's Magnetic Field,) then the surface temperature will fluctuate as the cycles pass over the various measuring stations, (increasing while under the influence of the 'Dry Cycle' and decreasing in the subsequent 'Wet'/ Normal period. These fluctuations would be also subject to any volcanic (or other) 'albedo' effect. As these 'Cycles' last from one to five years, it does not seem relevant or possible to make generalisations about surface temperature.(see also Convection Still.)
    Response:

    [DB] "I'm saying there were no 'peers' working in the field of 'Dry Cycle' prediction. A S Gaddes sought and followed the advice of many scientific 'peers' at the time and many of them provided him with important papers and discussion pertaining to his work."

    Now you resort to "termastrology".  Uncontent with the standard definition of peer review, you redefine it to make the term more convenient to your position.  By not publishing the work in a peer-reviewed, scientifically relevant journal the work by definition is not peer-reviewed.

    This is a forum in which the science of climate change is discussed and explored.  By science meaning peer-reviewed articles published by working scientists in the field in scientifically relevant papers.  Nothing you have presented thus far meets those standards.

    Thus, the reader of this blog will be unable to differentiate between what you have presented thus far and the works of Hapgood, Velikovsky, Burroughs (my favorite is where the famed scientist Tar Zan exlores the inner world of Pellucidar) and Hubbard.  But lacking the entertainment value.

    If you wish to further explore your claims, pick the ONE mechanism you feel most strongly about (the one you wish to "hang your hat on"), use the Search function in the upper left corner to find the most relevant thread and initiate a dialogue on it there.  You waste everyone's time here with this Gish Gallop approach.

  22. 919 - Gaddes "We believe in 'Gravity' though we don't know what it is." I believe this, along with your predilection for epicycles, is clear evidence that you have been transported here from the medieval period. Since your time, there have been some advances; most notably Einstein and The Internet/google/Wikipedia... you can use the latter to learn about the former and discover that we know very well what gravity is.
  23. Actually, DB, I thought it might be the lost chapter to Foucault's Pendulum or, given the overuse of capitalization and other features, a supplement to Mason & Dixon. Don, are you saying that the 'Dry Cycles' have caused the Recent Spike in global average temps? Are you also saying that CO2 does not absorb and emit at a well-defined set of pressure-broadened frequencies within the same infrared range at which the surface also emits? Are you also claiming that the observed stratospheric cooling trend is a result (somehow - physical mechanism? I don't have to show you no stinking physical mechanisms!) of these dry cycles? I'm beginning to hear a catchy tune . . . the Music of the Spheres?
  24. I have on occasion considered running curve-fitting between global temperatures and (for example) observed cicada swarming. Should be easy - cicadas have swarm cycles from 2-17 years, with heavy emphasis on prime number values. Given a stated time period of temperature data, and treating cicada cycles as sinusoids or impulse functions with delay effects, I am certain I could find a regression weighting that would match observed temperatures. Of course, that would have exactly zero explanatory value regarding the climate - cicadas do not have a causal relationship forcing global temperatures. And my 'predictions' outside the fitting range would be completely worthless. The only way to obtain a real prediction of future climate behavior is by looking at the actual physics in operation - forcings, feedbacks, etc. Such as (again, for example) greenhouse gases, El Nino variations, observed insolation, etc. I don't know if I ran across this idea on Tamino, or elsewhere, but I rank things thusly: - Physics are better predictors than statistics - Good statistics are better predictors than bad statistics - Bad statistics are a toss-up with "Just So Stories" This is the real problem with "climastrology", such as Loehle and Scafetta's curve fitting, or (IMO) numerology such as the astrological 'cycle' fits recently commented upon. No physics connection to the climate, no mechanism, and hence correlation without causation - and no predictive value.
  25. I now present the work for 'peer review.' But that means you all have to read it!

Prev  23  24  25  26  27  28  29  30  31  32  33  34  35  36  37  38  39  40  41  42  Next

Post a Comment

Political, off-topic or ad hominem comments will be deleted. Comments Policy...

You need to be logged in to post a comment. Login via the left margin or if you're new, register here.

Link to this page


The Consensus Project Website

THE ESCALATOR

(free to republish)


© Copyright 2024 John Cook
Home | Translations | About Us | Privacy | Contact Us