Climate Science Glossary

Term Lookup

Enter a term in the search box to find its definition.

Settings

Use the controls in the far right panel to increase or decrease the number of terms automatically displayed (or to completely turn that feature off).

Term Lookup

Settings


All IPCC definitions taken from Climate Change 2007: The Physical Science Basis. Working Group I Contribution to the Fourth Assessment Report of the Intergovernmental Panel on Climate Change, Annex I, Glossary, pp. 941-954. Cambridge University Press.

Home Arguments Software Resources Comments The Consensus Project Translations About Support

Bluesky Facebook LinkedIn Mastodon MeWe

Twitter YouTube RSS Posts RSS Comments Email Subscribe


Climate's changed before
It's the sun
It's not bad
There is no consensus
It's cooling
Models are unreliable
Temp record is unreliable
Animals and plants can adapt
It hasn't warmed since 1998
Antarctica is gaining ice
View All Arguments...


Username
Password
New? Register here
Forgot your password?

Latest Posts

Archives

Sun & climate: moving in opposite directions

What the science says...

Select a level... Basic Intermediate Advanced

The sun's energy has decreased since the 1980s but the Earth keeps warming faster than before.

Climate Myth...

It's the sun

"Over the past few hundred years, there has been a steady increase in the numbers of sunspots, at the time when the Earth has been getting warmer. The data suggests solar activity is influencing the global climate causing the world to get warmer." (BBC)

At a glance

Thankfully for us, our Sun is a very average kind of star. That means it behaves stably over billions of years, steadily consuming its hydrogen fuel in the nuclear reaction that produces sunshine.

Solar stability, along with the Greenhouse Effect, combine to give our planet a habitable range of surface temperatures. In contrast, less stable stars can vary a lot in their radiation output. That lack of stability can prevent life, as we know it, from evolving on any planets that might orbit such stars.

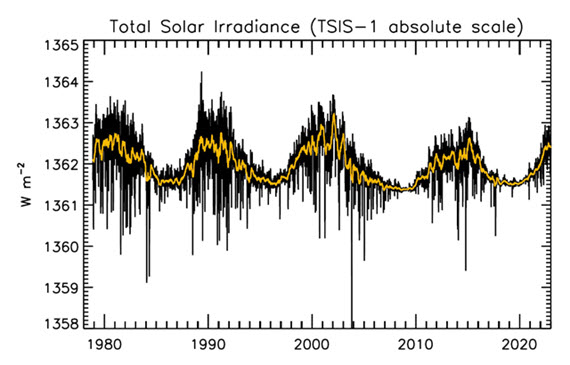
That the Sun is a stable type of star is clearly demonstrated by the amount of Solar energy reaching Earth's average orbital position: it varies very little at all. This quantity, called the Total Solar Irradiance, has been measured for around forty years with high accuracy by sensitive instruments aboard satellites. Its average value is 1,362 watts per square metre. Irradiance fluctuates by about a watt either way, depending on where we are within the 11-year long sunspot cycle. That's a variation of no more than 0.15%.

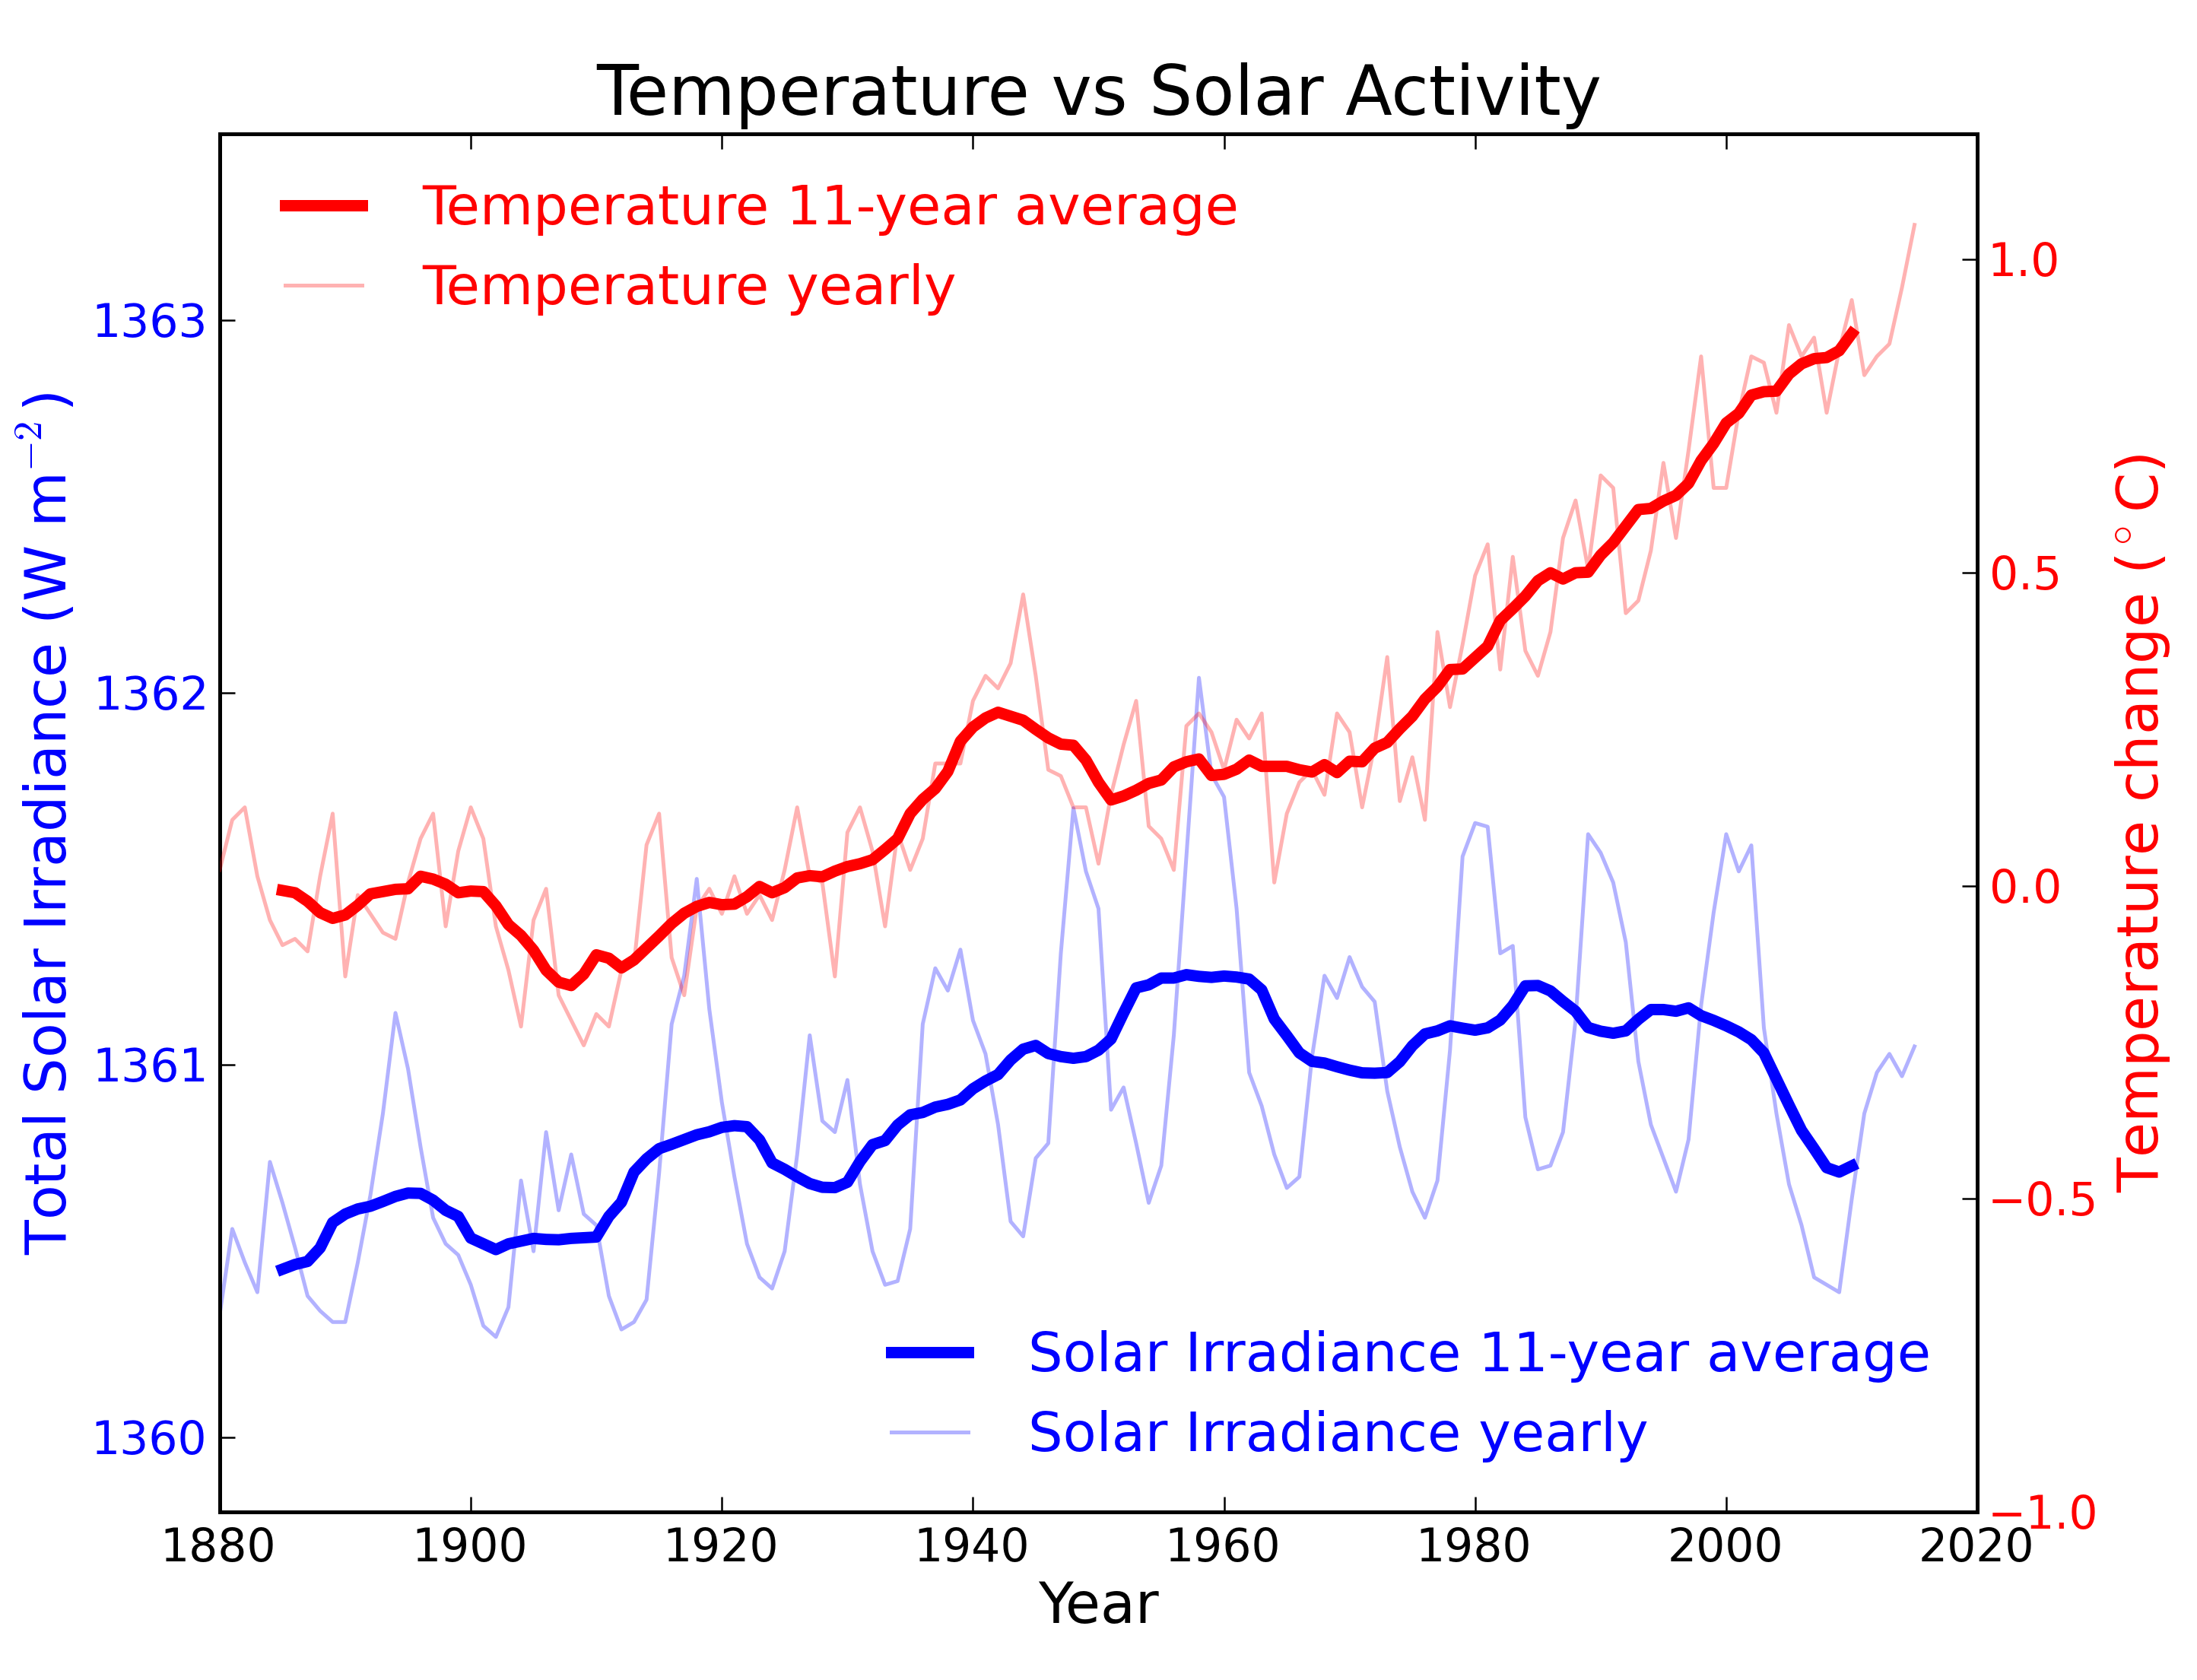
From the early 1970s until today, the Solar radiation reaching the top of Earth's atmosphere has in fact shown a very slight decline. Through that same period, global temperatures have continued to increase. The two data records, incoming Solar energy and global temperature, have diverged. That means they have gone in opposite directions. If incoming Solar energy has decreased while the Earth continues to warm up, the Sun cannot be the control-knob of that warming.

Attempts to blame the sun for the rise in global temperatures have had to involve taking the data but selecting only the time periods that support such an argument. The remaining parts of the information - showing that divergence - have had to be ditched. Proper science study requires that all the available data be considered, not just a part of it. This particular sin is known as “cherry-picking”.

Please use this form to provide feedback about this new "At a glance" section, which was updated on May 27, 2023 to improve its readability. Read a more technical version below or dig deeper via the tabs above!


Further details

Our Sun is an average-sized main sequence star that is steadily using its hydrogen fuel, situated some 150 million kilometres away from Earth. That distance was first determined (with a small error) by a time consuming and complex set of measurements in the late 1700s. It led to the first systemic considerations of Earth's climate by Joseph Fourier in the 1820s. Fourier's number-crunching led him to realise a planet of Earth's size situated that far from the Sun ought to be significantly colder than it was. He was thereby laying the foundation stone for the line of enquiry that led after a few decades to the discovery of what we now call the Greenhouse Effect – and the way that effect changes in intensity as a response to rising or falling levels of the various greenhouse gases.
TSI Solar cycles

Figure 1: Plot of the observational record (1979-2022) on the scale of the TSIS-1 instrument currently flying on the space station. In this plot, the different records are all cross calibrated to the TSIS-1 absolute scale (e.g., the TSIS1-absolute scale is 0.858 W/m^2 higher than the SORCE absolute scale) so the variability of TSI in this plot is considered to be its “true variability” (within cross calibration uncertainties). Image: Judith Lean.

The Sun has a strong magnetic field, but one that is constantly on the move, to the extent that around every 11 years or so, Solar polarity flips: north becomes south, until another 11 years has passed when it flips back again. These Solar Cycles affect what happens at the surface of the Sun, such as the sunspots caused by those magnetic fields. Each cycle starts at Solar Minimum with very few or no sunspots, then rises mid-cycle towards Solar Maximum, where sunspots are numerous, before falling back towards the end. The total radiation emitted by the Sun – total solar irradiance (TSI) is the technical term – essentially defined as the solar flux at the Earth's orbital radius, fluctuates through this 11-year cycle by up to 0.15% between maximum and minimum.

Such short term and small fluctuations in TSI do not have a strong long term influence on Earth's climate: they are not large enough and as it's a cycle, they essentially cancel one another out. Over the longer term, more sustained changes in TSI over centuries are more important. This is why such information is included, along with other natural and human-driven influences, when running climate models, to ask them, “what if?"

An examination of the past 1150 years found temperatures to have closely matched solar activity for much of that time (Usoskin et al. 2005). But also for much of that time, greenhouse gas concentrations hardly varied at all. This led the study to conclude, "...so that at least this most recent warming episode must have another source."
TSI vs. T
Figure 2: Annual global temperature change (thin light red) with 11 year moving average of temperature (thick dark red). Temperature from NASA GISS. Annual Total Solar Irradiance (thin light blue) with 11 year moving average of TSI (thick dark blue). TSI from 1880 to 1978 from Krivova et al. 2007. TSI from 1979 to 2015 from the World Radiation Center (see their PMOD index page for data updates). Plots of the most recent solar irradiance can be found at the Laboratory for Atmospheric and Space Physics LISIRD site.

The slight decline in Solar activity after 1975 was picked up through a number of independent measurements, so is definitely real. Over the last 45 years of global warming, Solar activity and global temperature have therefore been steadily diverging. In fact, an analysis of solar trends concluded that the sun has actually contributed a slight cooling influence into the mix that has driven global temperature through recent decades (Lockwood, 2008), but the massive increase in carbon-based greenhouse gases is the main forcing agent at present.

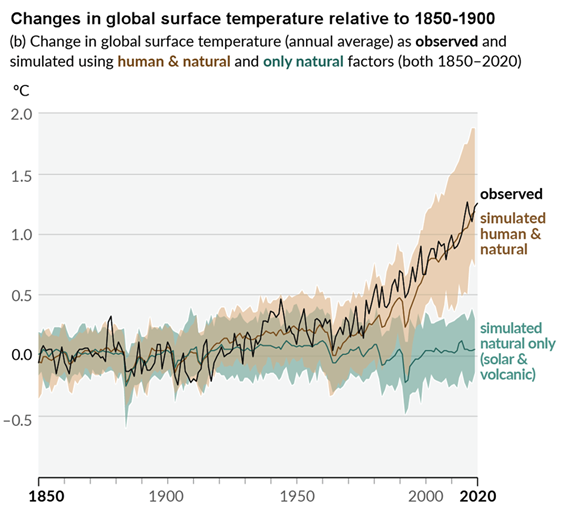
Other studies tend to agree. Foster & Rahmstorf (2011) used multiple linear regression to quantify and remove the effects of the El Niño Southern Oscillation (ENSO) and solar and volcanic activity from the surface and lower troposphere temperature data.  They found that from 1979 to 2010, solar activity had a very slight cooling effect of between -0.014 and -0.023°C per decade, depending on the data set. A more recent graphic, from the IPCC AR6, shows these trends to have continued.

AR6 WGI SPM Figure 1 Panel p

Figure 3: Figure SPM.1 (IPCC AR6 WGI SPM) - History of global temperature change and causes of recent warming panel (b). Changes in global surface temperature over the past 170 years (black line) relative to 1850–1900 and annually averaged, compared to Coupled Model Intercomparison Project Phase 6 (CMIP6) climate model simulations (see Box SPM.1) of the temperature response to both human and natural drivers (brown) and to only natural drivers (solar and volcanic activity, green). For the full image and caption please click here or on the image.

Like Foster & Rahmstorf, Lean & Rind (2008) performed a multiple linear regression on the temperature data, and found that while solar activity can account for about 11% of the global warming from 1889 to 2006, it can only account for 1.6% of the warming from 1955 to 2005, and had a slight cooling effect (-0.004°C per decade) from 1979 to 2005.

Finally, physics does not support the claim that changes in TSI drive current climate change. If that claim had any credence, we would not expect to see the current situation, in which Earth's lower atmosphere is warming strongly whereas the upper atmosphere is cooling. That is exactly the pattern predicted by physics, in our situation where we have overloaded Earth's atmosphere with greenhouse gases. If warming was solely down to the Sun, we would expect the opposite pattern. In fact, the only way to propagate this myth nowadays involves cherry-picking everything prior to 1975 and completely disregarding all the more recent data. That's simply not science.

Longer-term variations in TSI received by Earth

It's also important to mention variations in TSI driven not by Solar energy output but by variations in Earth's orbit, that are of course independent of Solar activity. Such variations, however, take place over very long periods, described by the Milankovitch orbital cycles operating over tens of thousands of years. Those cycles determine the distance between Earth and the Sun at perihelion and aphelion and in addition the tilt the planet's axis of rotation: both affect how much heat-radiation the planet receives at the top of its atmosphere through time. But such fluctuations are nothing like the rapid changes we see in the weather, such as the difference between a sunny day and a cloudy one. The long time-factor ensures that.

Another even more obscure approach used to claim, "it's the sun" was (and probably still is in some quarters) to talk about, "indirect effects". To wit, when studies can't find a sufficiently large direct effect, bring even lesser factors to the fore, such as cosmic rays. Fail.

In conclusion, the recent, post 1975 steep rise in global temperatures are not reflected in TSI changes that have in fact exerted a slight cooling influence. Milankovitch cycles that operate over vastly bigger time-scales simply don't work quickly enough to change climate drastically over a few decades. Instead, the enormous rise in greenhouse gas concentrations over the same period is the primary forcing-agent. The physics predicted what is now being observed.

Last updated on 27 May 2023 by John Mason. View Archives

Printable Version  |  Offline PDF Version  |  Link to this page

Argument Feedback

Please use this form to let us know about suggested updates to this rebuttal.

Related Arguments

Further viewing

Related video from Peter Sinclair's "Climate Denial Crock of the Week" series:

Further viewing

This video created by Andy Redwood in May 2020 is an interesting and creative interpretation of this rebuttal:

Myth Deconstruction

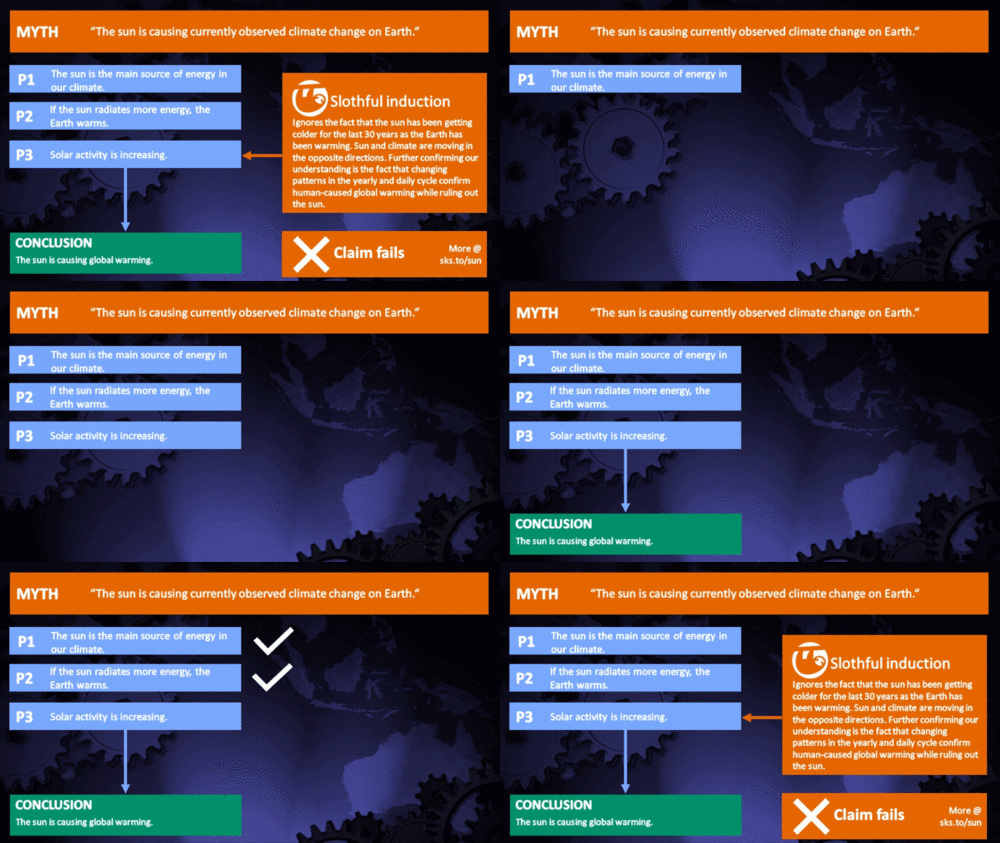
Related resource: Myth Deconstruction as animated GIF

MD Sun

Please check the related blog post for background information about this graphics resource.

Denial101x videos

Related lecture-videos from Denial101x - Making Sense of Climate Science Denial

and

Additional video from the MOOC

Expert interview with Mike Lockwood

Comments

Prev  1  2  3  4  5  6  7  8  9  10  11  12  13  14  15  16  17  18  19  20  Next

Comments 101 to 125 out of 530:

  1. sandy winder I said nothing about what climate IS. We are all pretty much aware of what it DOES. The best climatologist is a meteorologist with a PHD (presumed). They do quite well on both short term and long term predictions (it's mid-term where they run into trouble). But there is little understanding of what really drives climate and that is what I refer to. The GHG hypothesis came and went and came back again, the level of uncertainty is quite high. They only recently discovered how vulcanism drives ENSO. There are a lot of assumptions made by predictors and most are highly questionable which is why there is not a single climate model that works.
  2. You appear to be confusing prediction with science and weather with climate. The GHG 'hypothesis' is hardly that. It is like saying that the sun heats the earth is also only a hypothesis. It is true that the predictors can not be 100% sure of what the climate will be like in a 100 hundred years any more than they can tell what the weather will be like in 100 days. But they are just as likely to be guilty of underestimating the climate changes as overestimating them.
  3. ///The as yet unanswered question is: what causes these ice ages to start and stop? Until we can answer this question with high accuracy we know nothing about what climate is or how it works./// Wrong question because the perspective is wrong. History shows us that ice ages are the climatic dominant feature and that warm periods are the anomalies. The question is "What causes the warm periods"?
  4. Mizimi You are talking about glacations within an ice age and yes the interglacials are longer than the glacations but there are only 4 known ice ages and they comprise only about 10% of the earths known history. I am not looking at just the 4th ice age but all of earth history when I say that hotter is normal. sandy I do not disagree with what you say except that the GHG hypothesis can not be viewed as theory due to lack of testing. It has not made accurate predictions because of the overestimated sensitivity. In other words the earth is not very sensitive to CO2 as a GHG. If it was we would have looked like Venus during the Mesozoic. So the simple answer is that the IPCC has seriously overestimated the sensitivity to CO2 while doing the opposite for TSI.
  5. http://www.ncdc.noaa.gov/paleo/abrupt/data2.html Glacial-Interglacial cycles
  6. QM: Point taken, however if you plot proxy temps from Cambrian to present you get a downward trend in GMT from around 21C GMT to present 13.8C. Also latest thinking on Venus proposes the lack of a magnetic field has allowed water vapour to be dissociated by UV and the lighter H atoms stripped away by solar wind effects thus eventually depriving the planet of any water and therefore no oceanic component to modulate heat tranfer.....connect to the impending reversal/decline of our magnetic field??? Regarding climate sensitivity to CO2 modulation: This seems to me to be considerably overstated. Again, paleoclimate proxies indicate far higher CO2 levels than now without any thermal runaway. During the Carboniferous period CO2 levels were around 800ppm yet the GMT was apparently only 14C. Later, in the Mesozoic, CO2 jumped to circa 1800ppm and the GMT rose to around 17.5C...hardly supporting the idea of thermal runaway or tipping.
  7. A rider....I appreciate proxy data is pretty anecdotal; but regardless of the absolute conditions pertaining at those times we DO see a trend which does not support a positive,continuous feedback causing catastrophe. The carboniferous period actually teaches us a valuable lesson about how biomass substantially impacts CO2 levels: without the CO2 locked up during that period in oil/gas/coal we wouldn't be having this debate..........
  8. Pep Interesting site. They mention CO2 as a GHG released from the ocean but did not mention CH4 that was released at the same time. Now why is that? They also fail to explain why the cycles do not have the same effect because they are ignoring other cycles that happen to overlap. Read "The Solar Jerk". Mizimi I agree that the earth has cooled and that the overall trend is one of cooling (each thermal maximum is shorter and less intense) but short term (for the earth) is slowly coming out of Ice Age 4 and temperature slope for the last 5 million years is positive (there will likely be another glacation or two but it is really unpredictable).
  9. Possibly because the interest rest with CO2, ice cores, and ocean on this NOAA site so it covered the bases. National Oceanic and Atmospheric Administration, the second GHG http://www.esrl.noaa.gov/research/themes/forcing/Methane.pdf Search NOAA
  10. Pep Interesting presentation on how it's important. It shows how strong it is as a GHG. For many years now paleoclimatologists have felt that it was the feedback that produces increased warming, not CO2, and I agree with them. The CO2 article is misleading because they say it follows temps closely but do not mention the lag which various papers put anywhere from 200 -/+ 800 to 1000 +/- 300. Afterall, they are biofeedbacks not cause, and CH4 is way stronger as a GHG than CO2. I think that the manner in which they present these GHGs is misleading.
  11. Atmospheric lifetime has to be accounted for, hydroxyl oxidation of CH4.
  12. Pep See Mizimi comments for formula.
  13. I wouldn’t worry about cows but methane hydrates are a concern. As a side note: I can’t say CO2 doesn’t contribute to warming, more likely so. Absorbs infrared energy. I agree to disagree in other words.
  14. Pep We had been discussing CH4 and tropospheric clouds in a recent article on how they form with Mizimi. Unfortunately I don't remember where I put the link to the article but I don't think it was flying cows. I believe it may have been about methane hydrates but now I can't remember. :)
  15. Good one, so when do they arrive back home? I’ll watch this thread for the link, and thank you.
  16. Pep I found the original story (I still can't remember where I put the lik originally). Strange Clouds Spotted at the Edge of Space By Jeremy Hsu, Staff Writer, posted: 01 September 2008 08:50 am ET, 30 Comments A brief opening quote: “The noctilucent or “night-shining” clouds are at an altitude of 47 to 53 miles (76 to 85 km), where meteors and bright aurora lights are not uncommon and the atmosphere gives way to the blackness of space.” and from the body of the article: “Another likely source of water vapor is methane oxidation” It's an interesting read. :)
  17. Pep I actually do not disagree with AGW, it is a valid hypothesis. What or more specifically who I disagree with, are alarmists who twist the works of skeptics and totally neutral scientists either into a denial or falsely supporting AGW, and activists who seem to worship their word as gospel. Dr. Hansen is without any doubt an alarmist from his "or we are all toast" statement, rendering his judgement clouded in my view. And since he is the primary author at Real Climate, it in turn is alarmist, so I don't go there anymore. My issue with CO2 is purely one of sensitivity. I see other causes that are stronger than CO2 induced AGW simply because AGW is weaker than originally thought and the emphasis on CO2 in particular is distracting the science and preventing finding the actual problem. I don't know if it is a blind faith, cognitive disonnance, an agenda or something else. I was taught to question everything that did not seem logical and that had stood me well in an engineering environment (I am now retired) so I do not understand their irrational behavior. If you are interested in what I think is happening see the volcanos thread, which I feel is related to this thread via Dr. Rhodes Fairbridge's (non-peer reviewed) solar hypothesis.
  18. Pep For some reason the link I posted for you is dead. I probably made another typo so here is the text, just copy and paste: http://www.livescience.com/space/080901-mm-night-shining.html
  19. Great posts, we think alike. The real climate fear from actual science is swift change, which the world past shows how volatile it truly is. CO2 views as an industry and population agenda. Ultimately humans have a natural tendency to tackle problems viewed solvable, especially when the problem involves their back end. The "other climate” mentioned have been known for quite a while but CO2 was narrowed which is ludicrous. The world itself will never be narrow.
  20. /// QM:In other words the earth is not very sensitive to CO2 as a GHG. If it was we would have looked like Venus during the Mesozoic. So the simple answer is that the IPCC has seriously overestimated the sensitivity to CO2 while doing the opposite for TSI. /// No we would not have looked like Venus during the Mesozoic because Venus and the earth are different in many ways. For one thing Venus is nearer the sun. It has no magnetic field to protect the atmosphere and it has no plate tectonics or satellite. But carbon dioxide has the same properties on Venus as it does on earth. I would though like to see some evidence that the IPCC has overestimated sensitivity to CO2.
  21. sandy I suggest that you read Spencer's work on sensitivity. It is linked here somewhere, possibly in the "sensitivity" thread. The fact is that CO2 and all other GHGs are feedbacks to solar energy. Change the solar input and the feedback changes with it. So when you see an increase in temp from GHG it is caused by changes in solar output. The case for venus is a bit more complicated but as that isn't the subject I kept it on a simplified level, using it the same way that the alarmists have (they claim we will look like venus if we don't take action, so I used their absurd notion).
  22. PS I am glad that the absurdity was not lost on you.
  23. About overestimating in climate models after all we created them, there are errors and room for debate. http://www.er.doe.gov/OBER/CPDC/January_14_2008_DraftReport3_1.pdf
  24. Pep I cant open that site. Is there a typo maybe?
  25. www.er.doe.gov/OBER/CPDAC/January_14_2008_DraftReport3_1.pdf

Prev  1  2  3  4  5  6  7  8  9  10  11  12  13  14  15  16  17  18  19  20  Next

Post a Comment

Political, off-topic or ad hominem comments will be deleted. Comments Policy...

You need to be logged in to post a comment. Login via the left margin or if you're new, register here.

Link to this page


The Consensus Project Website

THE ESCALATOR

(free to republish)


© Copyright 2024 John Cook
Home | Translations | About Us | Privacy | Contact Us