Climate Science Glossary

Term Lookup

Enter a term in the search box to find its definition.

Settings

Use the controls in the far right panel to increase or decrease the number of terms automatically displayed (or to completely turn that feature off).

Term Lookup

Settings


All IPCC definitions taken from Climate Change 2007: The Physical Science Basis. Working Group I Contribution to the Fourth Assessment Report of the Intergovernmental Panel on Climate Change, Annex I, Glossary, pp. 941-954. Cambridge University Press.

Home Arguments Software Resources Comments The Consensus Project Translations About Support

Bluesky Facebook LinkedIn Mastodon MeWe

Twitter YouTube RSS Posts RSS Comments Email Subscribe


Climate's changed before
It's the sun
It's not bad
There is no consensus
It's cooling
Models are unreliable
Temp record is unreliable
Animals and plants can adapt
It hasn't warmed since 1998
Antarctica is gaining ice
View All Arguments...


Username
Password
New? Register here
Forgot your password?

Latest Posts

Archives

Sun & climate: moving in opposite directions

What the science says...

Select a level... Basic Intermediate Advanced

The sun's energy has decreased since the 1980s but the Earth keeps warming faster than before.

Climate Myth...

It's the sun

"Over the past few hundred years, there has been a steady increase in the numbers of sunspots, at the time when the Earth has been getting warmer. The data suggests solar activity is influencing the global climate causing the world to get warmer." (BBC)

At a glance

Thankfully for us, our Sun is a very average kind of star. That means it behaves stably over billions of years, steadily consuming its hydrogen fuel in the nuclear reaction that produces sunshine.

Solar stability, along with the Greenhouse Effect, combine to give our planet a habitable range of surface temperatures. In contrast, less stable stars can vary a lot in their radiation output. That lack of stability can prevent life, as we know it, from evolving on any planets that might orbit such stars.

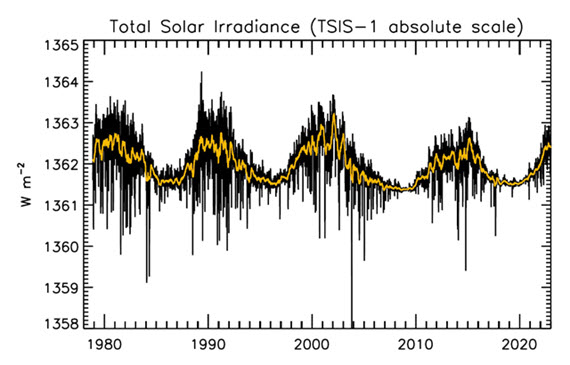
That the Sun is a stable type of star is clearly demonstrated by the amount of Solar energy reaching Earth's average orbital position: it varies very little at all. This quantity, called the Total Solar Irradiance, has been measured for around forty years with high accuracy by sensitive instruments aboard satellites. Its average value is 1,362 watts per square metre. Irradiance fluctuates by about a watt either way, depending on where we are within the 11-year long sunspot cycle. That's a variation of no more than 0.15%.

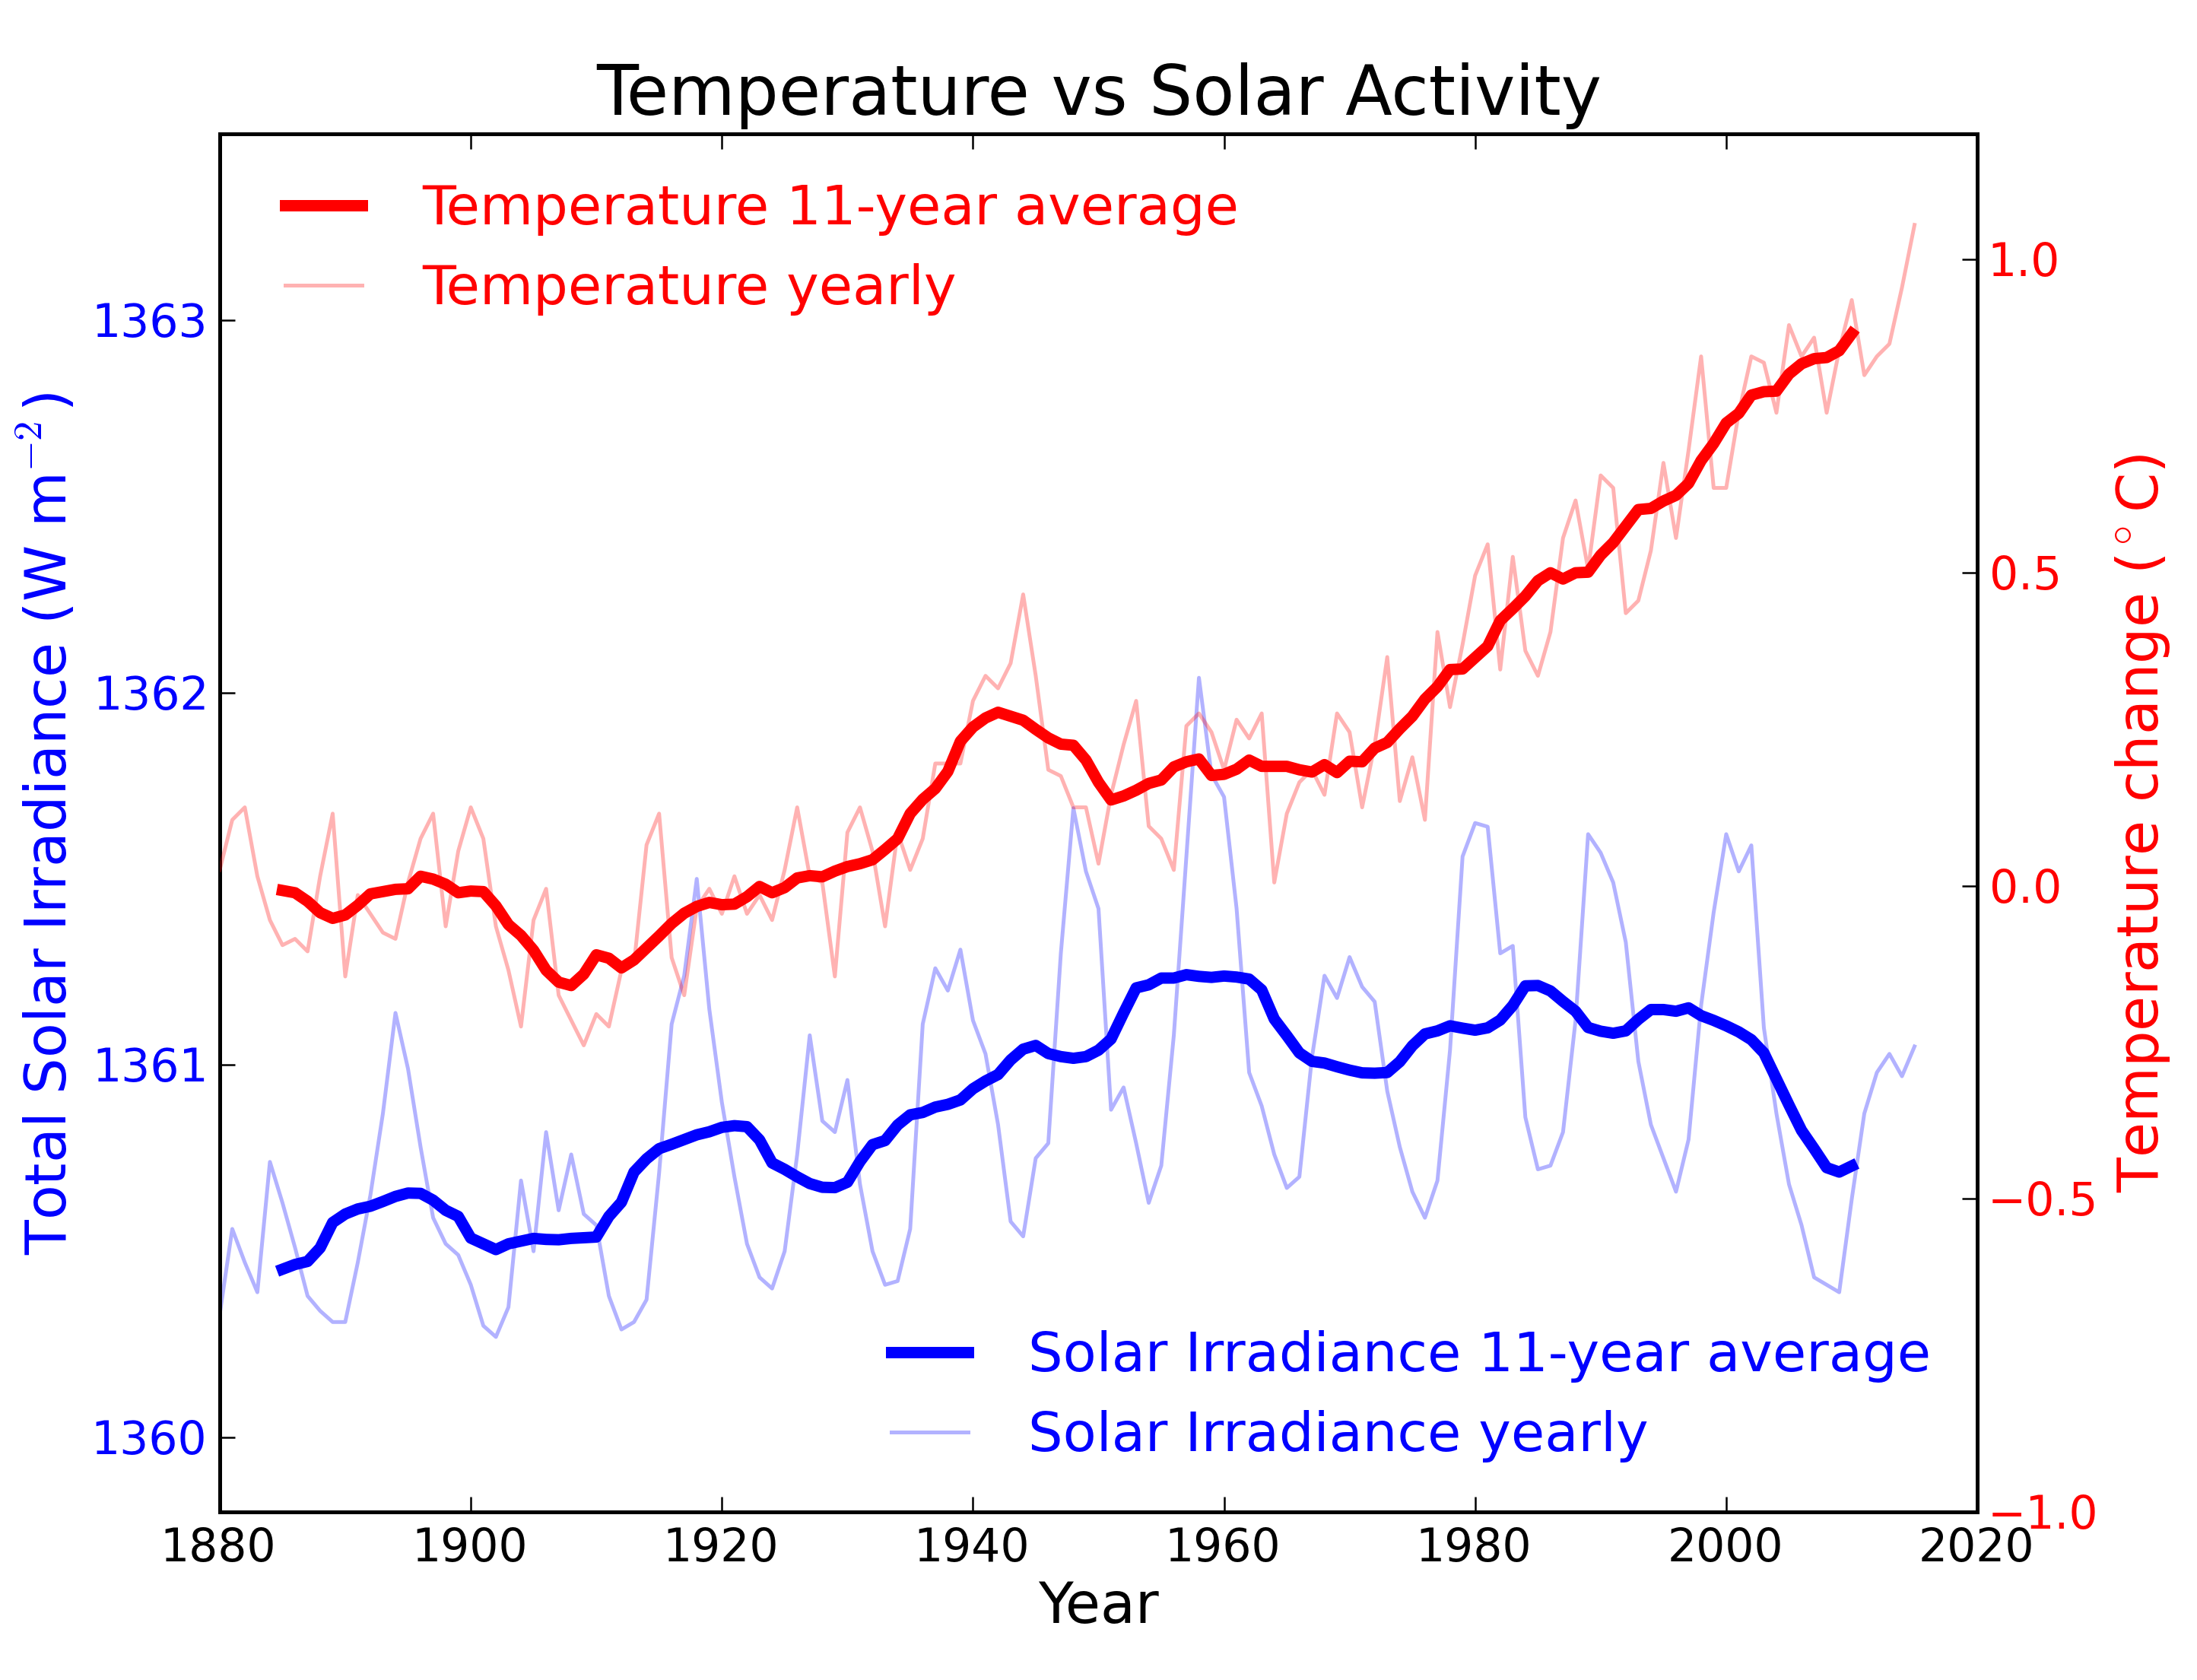
From the early 1970s until today, the Solar radiation reaching the top of Earth's atmosphere has in fact shown a very slight decline. Through that same period, global temperatures have continued to increase. The two data records, incoming Solar energy and global temperature, have diverged. That means they have gone in opposite directions. If incoming Solar energy has decreased while the Earth continues to warm up, the Sun cannot be the control-knob of that warming.

Attempts to blame the sun for the rise in global temperatures have had to involve taking the data but selecting only the time periods that support such an argument. The remaining parts of the information - showing that divergence - have had to be ditched. Proper science study requires that all the available data be considered, not just a part of it. This particular sin is known as “cherry-picking”.

Please use this form to provide feedback about this new "At a glance" section, which was updated on May 27, 2023 to improve its readability. Read a more technical version below or dig deeper via the tabs above!


Further details

Our Sun is an average-sized main sequence star that is steadily using its hydrogen fuel, situated some 150 million kilometres away from Earth. That distance was first determined (with a small error) by a time consuming and complex set of measurements in the late 1700s. It led to the first systemic considerations of Earth's climate by Joseph Fourier in the 1820s. Fourier's number-crunching led him to realise a planet of Earth's size situated that far from the Sun ought to be significantly colder than it was. He was thereby laying the foundation stone for the line of enquiry that led after a few decades to the discovery of what we now call the Greenhouse Effect – and the way that effect changes in intensity as a response to rising or falling levels of the various greenhouse gases.
TSI Solar cycles

Figure 1: Plot of the observational record (1979-2022) on the scale of the TSIS-1 instrument currently flying on the space station. In this plot, the different records are all cross calibrated to the TSIS-1 absolute scale (e.g., the TSIS1-absolute scale is 0.858 W/m^2 higher than the SORCE absolute scale) so the variability of TSI in this plot is considered to be its “true variability” (within cross calibration uncertainties). Image: Judith Lean.

The Sun has a strong magnetic field, but one that is constantly on the move, to the extent that around every 11 years or so, Solar polarity flips: north becomes south, until another 11 years has passed when it flips back again. These Solar Cycles affect what happens at the surface of the Sun, such as the sunspots caused by those magnetic fields. Each cycle starts at Solar Minimum with very few or no sunspots, then rises mid-cycle towards Solar Maximum, where sunspots are numerous, before falling back towards the end. The total radiation emitted by the Sun – total solar irradiance (TSI) is the technical term – essentially defined as the solar flux at the Earth's orbital radius, fluctuates through this 11-year cycle by up to 0.15% between maximum and minimum.

Such short term and small fluctuations in TSI do not have a strong long term influence on Earth's climate: they are not large enough and as it's a cycle, they essentially cancel one another out. Over the longer term, more sustained changes in TSI over centuries are more important. This is why such information is included, along with other natural and human-driven influences, when running climate models, to ask them, “what if?"

An examination of the past 1150 years found temperatures to have closely matched solar activity for much of that time (Usoskin et al. 2005). But also for much of that time, greenhouse gas concentrations hardly varied at all. This led the study to conclude, "...so that at least this most recent warming episode must have another source."
TSI vs. T
Figure 2: Annual global temperature change (thin light red) with 11 year moving average of temperature (thick dark red). Temperature from NASA GISS. Annual Total Solar Irradiance (thin light blue) with 11 year moving average of TSI (thick dark blue). TSI from 1880 to 1978 from Krivova et al. 2007. TSI from 1979 to 2015 from the World Radiation Center (see their PMOD index page for data updates). Plots of the most recent solar irradiance can be found at the Laboratory for Atmospheric and Space Physics LISIRD site.

The slight decline in Solar activity after 1975 was picked up through a number of independent measurements, so is definitely real. Over the last 45 years of global warming, Solar activity and global temperature have therefore been steadily diverging. In fact, an analysis of solar trends concluded that the sun has actually contributed a slight cooling influence into the mix that has driven global temperature through recent decades (Lockwood, 2008), but the massive increase in carbon-based greenhouse gases is the main forcing agent at present.

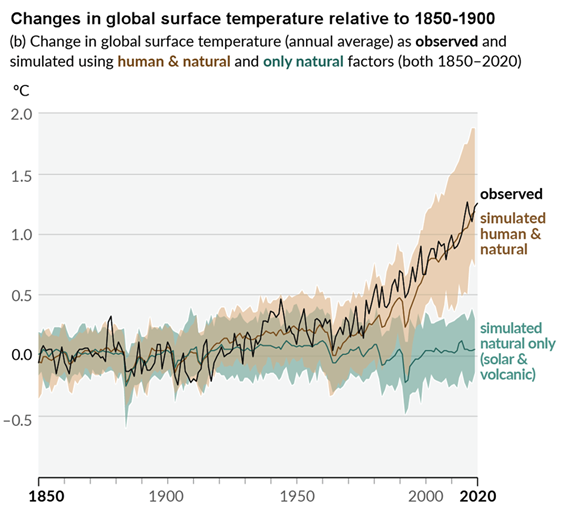
Other studies tend to agree. Foster & Rahmstorf (2011) used multiple linear regression to quantify and remove the effects of the El Niño Southern Oscillation (ENSO) and solar and volcanic activity from the surface and lower troposphere temperature data.  They found that from 1979 to 2010, solar activity had a very slight cooling effect of between -0.014 and -0.023°C per decade, depending on the data set. A more recent graphic, from the IPCC AR6, shows these trends to have continued.

AR6 WGI SPM Figure 1 Panel p

Figure 3: Figure SPM.1 (IPCC AR6 WGI SPM) - History of global temperature change and causes of recent warming panel (b). Changes in global surface temperature over the past 170 years (black line) relative to 1850–1900 and annually averaged, compared to Coupled Model Intercomparison Project Phase 6 (CMIP6) climate model simulations (see Box SPM.1) of the temperature response to both human and natural drivers (brown) and to only natural drivers (solar and volcanic activity, green). For the full image and caption please click here or on the image.

Like Foster & Rahmstorf, Lean & Rind (2008) performed a multiple linear regression on the temperature data, and found that while solar activity can account for about 11% of the global warming from 1889 to 2006, it can only account for 1.6% of the warming from 1955 to 2005, and had a slight cooling effect (-0.004°C per decade) from 1979 to 2005.

Finally, physics does not support the claim that changes in TSI drive current climate change. If that claim had any credence, we would not expect to see the current situation, in which Earth's lower atmosphere is warming strongly whereas the upper atmosphere is cooling. That is exactly the pattern predicted by physics, in our situation where we have overloaded Earth's atmosphere with greenhouse gases. If warming was solely down to the Sun, we would expect the opposite pattern. In fact, the only way to propagate this myth nowadays involves cherry-picking everything prior to 1975 and completely disregarding all the more recent data. That's simply not science.

Longer-term variations in TSI received by Earth

It's also important to mention variations in TSI driven not by Solar energy output but by variations in Earth's orbit, that are of course independent of Solar activity. Such variations, however, take place over very long periods, described by the Milankovitch orbital cycles operating over tens of thousands of years. Those cycles determine the distance between Earth and the Sun at perihelion and aphelion and in addition the tilt the planet's axis of rotation: both affect how much heat-radiation the planet receives at the top of its atmosphere through time. But such fluctuations are nothing like the rapid changes we see in the weather, such as the difference between a sunny day and a cloudy one. The long time-factor ensures that.

Another even more obscure approach used to claim, "it's the sun" was (and probably still is in some quarters) to talk about, "indirect effects". To wit, when studies can't find a sufficiently large direct effect, bring even lesser factors to the fore, such as cosmic rays. Fail.

In conclusion, the recent, post 1975 steep rise in global temperatures are not reflected in TSI changes that have in fact exerted a slight cooling influence. Milankovitch cycles that operate over vastly bigger time-scales simply don't work quickly enough to change climate drastically over a few decades. Instead, the enormous rise in greenhouse gas concentrations over the same period is the primary forcing-agent. The physics predicted what is now being observed.

Last updated on 27 May 2023 by John Mason. View Archives

Printable Version  |  Offline PDF Version  |  Link to this page

Argument Feedback

Please use this form to let us know about suggested updates to this rebuttal.

Related Arguments

Further viewing

Related video from Peter Sinclair's "Climate Denial Crock of the Week" series:

Further viewing

This video created by Andy Redwood in May 2020 is an interesting and creative interpretation of this rebuttal:

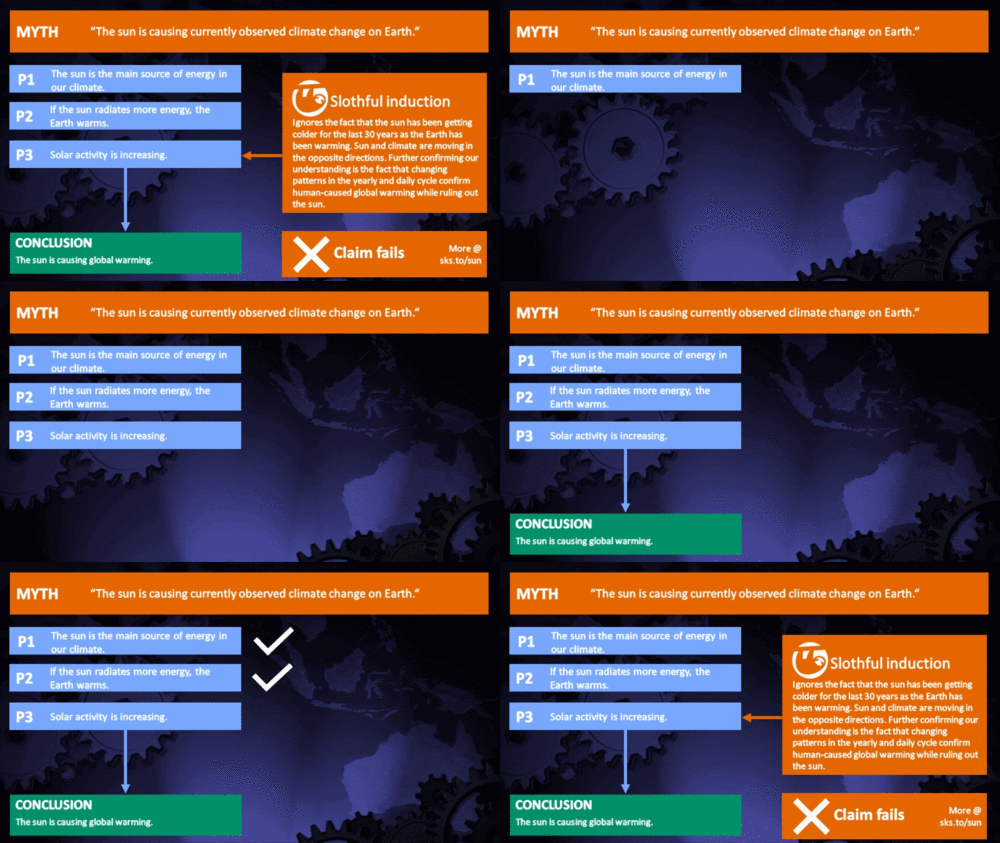
Myth Deconstruction

Related resource: Myth Deconstruction as animated GIF

MD Sun

Please check the related blog post for background information about this graphics resource.

Denial101x videos

Related lecture-videos from Denial101x - Making Sense of Climate Science Denial

and

Additional video from the MOOC

Expert interview with Mike Lockwood

Comments

Prev  1  2  3  4  5  6  7  8  9  10  11  12  13  14  15  16  17  18  19  20  Next

Comments 201 to 225 out of 627:

  1. Not really WA What errors and corrections in the GISS record? There have been some truly trivial errors. Science doesn't proceed without errors. When these are identified they are corrected..it's not really a big deal oddly in your last paragraph, you contend that the satellite record is consistent with the hypothesis that there is no positive feedback. But in fact you are quite wrong. The satellite record is consistent with surface warming as a result of enhanced greenhouse warming of the atmosphere. The predicted enhancement of troposheric water vapour has been identified (see post #173 above). How could you have come to a completely incorrect notion of the satellite record? Probably because one or two less than honest scientists (Roy Spencer is one) have repeatedly made massively profound errors during the last nearly two decades of "analysis" of this data. And although their errors have been repeatedly corrected in the scientific literature, Spencer has taken to presenting falsehoods and misrepresentations directly to the public on dodgy website and suchlike. That's what I found astonishing about your viewpoint. On this and other threads you embrace embarrasingly erroneous nonsense (The Scotese paleotemperature/paleoCO2 sketch; a German schoolteachers pathetic misrepresentation of early CO2 measurements; hearsay notions about satellite measurements)...and yet you make dull attempts to trash the pukka science. If you have evidence that "we have ice ages with high CO2 and warm eons with low CO2", why not show us? If you've evidence that "The satellite record is to an even greater extent consistent with the hypothesis that there is no positive feeedback due to increased CO2", why not show us? If you've evidence that (the satellite record) "is also consistent with the hypothesis that human activities have no measurable effect on world temperature", why not show us? We want to see your evidence Wondering Aloud. We're skeptical of individuals that embrace errant and obvious nonsense and yet attempt to downplay pukka science. We're not concerned with proof. We're interested in the science and therefore we want to see your evidence.
  2. "What errors have there been in the GISS record?" Had a look at October's Giss data? Trivail? I don't think so. Look up Wattsupwiththat latest post on Russian data included by GISS.
  3. Not really Mizimi. The GISS update for October erroneously included September data for a number of Russian stations. The error was highlighted and the data corrected. So it's not a big issue is it! There are always errors in every endeavour in life. Science isn't an exception...it doesn't proceed without errors. The important point is that errors of substance are identified (they were) and corrected (they were).
  4. Question: plants show a preference for C12 - true. But plants only have chemistry to work with ( not nuclear processes) so how do they manage that? And if they do it solely by chemistry then it follows other chemical processes can do it too.?? Oceanic plant life also prefers C12, so we should see the amount of C13 dissolved in sea water increase in respect of C12....is this the case??
  5. Not really Mizimi. The chemistry performed by living organisms is catalyzed by enzymes. Enzymes can be exquisitively sensitive to the chemical nature of their substrates, able to distinguish between stereoisomers (e.g. L- or D-amino acids) and showing rather significant preferences in relation to different isotopes of atoms such as 1H/2H; 12C/13C; 16O/18O and so on. The deposition of carbonates, for example, is thermodynamically controlled by the solubility properties of the salts which are very little affected by isotopic composition (12CO3-- cf 13CO3--). That's not to say that physical process don't result in some useful "fractionation" of molecules according to their isotopic composition. For example during cold periods, snow and rain from evaporated water tends to be very, very marginally enriched in 16OH2 since it takes a tiny bit more thermal energy to evaporate an 18OH2 molecule cf a 16OH2 one, and this can be used to determine paleotemperatures in ice cores, for example. However the fractionation of 12C over 13C by photosynthesising organisms is much larger.... We don't expect to see a measurable difference in 12C vs 13C in sea water except to the extent that the exchange of aqueous CO2 [CO2(aq) <--->H2CO3] and atmospheric CO2 results in a tendency for the oceanic CO2 to equilibrate with the continually-less-depleted 12C in the atmosphere that results from the return of long, long-sequestered 13-C-depleted carbon back into the atmosphere from burning massive amounts of fossil fuels.
  6. Keep telling yourself... "it's warming rapidly... it's not the sun..." Meanwhile back on planet Earth. http://sohowww.nascom.nasa.gov/data/realtime/mdi_igr/512/ Worst part about all of this is there should be a big lag before any noticeable cooling. In other words this winter should be warm based both on AGW and "it's the sun" theories. Anyone who thinks it is warm this winter is either very lucky or needs professional help. We need about +30C the rest of the year to get back up to average. At present we are about 55 C low on that. Please don't tell me it's warm in Europe (record snow falls) or Siberia (-60) that makes up for it. Spring was 3 weeks late of average and hard freeze was one month early. A couple more years of warming like 2007 and 2008 and you are going to see famine in the United States. Our local Ag reporter told us harvests were off 15% from predicted in the US this year because of low temperatures.
  7. WA I agree it's the sun, just not TSI. Check out the recent articles about the magnetosphere and plasma discharges. Between gravitational stresses causing increased tectonic activity, plasma discharges and changes in heat and intensity of the plasma from sunspots are looking more and more like the culprit. Too bad the IPCC never looked into this part of the science.
  8. Actually Quietman I'm not saying it is the sun, it might be, but it doesn't seem that's explaining things very well either. I think the sun is acting very weird compared to what I expected. I think uncertainty absolutely dwarfs the signal we are looking at, and every time I try to look at any indvidual piece of the puzzle it seems uncertainty grows.
  9. WA When I say it's the sun, I am generalizing. I see it as an engineering "root cause". Our orbit about the sun is a combination of the results of the sun in it's formation of the solar system. The combined gravitational effects of the system as a whole and the tectonic tides resultant. The effect of tectonics on the planets climate via changes to ocean circulation which in turn effect air circulation and control climate, added to the 8 minute charge cycle and irregularities in the solar wind and plasma forcing from sunspots. ie. a domino effect.
  10. I really want to know how at the current time these other external things especially orbital eccentricity compare to the past cycles in this current ice age. To me an amazing unanswered question is why are Greenland and Antarctica covered with ice? They certainly weren't this far into the last interglacial! Or as far as we know any of the interglacials. Why is the Earth so darn cold right now?
  11. Chris If you honestly think that the satellite record has bigger errors than the GISS I think you better take a look at www.wattsupwiththat.com There are thousands of "corrections" in the USHCN data which is best documented portion of the GISS record that are clearly incorrect. Resulting in a warming trend that is far larger than in the original data these corrctions range from undocummented to clearly incorrect. My viewpoint is astonishing to you because I started without a bias and applied the scientific method. As you frequently site papers where the authors appear unable to recopnize the concept of isolating the variable it is unsurprising that you are surprised by this method.
  12. WA Same here, I started out accepting AGW because a prominent scientist said it was real. I did not bother to look into it until Al Gore came out with his movie and an alarm went off "why is this ex-VP pushing AGW"? Now I see that is is all politics (lies) but I still don't see the motive. But I have learned a lot I did not know about climate so it was worth investigating.
  13. John Cook, you might want to include a link to cce's detailed description of the erroneous graph of sunspot rise since 1980 that is used in the Skeptic of the Week article.
  14. John Cook, you might want to include a link to cce's detailed description of the erroneous graph of sunspot rise since 1980 that is used in the Skeptic of the Week article.
  15. John Re: "Skeptic of the Week The award for most skeptic arguments in a single article over the past 7 days goes to: Lowest Sunspot Activity Since 1900 Tied to Temperature Drop Over the Past Two Years? by The Bully Pulpit (5 arguments) " That article acknowledges AGW and makes no skeptical arguments at all. Why did you pick it?
  16. I've wasted a lot of my free time over the past year trying to make myself come to a conclusion of all the AGW debate. This argument, that the TSI correlation ended in 1975 doesn't prove CO2 is the driver, or disprove it either. If you look at the ENSO variations since 1975--totally dominated by warmer El Ninio events--there could definitely be a correlation there. So trying to limit the "it's the sun" argument to only TSI is misleading, because that is only one aspect of the sun's relationship with climate. Furthermore, it may be but one forcing--the oceans another, and greenhouse gasses another, and perhaps others as well. Fact is, it doesn't seem that past climate changes are very well understood, so it's fair to be skeptical that trace gasses are the primary reason for this climate change.
  17. Okay I am in radio, and solar flair activity over the last 10 years has been horrible. Just two years ago the news was reporting unusually high solar flair activity. Numerous articles were published about the sun spot cycle being totally confusing and overly active. But the chart says that solar flair activity is down? So? Anyone want to tell me just who it blowing what kind of smoke and where? If you really want to find out about solar flair activity and its rise in the last ten or so years then go to the source. http://www.nso.edu/ This is the national solar observatory in Sun Spot New Mexico. They are the last word in the suns activity. I can make a chart and with a little credablity I can sell it to you. Does it make it ture? No it doesn't, but what it does do is negate the argument and cloude the facts.
  18. Just so you don't think I am making this up. http://www.mobilemag.com/content/100/344/C2179/ March 13, 1989 - The Quebec Blackout Storm - Astronomers were busily tracking "Active Region 5395" on the Sun when suddenly it disgorged a massive cloud of superheated gas on March 10, 1989. Three days later, and seemingly unrelated to the solar paroxicism, people around the world saw a spectacular Northern Lights display. Most newspapers that reported this event considered the spectacular aurora to be the most newsworthy aspect of the storm. Seen as far south as Florida and Cuba, the vast majority of people in the Northern Hemisphere had never seen such a spectacle in recent memory. At 2:45 AM on March 13, electrical ground currents created by the magnetic storm found their way into the power grid of the Hydro-Quebec Power Authority. Giant capacitors tried to regulate these currents but failed within a few seconds as automatic protective systems took them off-line one by one. Suddenly, the entire 9,500 megawatt output from Hydro-Quebec's La Grande Hydroelectric Complex found itself without proper regulation. Power swings tripped the supply lines from the 2000 megawatt Churchill Falls generation complex, and 18 seconds later, the entire Quebec power grid collapsed. Six million people were affected as they woke to find no electricity to see them through a cold Quebec wintry night. People were trapped in darkened office buildings and elevators, stumbling around to find their way out. Traffic lights stopped working, Engineers from the major North American power companies were worried too. Some would later conclude that this could easily have been a $6 billion catastrophe affecting most US East Coast cities. All that prevented the cascade from affecting the United States were a few dozen capacitors on the Allegheny Network. [Newspaper Archive] June 6, 1991 - Severe sun storm threatens utilities [New York Times, June 6, 1991, p. A16]. July 15, 2001 - The Bastille Day Storm - Solar flare threatens the earth with storm [New York Times, July 16, 2001 p. 21]. Minor damage reported from geomagnetic storm [New York Times, July 17, 2001 p. A17] October 29, 2003 - The Halloween Storm - This Halloween Storm spawned auroras that were seen over most of North America. Extensive satellite problems were reported, including the loss of the $450 million Midori-2 research satellite. Highly publicized in the news media. A huge solar storm has impacted the Earth, just over 19 hours after leaving the sun. This is one of the fastest solar storm in historic times, only beaten by the perfect solar storm in 1859 which spent an estimated 17 hours in transit. A few days later on November 4, 2003 one of the most powerful x-ray flares ever detected, swamped the sensors of dozens of satellites, causing satellite operations anomalies….but no aurora. Originally classified as an X28 flare, it was upgrade to X34 a month later. In all of its fury, it never became a white light flare such as the one observed by Carrington in 1859. Astronauts hid deep within the body of the International Space Station, but still reported radiation effects and ocular 'shooting stars'. http://www.foxnews.com/story/0,2933,236333,00.html The biggest solar flare in decades has put satellite operators battening down the hatches in preparation for a severe geomagnetic storm on Wednesday. The eruption is the latest event in a week of intense solar activity. The activity is highly unusual because the 11-year sunspot cycle peaked in 2000. The latest flare erupted from a large sunspot at 1154 GMT on Tuesday. It was the first in the latest bout of turbulence to launch its charged particles directly toward the Earth. "This is the strongest flare we've seen in the past 30 years," said Leon Golub, an astrophysicist at the Harvard Smithsonian Center for Astrophysics. The website spaceweather.com lists it as third highest ever recorded in X-ray flux. Late on Tuesday, the US National Oceanic and Atmospheric Administration predicted a severe geomagnetic storm would follow, with intervals of extreme intensity possible. The agency warned of possible disruptions to satellite operation, electric power systems and failures of high-frequency radio communications and satellite navigation systems. Celestial fireworks The main mass of charged particles should hit the Earth's magnetosphere about 30 hours after the flare, about 1800 GMT on Wednesday. Celestial fireworks in the form of aurora will follow as the energetic particles interact with the Earth's magnetic field. Impressive auroras are likely at latitudes much lower than normal. The fluctuations caused in the magnetic field affect electronic systems and power grids by inducing currents in conductors. The severity of the storm and its impacts on electronic equipment will depend on the orientation of the magnetic fields in the ejected particles, relative to the Earth's magnetic field. If the particles' fields oppose the Earth's, the interaction will be extremely intense. But a parallel direction will reduce the impact. Present instruments cannot measure that orientation until the particles hit. The possible effect on electric power grids is a significant concern after this year's major blackouts in the US and Italy. Geomagnetic storms can induce voltage fluctuations that destabilise vulnerable power grids. Tuesday's flare is larger than the 1989 storm that knocked out the Quebec power grid. Shut down The influx of particles can also build up potentially damaging charge levels on satellite surfaces, and disrupt operation of their navigation, orientation and sensor systems. Worried satellite operators begun shutting down instruments to protect them from overloads on Tuesday. "Geosynchronous communications satellites are likely to be affected," warned John Kohl, a solar astrophysicist at Harvard-Smithsonian, who shut down his own ultraviolet experiment on the Solar and Heliospheric Observatory (SOHO) soon after learning of the flare. Disruption of navigation and communications satellites could hamper crews fighting wildfires in southern California, where the fires have destroyed cell phone towers and smoke obstructs visual navigation. But astronauts on the International Space Station are expected to weather the storm safely, and the atmosphere will shield people on the ground from potentially harmful radiation. BUt our chart makers would have us believe that solar flair activity has actually fallen. I suppose they don't think we listen to the news or pay attention so it is easy to slip one over on us and basicly LIE! Okay they don't lie, they just bend the truth to fit thier needs.
  19. Back to the beggining please.- the article and first posts... Could someone explain, why is it so important to see a trend in the suns radiation? Isn't it enough to say that it stabely radiates more than it did a few centuries ago? You don't have to warm more and more to boil the water. It's enough to set your oven to a stable temrature.
  20. #238 Since the 1970's, there has been a calculated rise in the GMT of around 0.5C most of which is attributed to the effects of man enhancing atmospheric CO2 levels by burning fossil fuels. In order to counter this argument sceptics advance other arguments such as in this thread - namely that the sun is more active and that will cause an increase in solar radiation and thus warm the earth. So it is then necessary to see if such is the case. If there is no apparent rising trend in solar radiation this would negate the sceptics argument. However, like most complicated processes, it isn't always that easy. There are other factors which influence the amount of SR we receive, such as orbital fluctuations (Milankovitch cycles), internal processes in the sun that we 'see' as sunspot activity and the hypothesis of Rhodes Fairbridge ( the Fairbridge 'Curve') etc. Taking a single effect in isolation is an approach adopted by both sides and is counter-productive to a full understanding of the process.
  21. piszkace at 06:20 AM on 25 January, 2009 Back to the beggining please.- the article and first posts... Could someone explain, why is it so important to see a trend in the suns radiation? Isn't it enough to say that it stabely radiates more than it did a few centuries ago? You don't have to warm more and more to boil the water. It's enough to set your oven to a stable temrature.==========Answer. The graph would suggest that solar radation was stable. But if you have read the post I made which came right from the news media. Solar activity in the last ten years has risen. The reoport suggest a stable sun cycle. When all the evedence is to the contrary. The next question that would come to mine, is why would a false report be published that countered the suggested cause of global warming as solar related. I am open to all arguments but in the face of such evidence you can understand why I would become skeptical. Tom R.
  22. #239 & 240 Maybe sience never was objective, seeking answers fitting our needs. Or maybe it was, being critical to it's own theories... But even regardless the news: the graph shows that, the SR was lower before 1935, than it is now. If the Sun is responsible for the supply of 99,9% of Earth's energy (maybe less, maybe more - I don't really know) this rise, despite its now being stable (or not) for the last few decades, may be the cause. Maybe somewhere in between 1365,6 and 1366 lies the border, exeeding which, the earth can no more cool off enough? But I agree: there are much more factors to think about. So maybe I'm wrong: the rain in Fabuary, and plus 10 C, on 51 N and 17 E is just a possible fluctuation of the climate. But if I am wrong, can anyone tell me something for sure? Theory of chaos - isn't it?
  23. piszkace There are a couple of factors involved. GHG is one. The sun another and plate tectonics another. The sun provides most of the heat and the earth, via plate tectonics both provides additional heat and determines how it is distributed, ie. it controls ocean patterns and oscillations which in turn control the air circulation and weather patterns. GHGs maintain the heat but can not cause or provide any heat. This is why the term "global warming" is incorrect. We have temperature anomalies appearing in several places on the planet, most notably is the west antarctic penn. and northern Greenland. There are others but these two shine out because of the ice melt. They are both (as well as others) tectonically driven (what we term as "root cause" in engineering. (Engineers look for root cause because fixing symptoms gets you nowhere, it's a bit like taking aspirin for a flu - you stop the fever but you still are sick).
  24. There are only two significant energy sources that can directly affect the Earth's temp: 1. The Sun 2. The Earth's molten core. If these two energy sources were elliminated, the Earth would cool to near absolute zero. The Earth's atmosphere is NOT an energy source. The AGW'ers have produced an Energy Budget Diagram (which excludes the Earth's molten core, so I will as well) The Sun is the ONLY energy source in the following diagram. Here is a link to Kevin Trenberth's paper: Earth’s Annual Global Mean Energy Budget http://www.atmo.arizona.edu/students/courselinks/spring04/atmo451b/pdf/RadiationBudget.pdf Look at Fig.7 The earth’s annual global mean energy budget Do you see the amount of Solar Radiation absorbed by surface of the Earth?....it's 168 w/m^2. Do you see the amount of Back Radiation from the Atmosphere that is absorbed by surface of the Earth?....it's 324 w/m^2. Do you see the amount of Surface Radiation from the Earth?.....it's 390 w/m^2. Do you agree that the Sun is the ONLY energy source in this Energy Budget Diagram? Do you agree that the average Atmosphere temp is Colder than the average Earth's Surface temp? Does the Earth's surface radiate MORE energy than it "consumes" or receives from the Sun? Does the Back Radiation absorbed by the Earth's Surface exceed the energy it receives from the Sun? Does the Back Radiation not come from a colder atmosphere? ------------------------------ "Second Law of Thermodynamics: It is not possible for heat to flow from a colder body to a warmer body without any work having been done to accomplish this flow. Energy will not flow spontaneously from a low temperature object to a higher temperature object." http://hyperphysics.phy-astr.gsu.edu/hbase/thermo/seclaw.html#c3 ---------------------- Perpetual motion "The term perpetual motion, taken literally, refers to movement that goes on forever. However, the term more generally refers to any closed system that produces more energy than it consumes. Such a device or system would be in violation of the law of conservation of energy, which states that energy can never be created or destroyed." "Perpetual motion violates either the first law of thermodynamics, the second law of thermodynamics, or both" "A perpetual motion machine of the first kind produces energy from nothing, giving the user unlimited 'free' energy. It thus violates the law of conservation of energy." http://en.wikipedia.org/wiki/Perpetual_motion ------------------ It's pretty clear that AGW violates: 1. The 2nd Law of Thermodynamics 2. The Law of Conservation of Energy
  25. The Energy Budget Diagrams show 342 w/m^2 for the "Incoming" Solar Energy above the Earth's atmosphere. 67 w/m^2 is absorbed by the atmosphere, 77 w/m^2 is reflected by clouds and 30 w/m^2 is reflected by the surface. This leaves 168 w/m^2 absorbed by the Earth's surface. The AGW Energy Budget Diagrams state that the Solar energy actually reaching the Earth's surface is only "an average" of 168 w/m^2. However, the method they use for their calculation involves representing the spherical earth as a disk. While this calculation is mathematically correct to determine the "average" solar flux through the disk, it does not represent the actual variation in Solar flux. Most of the direct(straight on)absorbtion of Solar energy occures near the equator (even with the Earth's changing axis). The Polar regions absorb far less Solar energy because the energy is received at an angle. Near the equator the Solar flux is measured as high as 1000 w/m^2...which is vastly higher than the 168 w/m^2 average. -------------------- Basics of Solar Energy "Collection of Solar Energy Amount of captured solar energy depends critically on orientation of collector with respect to the angle of the Sun. Under optimum conditions, one can achieve fluxes as high as 1000 Watts per sq. meter" http://zebu.uoregon.edu/1998/ph162/l4.html -------------------- The Oceans have an emissivity near 1, which means that they will absorb just about all Solar energy available and heat up. Boltzmann's Law states: P = e*BC*A*T^4 Where P = net radiated power (Watts), e = emissivity, BC = Stefan's constant (5.67X10^-8), T = temperature Kelvin and A = area ..when rearranged gives P/A = e*BC*T^4 (Watts/m^2) If P/A = 1000 w/m^2 e = 1 BC = 5.67X10^-8 and solving for T we get T = 364.42 deg K or a whopping 91.42 deg C!! On average, the Ocean mean surface temp at the equator is a much lower 29 deg C. Also, the mean Ocean surface temp for the entire planet is about 18.69 deg C. It is very possible that the Sun's heating of the Oceans (which is about 70% of the Earth's surface)can account for most, if not all, of Earth's +15 deg C average temp.

Prev  1  2  3  4  5  6  7  8  9  10  11  12  13  14  15  16  17  18  19  20  Next

Post a Comment

Political, off-topic or ad hominem comments will be deleted. Comments Policy...

You need to be logged in to post a comment. Login via the left margin or if you're new, register here.

Link to this page


The Consensus Project Website

THE ESCALATOR

(free to republish)


© Copyright 2024 John Cook
Home | Translations | About Us | Privacy | Contact Us