Climate Science Glossary

Term Lookup

Enter a term in the search box to find its definition.

Settings

Use the controls in the far right panel to increase or decrease the number of terms automatically displayed (or to completely turn that feature off).

Term Lookup

Settings


All IPCC definitions taken from Climate Change 2007: The Physical Science Basis. Working Group I Contribution to the Fourth Assessment Report of the Intergovernmental Panel on Climate Change, Annex I, Glossary, pp. 941-954. Cambridge University Press.

Home Arguments Software Resources Comments The Consensus Project Translations About Support

Bluesky Facebook LinkedIn Mastodon MeWe

Twitter YouTube RSS Posts RSS Comments Email Subscribe


Climate's changed before
It's the sun
It's not bad
There is no consensus
It's cooling
Models are unreliable
Temp record is unreliable
Animals and plants can adapt
It hasn't warmed since 1998
Antarctica is gaining ice
View All Arguments...


Username
Password
New? Register here
Forgot your password?

Latest Posts

Archives

Do volcanoes emit more CO2 than humans?

What the science says...

Select a level... Basic Intermediate

Humans emit 100 times more CO2 than volcanoes.

Climate Myth...

Volcanoes emit more CO2 than humans

"Human additions of CO2 to the atmosphere must be taken into perspective.

Over the past 250 years, humans have added just one part of CO2 in 10,000 to the atmosphere. One volcanic cough can do this in a day." (Ian Plimer)

At a glance

The false claim that volcanoes emit more CO2 than humans keeps resurfacing every so often. This is despite debunkings from bodies like the United States Geological Survey (USGS). Such claims may be easy to make, but they fall apart once a little scientific scrutiny is applied. So, to settle this once and for all, let's venture out into the fascinating world of geology, plate tectonics and volcanism.

According to the USGS, there are 1,350 active volcanoes on Earth at the moment. An active volcano is one that can erupt, even if it's decades since it last did so. As of June 2023, 48 volcanoes were in continuous eruption, meaning activity occurs every few weeks. Out of those, around 20 will be erupting on any particular day. Several of those will have erupted by the time you have finished reading this.

People are familiar with a typical volcano, an elevated area with one or more craters or fissures from which lava periodically erupts. But there are also the submarine volcanoes such as those along the mid-oceanic ridges. These vast undersea mountain ranges are a key component of Earth's Plate Tectonics system. The basalts they continually erupt solidify into the oceanic crust making up the flooring of the deep oceans. Oceanic crust is constantly moving away from any mid-ocean ridge in the process known as 'sea-floor spreading'.

Oceanic crust is chemically reactive. It reacts with seawater, allowing the formation of huge quantities of minerals including those carrying carbon in the form of carbonate. But oceanic crust is geologically young. That is because it is also being consumed at subduction zones - the deep ocean 'trenches' where it is forced down into Earth's mantle.

When oceanic crust is forced down into the mantle at subduction zones, it heats up and begins to melt into magma. Carbonate minerals in that crust lose their carbon - it is literally cooked out of them. Magmas then transport the CO2 and other gases up through Earth's crust and if they reach the surface, volcanic eruptions occur and the CO2 and other gases leave the magma for the atmosphere.

So here you can see a long-term cycle in which carbon gets trapped in the sea-floor, subducted into the mantle, liberated into new magma and erupted again. It's a key part of Earth's Slow Carbon Cycle.

Volcanoes are also dangerous. That's why we have studied them for centuries. We have hundreds of years of observations of all sorts of eruptions, at Earth's surface and beneath the oceans. Those observations include millions of geochemical analyses of both lavas and gases.

Because of all of that data collected over so many years, we have a very good idea of the amount of CO2 released to the atmosphere by volcanic activity. According to the USGS, it is between 180 and 440 million tons a year.

In 2019, according to the IPCC's Sixth Assessment Report (2022), human CO2 emissions were:

44.25 thousand million tons.

That's at least a hundred times the amount emitted by volcanoes. Case dismissed.

Please use this form to provide feedback about this new "At a glance" section. Read a more technical version below or dig deeper via the tabs above!


Further details

Beneath the surface of the Earth, in the various rocks making up the crust and the mantle, is a huge quantity of carbon, far more than is present in the atmosphere or oceans. As well as fossil fuels (those still left in the ground) and limestones (made of calcium carbonate), there are many other compounds of carbon in combination with other chemical elements, making up a range of minerals. According to the respected mineralogy reference website mindat, there are 258 different valid carbonate minerals alone!

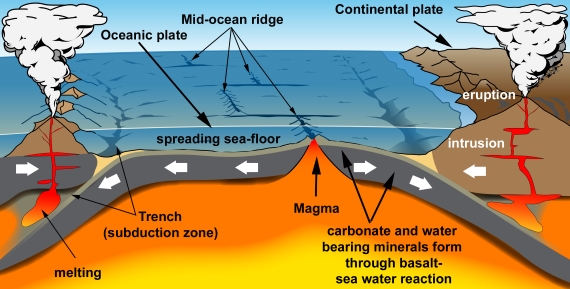
Some of this carbon is released in the form of carbon dioxide, through vents at volcanoes and hot springs. Volcanic emissions are an important part of the global Slow Carbon Cycle, involving the movement of carbon from rocks to the atmosphere and back on geological timescales. In this part of the Slow Carbon Cycle (fig. 1), carbonate minerals such as calcite form through the chemical reaction of sea water with the basalt making up oceanic crust. Almost all oceanic crust ends up getting subducted, whereupon it starts to melt deep in the heat of the mantle. Hydrous minerals lose their water which acts as a flux in the melting process. Carbonates get their carbon driven off by the heating. The result is copious amounts of volatile-rich magma.

Magma is buoyant relative to the dense rocks deep inside the Earth. It rises up into the crust and heads towards the surface. Some magma is trapped underground where it slowly cools and solidifies to form intrusions. Some magma reaches the surface to be erupted from volcanoes. Thus a significant amount of carbon is transferred from ocean water to ocean floor, then to the mantle, then to magma and finally to the atmosphere through volcanic degassing.

 Plate tectonics in cartoon form

Fig. 1: An endless cycle of carbon entrapment and release: plate tectonics in cartoon form. Graphic: jg.

Estimates of the amount of CO2 emitted by volcanic activity vary but are all in the low hundreds of millions of tons per annum. That's a fraction of human emissions (Fischer & Aiuppa 2020 and references therein; open access). There have been counter-claims that volcanoes, especially submarine volcanoes, produce vastly greater amounts of CO2 than these estimates. But they are not supported by any papers published by the scientists who study the subject. The USGS and other organisations have debunked such claims repeatedly, for example here and here. To continue to make the claims is tiresome.

The burning of fossil fuels and changes in land use results in the emission into the atmosphere of approximately 44.25 billion tonnes of carbon dioxide per year worldwide (2019 figures, taken from IPCC AR6, WG III Technical Summary 2022). Human emissions numbers are in the region of two orders of magnitude greater than estimated volcanic CO2 fluxes.

Our knowledge of volcanic CO2 discharges would have to be shown to be very mistaken before volcanic CO2 discharges could be considered anything but a bit player in the current picture. They have done nothing to contribute to the recent changes observed in the concentration of CO2 in the Earth's atmosphere. In the Slow Carbon cycle, volcanic outgassing is only part of the picture. There are also the ways in which CO2 is removed from the atmosphere and oceans. If fossil fuel burning was not happening, the Slow Carbon Cycle would be in balance. Instead we've chucked a great big wrench into its gears.

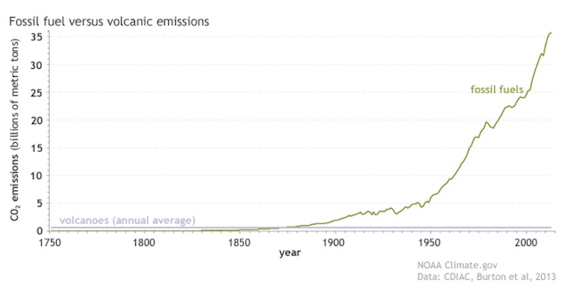
Some people like classic graphs, others prefer alternative ways of illustrating a point. Here's the graph (fig. 2):

Human emissions of CO2 from fossil fuels and cement

Fig. 2: Since the start of the Industrial Revolution, human emissions of carbon dioxide from fossil fuels and cement production (green line) have risen to more than 35 billion metric tons per year, while volcanoes (purple line) produce less than 1 billion metric tons annually. NOAA Climate.gov graph, based on data from the Carbon Dioxide Information Analysis Center (CDIAC) at the DOE's Oak Ridge National Laboratory and Burton et al. (2013).

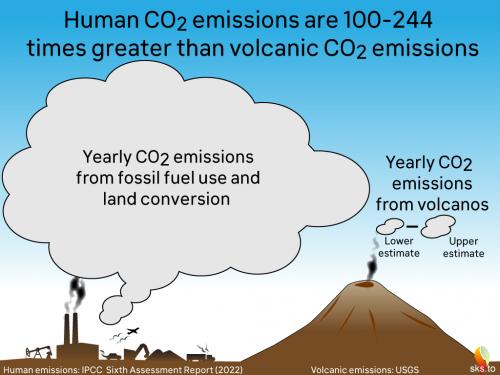
And here's a cartoon version (fig. 3):

 Human and volcanic CO2 emissions

Fig. 3: Another way of expressing the difference between current volcanic and human annual CO2 emissions (as of 2022). Graphic: jg.

Volcanoes can - and do - influence the global climate over time periods of a few years. This is occasionally achieved through the injection of sulfate aerosols into the high reaches of the atmosphere during the very large volcanic eruptions that occur sporadically each century. When such eruptions occur, such as the 1991 example of Mount Pinatubu, a short-lived cooling may be expected and did indeed happen. The aerosols are a cooling agent. So occasional volcanic climate forcing mostly has the opposite sign to global warming.

An exception to this general rule, however, was the cataclysmic January 2022 eruption of the undersea volcano Hunga Tonga–Hunga Ha'apai. The explosion, destroying most of an island, was caused by the sudden interaction of a magma chamber with a vast amount of seawater. It was detected worldwide and the eruption plume shot higher into the atmosphere than any other recorded. The chemistry of the plume was unusual in that water vapour was far more abundant than sulfate. Loading the regional stratosphere with around 150 million tons of water vapour, the eruption is considered to be a rare example of a volcano causing short-term warming, although the amount represents a small addition to the much greater warming caused by human emissions (e.g. Sellitto et al. 2022).

Over geological time, even more intense volcanism has occurred - sometimes on a vast scale compared to anything humans have ever witnessed. Such 'Large Igneous Province' eruptions have even been linked to mass-extinctions, such as that at the end of the Permian period 250 million years ago. So in the absence of humans and their fossil fuel burning, volcanic activity and its carbon emissions have certainly had a hand in driving climate fluctuations on Earth. At times such events have proved disastrous. It's just that today is not one such time. This time, it's mostly down to us.

Last updated on 10 September 2023 by John Mason. View Archives

Printable Version  |  Offline PDF Version  |  Link to this page

Argument Feedback

Please use this form to let us know about suggested updates to this rebuttal.

Related Arguments
Further reading

Tamino has posted two examinations of the "volcanoes emit more CO2 than humans" argument by looking at the impact of the 1991 Pinutabo eruption on CO2 levels and the impact of past super volcanoes on the CO2 record.

The Global Volcanism Program have a list of all "most noteworthy" volcanoes - with for example a Volcanic Explosivity Index (VEI) greater than 5 over the past 10,000 years.

Myth Deconstruction

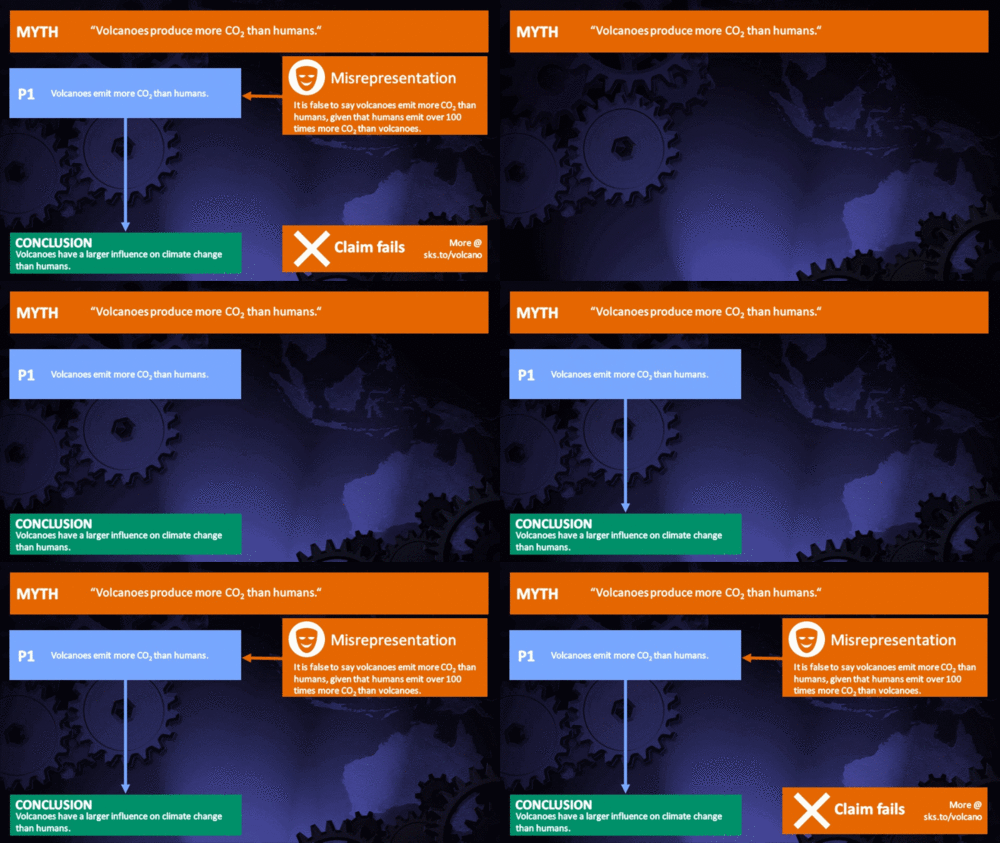
Related resource: Myth Deconstruction as animated GIF

MD Volcano

Please check the related blog post for background information about this graphics resource.

Denial101x video

Here is the relevant lecture-video from Denial101x - Making Sense of Climate Science Denial

Fact brief

Click the thumbnail for the concise fact brief version created in collaboration with Gigafact:

fact brief

Comments

Prev  1  2  3  4  5  6  7  8  9  10  11  12  Next

Comments 226 to 250 out of 283:

  1. Note "Study: Volcanoes Unleash El Niño" http://dsc.discovery.com/news/afp/20031117/elnino.html is about the symptoms, not the cause.
  2. ps Dr. S.D. Meyers and Dr. J.J. O'Brien. "Variations in Mauna Loa carbon dioxide induced by ENSO" Which I wanted to link for you has been surpressed by the new regime but is worth reading if you can find a bootleg copy.
  3. Sometimes, and for reasons not fully understood, the trade winds do not replenish, or even reverse direction to blow from west to east. When this happens, the ocean responds in a several ways. Warm surface waters from the large, warm pool east of Indonesia begin to move eastward. Moreover, the natural spring warming in the central Pacific is allowed to continue and also spread eastward through the summer and fall. Beneath the surface, the thermocline along the equator flattens as the warm waters at the surface effectively act as a 300-foot-deep cap preventing the colder, deeper waters from upwelling. As a result, the large central and eastern Pacific regions warm up (over a period of about 6 months) into an El Niño. On average, these waters warm by 3° to 5°F, but in some places the waters can peak at more than 10°F higher than normal (up from temperatures in the low 70s Fahrenheit, to the high 80s). In the east, as temperatures increase, the water expands, causing sea levels to rise anywhere from inches to as much as a foot. But in the western Pacific, sea level drops as much of the warm surface water flows eastward. During the 1982-83 El Niño, this drop in sea level exposed and destroyed upper layers of coral reefs surrounding many western Pacific islands. http://earthobservatory.nasa.gov/Features/ElNino/elnino.php Yeah, I know that you really did want to know that either.
  4. The real cause of El Ninos is still obscure. However, the recent discovery of over 1,000 previously unmapped submarine volcanos rising from the seafloor in the eastern Pacific may lead to El Nino's source. The synchronous eruption of, say, 100 of these volcanos might warm the ocean around Easter Island a tad---just enough to warm the atmosphere above a bit---resulting in a shift of the high pressure area. The area of intense volcanic activity covers 55,000 square miles of sea floor where the Pacific and Nazca plates are separating. In addition to the active volcanos, many plumes of 800°F water gush from the sea floor in this area. The volcano-El Nino link is, therefore, not so far-fetched. (Nash, Nathaniel C.; "Volcano Group in Pacific May Cause El Nino," Pittsburgh Post_Gazette, February 14, 1993. Cr. E. Fegert) Comment. If submarine volcanos do cause the El Ninos, and the El Ninos are periodic, the submarine volcanism would have to be periodic, too. This implies an unrecognized rhythm in the earth's internal fires. - http://fusionanomaly.net/elnino.html
  5. Here is a different view: As far as deep-ocean vents modifying the ocean temperatures, researchers now think that this source of heat does contribute to the long-term evolution of the ocean state. We can trace the chemical signatures of sea floor venting carried for quite a distance in the deep currents. Those traces are useful for estimating the deep flows, which are difficult and expensive to measure directly since they are so slow. However, we observe that the heating due to deep venting becomes diluted in the vast reaches of the abyssal ocean and therefore does not make quick changes in the ocean state. These affects are felt over decades or centuries, not on the relatively rapid time scale of El Niño. It is indeed tempting to look for simple causes of complex oscillations like the El Niño cycle. Unfortunately (or perhaps fortunately for those of us who like scientific challenges), it seems that the ocean-atmosphere system is well capable of generating these oscillations on its own, and the task now is to understand how this happens. Volcanoes and sea floor venting are part of the slowly changing background state to which phenomena like El Niño are added, and they increase the complexity of the task. http://www.pbs.org/wgbh/nova/elnino/resources/elninofaq.html Sorry, I still can't where the hypothesis is spelled out.
  6. I give up. When I first looked to find the cause there was one page of search results now there are hundreds.
  7. This is cut and paste from the original article that I can't locate: Although scientists understand the mechanics of El Nino, its origins have yet to be determined. The new theory [of the cause of El Nino] suggests that the primary mover behind El Nino is hot magma welling up between tectonic plates on the Pacific sea-floor. The upwelling magma heats the overlying waters enough to affect the ocean surface, initiating the cascade of events that brings on the wrath of El Nino. This, while not the same source says the same thing: Hot Vents and Global Climate Every two to seven years a climatic disturbance brings floods to California, droughts to Australia, and famine to Africa . Known as El Nino, it is essentially a warming of surface waters in the eastern Pacific near the equator. Although scientists understand the mechanics of El Nino, its origins have yet to be determined. Most believe that the interaction between the atmosphere and the sea somehow generates this climatic disturbance that wreaks havoc upon those regions of the world that lie in its path. But now a new theory on the origins of El Nino has been proposed and, surprisingly, it has very little to do with the atmosphere or the sea. The new theory suggests that the primary mover behind El Nino is hot magma welling up between tectonic plates on the Pacific sea-floor. The upwelling magma heats the overlying waters enough to affect the ocean surface, initiating the cascade of events that brings on the wrath of El Nino. http://www.platetectonics.com/book/page_20.asp
  8. Now that this has all been explained, what I need to now point out is that this is now a cause of GW, in fact has nothing to do with long range climate change (that is the Sun and little to do with the recent "AGW" issue). This is a side show, and the reason for melting of poles and some glaciers in specifically over the subduction zones IMO. This side show is also attributable to the Solar Jerk as a side effect on the Earth itself IMO. Bottom line, it's all comes back to the Sun as the driver of climate via both direct and indirect means. Ok, I think I made my point, now it's up to you to try to understand what I explained. Denial of the Sun and the results of the Solar Jerk in IMO is a silly argument so I am done. I have more paleontologist issues pressing to get back to.
  9. Regarding the leaking of heat from the Earth's interior, from volcanoes, rifts, and everything else, both above and below water, here are some sources of info: A summary is in section 17.4.1, Global heat flow, of Mussett & Khan's Looking into the Earth: An Introduction to Geological Geophysics (2000, Alan E. Mussett & M. Aftab Khan, page 279, free online partial preview). 71% of the Earth interior's heat loss is from ocean-covered surface; you can see a breakdown in section 7.4, Worldwide heat flow: total heat loss from Earth, especially Table 7.3 on page 286, of Fowler's The Solid Earth: An Introduction to Global Geophysics (2nd Edition, 2005, C.M.R. Fowler, free online partial preview). An even more detailed breakdown, even across types of undersea crust, is in Pollack, Hurter, & Johnson (1993, Heat Flow from the Earth's Interior: Analysis of the Global Data Set, Reviews of Geophysics, Vol. 31(3), pages 267-280, full text available for free). A more recent source that is just as technical as the 1993 Pollack, Hurter, and Johnson article is the 2005 book chapter by Jaupart and Mareschal, Constraints on Crustal Heat Production from Heat Flow Data (in R.L. Rudnick (Ed.), The Crust, pages 65-84, free online partial preview). A summary of how the experts calculate the heat flow from the crust that is covered by oceans are in that same Fowler book, section 7.5, Oceanic Heat Flow, starting on page 288 (free online partial preview). Details are in that same 1993 Pollack, Hurter, & Johnson article (full text available for free) and that same 2005 book chapter by Jaupart and Mareschal (free online partial preview). Those experts say that the total heat from the Earth's interior arriving at the Earth's surface (covered by land plus covered by sea) is about 0.09 watts coming out of each square meter from the Earth's interior. That's about 10,000 time less than the energy from the Sun (1,370 watts/m^2 on the sunlit side). That is such an inconsequential amount that any changes in it since 1850 cannot possibly have any significant effects on global temperature, compared to the other forcings such greenhouse gases and even solar variability. Furthermore, the observations of heat loss from the Earth's interior have not revealed any significant changes in the time frame of anthropocentric global warming. So heat emission from the Earth's interior simply is not a significant player in the era of anthropocentric global warming.
  10. Regarding my comment 236: Of course I meant "anthropogenic," not "anthropocentric." John Cook quite rightly pointed out to me that the best comparison of the total amount of heat leaking from the Earth's interior (0.09 watts/m^2) is comparison against known forcings rather than against any total. For example, it's better to compare against forcing from variations in the Sun's radiance rather than against the total of the Sun's radiance. Or against the forcing from CO2, which is 2.66 watts/m^2. Comparison to forcings show that any forcings from variations in the amount of heat from the Earth's interior will be tiny in comparison to the known forcings from variations in other factors such as CO2 or solar radiance. Suppose that the heat from the interior had doubled without us noticing (a ridiculous supposition). That would mean the heat from the interior would have increased by only 0.18 w/m^2--a tiny fraction of the current CO2 forcing of 2.66 watts/m^2.
  11. In my comment 237 I wrote the heat from the interior would have increased by only 0.18w/m^2. Wrong. The increase would be only 0.09--even smaller compared to the forcing from CO2.
  12. FYI the Icelandic volcano under the Eyjafjallajokull glacier, although still erupting has been clasified as quite low on the Volcanic Explosivity Index compared to Mt Pinatubo which rated a 6 on the 1 to 8 scale.
  13. It is useful to compare the volcano in iceland and its 150-300 ktons per day to the EU cuts. According to this article, http://europa.eu/rapid/pressReleasesAction.do?reference=IP/09/794 the EU cut about 174 ktons per day in 2008. The Icelandic volcano emits about 150-300 ktons per day, a comparable amount. Of course the volcano will stop emitting at some point, but for now it is a valid skeptical talking point to say that the volcano undoes the EU cuts.
  14. Eric (skeptic), we should be grateful that the EU has made such cuts, otherwise the increase in CO2 would be even greater now with the volcanoes added input. Just think how worse things would be if the EU hadn't made those cuts - especially if the volcano were to continuing erupting such amounts for a full year, which is unlikely.
  15. JMurphy, I posted a response earlier, but it may have been deleted or I might have screwed up. I didn't say much more than I disagree mainly because the EU cuts (and naturally the volcano) are inconsequential for climate. But that argument probably belongs on a different thread.
  16. Sorry to ask such a basic question, but the threads get too complicated for me. The rebuttal argument was very concise for this topic and I'm curious if there is any dispute. I took a quick look aound and didn't find one. Regardless of the other effects of volcanoes, or what happens to the gasses, does anyone dispute the numbers stated in the response that: 1. Volcanoes emit around 0.3 billion tonnes of CO2 per year. 2. Human CO2 emissions are around 29 billion tonnes per year. ? Thanks
  17. JSFarmer, apart of Ian Plimer, (professor of mining geology and director of a few mining companies in Australia) and Mark Durkin (director of the infamous "The Great Global Warming Swindle") I don't think you can find many others disagreeing with your question #1. As for question #2, i've never heard criticism on the numbers.
  18. OK.... Thanks...
  19. Do Volcanoes produce more CO² each year than man? Clearly no normally, but that is not to say they cannot. However we must not forget that Volcanoes emit more than just CO². Whilst I do not agree with AGW, I personally think that under normal circumstances Volcanoes are a Red herring. If you take into account the dust and other contaminants they inject into the air, then I would hazard a guess (and this is born out by human experience and scientific data), that Volcanoes have more of a cooling effect than a warming one. As with most things in science, it is not impossible for our rudimentary understanding of tectonic processes to proves us wrong with the odd eruption, but as a rule, we would need some very serious eruptive events to account for 30 Billion Tonnes of CO², assuming this figure too is correct.
  20. New article adds the contribution from volcanic lakes Including this contribution, total volcanic CO2 emissions could be as high as 420Mt/y, or closer to 2% of human emissions if we use the 23Gt figure from the Skeptic's guide. Still negligable, but worth noting.
  21. A recent update from AGU: http://www.agu.org/news/press/pr_archives/2011/2011-22.shtml
  22. The link to "Morner 2002" is broken. Can I get a good one? Sadly, I need it.
  23. It occurs to me,


    Why not have a "Counter" set at

    human greenhouse gas emissions are equaling x volcanes erupting,

    (say... X Mt. Pinnatubos = current human emissions?)

  24. Your Moerner and Etiope and Kerrick links are dead.

    Response:

    [DB] Mörner and Etiope is here.  Kerrick is here.  A nice chapter on geologic methane by Etiope is here.

  25. There is a more recent paper on the topic:

    Burton, Michael R., Georgina M. Sawyer, and Domenico Granieri. "Deep carbon emissions from volcanoes." Rev Mineral Geochem 75 (2013): 323-354.

    This estimates that the total volcanic emission is 637 million tonnes per year.

    Most existing volcanoes have not been measured, so all estimates have large uncertainties.

    Response:

    [PS] Added link to paper

Prev  1  2  3  4  5  6  7  8  9  10  11  12  Next

Post a Comment

Political, off-topic or ad hominem comments will be deleted. Comments Policy...

You need to be logged in to post a comment. Login via the left margin or if you're new, register here.

Link to this page


The Consensus Project Website

THE ESCALATOR

(free to republish)


© Copyright 2024 John Cook
Home | Translations | About Us | Privacy | Contact Us