Climate Science Glossary

Term Lookup

Enter a term in the search box to find its definition.

Settings

Use the controls in the far right panel to increase or decrease the number of terms automatically displayed (or to completely turn that feature off).

Term Lookup

Settings


All IPCC definitions taken from Climate Change 2007: The Physical Science Basis. Working Group I Contribution to the Fourth Assessment Report of the Intergovernmental Panel on Climate Change, Annex I, Glossary, pp. 941-954. Cambridge University Press.

Home Arguments Software Resources Comments The Consensus Project Translations About Support

Bluesky Facebook LinkedIn Mastodon MeWe

Twitter YouTube RSS Posts RSS Comments Email Subscribe


Climate's changed before
It's the sun
It's not bad
There is no consensus
It's cooling
Models are unreliable
Temp record is unreliable
Animals and plants can adapt
It hasn't warmed since 1998
Antarctica is gaining ice
View All Arguments...


Username
Password
New? Register here
Forgot your password?

Latest Posts

Archives

What evidence is there for the hockey stick?

What the science says...

Select a level... Basic Intermediate

Recent studies agree that recent global temperatures are unprecedented in the last 1000 years.

Climate Myth...

Hockey stick is broken

“In 2003 Professor McKitrick teamed with a Canadian engineer, Steve McIntyre, in attempting to replicate the chart and finally debunked it as statistical nonsense.  They revealed how the chart was derived from "collation errors, unjustified truncation or extrapolation of source data, obsolete data, incorrect principal component calculations, geographical mislocations and other serious defects" -- substantially affecting the temperature index.” (John McLaughlin)

At a glance

The Hockey Stick is a historic graph dating back to a paper published in 1999. It showed Northern Hemisphere temperature variations over the near-thousand year period from 1000-1998. The 'blade' of the stick represented the rapid warming of the late 20th Century. It has an iconic status, both in climate science and in the murky world of science-misinformation, where, naturally, it is despised by all and sundry.

Objections to the Hockey Stick are varied but mostly focussed on the stick's long handle and the data that represents. Obviously, during the centuries going back to 1000, reliable temperature measurements are not available. Fortunately for science, there are things that lived through that long time, such as certain very old trees. They record in the rings of their wood an indication of temperatures, year on year. Gardeners and farmers talk about good and bad growing years and it’s the same for natural systems. For example, cold dry periods make for narrow and densely-packed tree-rings whereas warmer, wetter times lead to more widely-spaced ones.

Importantly, today there are a great many effective past climate indicators, known as proxies because they act in place of thermometers. Because there's a range of indicators, the results from each one can be cross-checked against one another. If a new proxy is any good, its data should agree with that from the other, established ones.

Proxy datasets contain more uncertainty than directly measured temperatures. Everyone knows that. That does not mean they are useless, far from it. Cross-checking means poor data can readily be identified and investigated.

Finally, it's 24 years since the Hockey Stick graph was published. Since then, work on developing and refining the best proxies has been relentless. Better, longer temperature reconstructions have become possible. At the same time, global temperatures have continued to rise. In any of the observation-based records of surface temperature, all of the eight warmest years have been since 2015.

Please use this form to provide feedback about this new "At a glance" section, which was updated on May 27, 2023 to improve its readability. Read a more technical version below or dig deeper via the tabs above!


Further details

Reliable observational temperature records only go back so far in time – in the UK back to 1850 and in the USA to 1880, for example. So how do we find out about conditions going further back, hundreds, thousands or even millions of years into the past? We use proxies.

Proxies are things whose measurable properties are affected in certain, well-defined and understood ways by variations in temperature and other climatic parameters. Although the most well-known proxy work was undertaken by studying the rings of ancient trees, many other things have since shown usefulness in this field. They include data from ice-cores, marine and lake sediments and the fossils they contain, corals, mountain glaciers: as time goes by more and more things have shown themselves to be useful over a variety of time-spans. Armed with such tools, the paleoclimatologist can thereby reconstruct climatic conditions in ancient times, just as the paleontologist can reconstruct ancient ecosystems, from data preserved in the rocks.

By 1999, confidence in paleoclimate proxy data was sufficient to link these ancient records to modern observations and this was done in a famous paper by Michael Mann and colleagues (Mann et al. 1999), showing that global temperature gradually cooled over the last 1000 years, but then rose sharply, beginning in the 20th Century. The shape of the graph (Figure 1) therefore looked like a hockey stick lying flat on the ground with its blade pointing upwards.
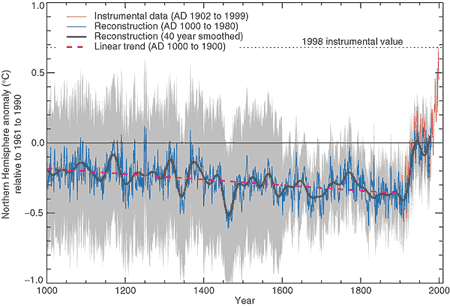

Figure 1: Northern Hemisphere temperature changes estimated from various proxy records shown in blue (Mann et al. 1999). Instrumental data shown in red. Note the large uncertainty (grey area) as you go further back in time.

Controversy, mostly of a manufactured nature, raged over the hockey-stick graph in the years following its publication: it became a symbolic focal point in the online 'climate-wars' that characterised the first two decades of the 21st Century, a time of often bitter battles and recriminations as misinformers attacked climate scientists in any way they could think of.

In the meantime, the expansion of things that were found to work as effective proxies continued apace, so that by the late 2010s we had learned a lot more about paleoclimate going right back through the glaciations and interglacials of the Quaternary and into the warmer late Cenozoic era. The paleoclimate record today stretches a long way back, through tens of millions of years.

Back to shorter time-spans though, and another visually-catching graphic was recently created by climate scientist Ed Hawkins, using blues for colder years, reds for warmer ones and whites for near-average times. Known as “Warming Stripes'', the initial 2018 graph represented temperatures over the past 200 years, but a more recent version (Figure 2) uses a wide range of reliable proxy data from an international collaboration of scientists, called Past Global Changes 2K (PAGES2K), because it covers the past 2,000 years.
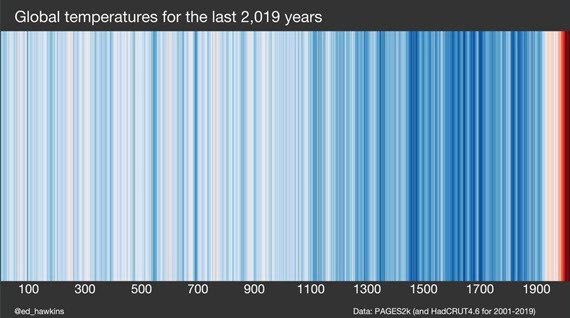
Warming Stripes past 2000 years

Figure 2: Warming Stripes based on PAGES2k (and HadCRUT4.6 for 2001-2019). Source: Ed Hawkins' Climate Lab Book

Warming Stripes is a visually striking graphic due in large part to its simplicity. It's like the Hockey Stick but with 20 years more scientific progress included. But like the Hockey Stick, it confirms the original findings: that the rate of recent warming is very steep in contrast to anything in the past two millennia.

Of course, as one would entirely expect, some crude attempts have been made to doctor Warming Stripes, but they never stand up to the level of scrutiny that scientists apply to their datasets. A graphic circulated in 2019 is one such example. For some unknown reason, its author left off the period 2007-2019, despite the temperature data being readily available. Could it have been because the warmest years on record occurred during this period? You tell us.

Furthermore, an in-depth examination of the graphic in question in a CBS News article shows that in fact it had been put together by crude copying and pasting in Photoshop or a similar application, so badly in fact that the edges of the pasted sections are clearly visible standing out from the top of the graphic. Like all climate misinformation, it just doesn't stand up to scrutiny.

Last updated on 27 May 2023 by John Mason. View Archives

Printable Version  |  Offline PDF Version  |  Link to this page

Argument Feedback

Please use this form to let us know about suggested updates to this rebuttal.

Further reading

The National Academy of Science's summation of the various temperature proxies are available online at Surface Temperature Reconstructions for the Last 2,000 Years.

Tamino has an interesting blog post Not Alike where he compares the Moberg temperature reconstruction (one of the least hockey stick like reconstructions with a distinct Medieval Warm Period and Little Ice Age) to modern temperature trends. He finds modern temperatures are 0.53 deg.C hotter than medieval times and the modern warming rate is 64% greater than the fastest rate in medieval times.

The NOAA Paleoclimatology Reconstructions Network has made available paleo data for download including 92 high-resolution temperature records over the past 2+ millennia.

Denial101x video

Here is a related lecture-video from Denial101x - Making Sense of Climate Science Denial

Additional video from the MOOC

Interviews with  various experts

Comments

Prev  1  2  3  4  5  Next

Comments 76 to 100 out of 101:

  1. @dana: In August 1997, Huang, Pollack, and Shen. Geophysical Research Letters. Using the borehole data, they reconstructed the temperature in the last 20,000 years. Their results are three curves based on different degrees of variation. Shown are a warm holocene climate optimum, a warm and pleasant period around 8,000 years ago that lasted for about 3 millenia, a cool period 2000 years ago followed by the medieval warm period 800 years ago which was also warmer than the present. http://www-personal.umich.edu/~shaopeng/97GL01846.pdf I will respond at length on physics elsewhere, so that perhaps I won't be deleted by the monitor of this blog.
    Response:

    [DB] Comments that are on-topic and formulated to comply with the Comments Policy receive no moderation.  This, as always, applies to all participants here.

  2. Sorry, I did NOT say Ran, L., Jiang, H., Knudsen, K.L. and Eiriksson was global. No cherry picking by me. Knee jerk reactions by some of you though.
  3. Bud - the study you reference excluded data from the 20th century, aside from other problems. See the Notes section here.
    Response:

    [DB] Dana, I'm not sure the Notes sections are viewable to the public.  If that is the case, the gist is this:

    Summary and Conclusions [25]

    The 20,000 year reconstructions presented in HPS97 utilized observations contained in a database of terrestrial heat flux measurements.

    Data from the depth range 0– 100 meters, the depth range where most of the information about 20th century climate change resides, were excluded from the reconstruction because of noise considerations.

    Thus the reconstructions derived from that dataset cannot be used to compare the Medieval Warm Period to changes taking place in the 20th century.

  4. Bud #79 - and I quote:
    "Once again we have a science paper indicating warmth of the more distant past clearly exceeded that of the recent past....I did NOT say Ran, L., Jiang, H., Knudsen, K.L. and Eiriksson was global."
    Stop playing games. If you want to argue that the the North Icelandic Shelf was hotter during the MWP than now, then say so. Don't pretend we're misrepresenting you when you talk about "warmth" in a hockey stick (northern hemisphere) temperature discussion.
  5. Bud @77, Huang et. al. have an updated paper here, published in 2008. From the abstract (emphasis mine): "We present a suite of new 20,000 year reconstructions ... all referenced to the 1961–1990 mean of the instrumental record. ... The reconstructions show the temperatures of ... the maximum of the MWP at or slightly below the reference level ... and end-of-20th century temperatures about 0.5 K above the reference level. Note that they found that end-of-20th century temperatures were warmer than the MWP, and keep in mind that the 21st century is known to be warmer still. Also note the discussion of their previous paper: "Below we describe their respective datasets, and show why the results of HPS97 cannot be used for comparing MWP warmth to the 20th century." So Bud, you readily cited the work of these particular scientists when you felt their conclusions agreed with yours. Are you going to stick with them now that their conclusions differ? Are you actually willing to change your point of view given new evidence, or are you just going to cherry pick the versions that you agree with?
  6. Dana. I pretend nothing. These scientists find that Iceland was warmer. "Once again" meant that they are by no means the only scientists to publish of warmer periods. Since you claimed "There are no millenial reconstructions which show the MWP hotter than present" I gave you a reference to the August 1997, Huang, Pollack, and Shen paper in Geophysical Research Letters. Here's another reconstruction. There's a nice graph on this page: http://www.scotese.com/climate.htm Bibliography here: http://www.scotese.com/scotesepubs.htm
    Response:

    [DB] Please see e's pre-emptive reply to you at 80 above.

  7. Bud >These scientists find that Iceland was warmer. So what? The topic of discussion is global warming. Do you have up to date evidence that the globe was warmer that the present (meaning 2000-2010 not the 90's)? More importantly, why would that even be relevant to your argument? The key question is the physics that underly the warming and what that means for future temperature trends.
  8. Dana. This 2002 paper using data from China confirms period AD 200 that is "The peak at about AD 200 represents the warmest stage of the last two millennia, temperature was even higher than during the 20th century." "General characteristics of temperature variation in China during the last two millennia," GEOPHYSICAL RESEARCH LETTERS, VOL. 29, NO. 9, 1324, 10.1029/2001GL014485, 2002 Bao Yang Institute of Cold and Arid Regions Environmental and Engineering, Chinese Academy of Sciences, China Achim Braeuning Institute for Geography, University of Stuttgart, Stuttgart, Germany Kathleen R. Johnson Department of Earth and Planetary Science, University of California, Berkeley, CA, USA Shi Yafeng Institute of Geography and Limnology, Chinese Academy of Sciences, 210008, Nanjing, China http://www.ess.uci.edu/~johnsonlab/files/Download/Yang%20et%20al.,%202002.pdf
    Response:

    [DB] Please slow down the linear posting of studies until you have properly discussed the ones you have already posted.  For example, e countered your Huang et al 1997 with Huang et al 2008 which effectively overcomes your position altogether.

  9. Bud, This is getting ridiculous. You were asked about global warming, so now you produce a paper about warming in China? What's more, the timeframe referenced for the warm period in that paper is substantially different from the time period in your first paper. The Icelandic warming is timed around 1000 A.D., while the Chinese warming is around 200 A.D. These are different warming events localized to different regions Bud. Please show us some truly global evidence and stop spamming this thread with irrelevant and outdated papers.
  10. To piggyback on the prevailing sentiment, regionalized warming/cooling is that: regional. For your examples given, the warming experienced regionally during the MWP was just that: regional periods of warming interspersed with bouts of regional cooling. So for every "dog" study showing a certain region was "warm at a certain time period therein, another "pony" study showing cooling during the period can be rolled out. As an example, Martín-Chivelet et al 2011, showed that the 20th century was the time with highest surface temperatures in Northern Spain in the last 4000 years (more robust discussion here), which includes the MWP. Whoopee. But where the warming/cooling of the past differs from the warming experienced in the last century & this is two-fold: 1. This warming is truly global 2. It is driven largely (especially since 1975 or so) by us with our GHG emissions. Please take the time to read the literally hundreds of posts at this site going over this in exquisite detail. Whichever sources of information you've been learning from so far have done you a disservice.
  11. All, Bud seems to be cherry-picking papers from the NIPCC's "Prudent Path" misinformation document. If so, he can keep at this for some time.... Also, in the face of evidence to the contrary of his beliefs the "skeptics" just keeps forging ahead, mostly ignoring the inconvenient evidence. At this point one has to wonder whether the person is a "skeptics" or someone in denial about AGW. There are more Hockey Sticks out there than can be used by a NHL team, some generated using independent data not used in the original HS graph. e @85, good catch!
    Response:

    [dana1981] I suggest we follow Daniel's sage advice.  DNFTT.  Until Bud can address the fact that the lone hemispheric reconstruction he has referenced is flawed and outdated, there's little point in feeding him further.

  12. Hey I'm new to this fourm but Steven McIntyre has got a rebuttal to his rebuttal and a rebuttal to any new hockey sticks. here is a reconstruction showing Briffa's exclusion of data and what it really is supposed to be. From the Keigwin 1996 study. I will debate the Heat Island Effect on the specific section which I challege the graphs provided here.
    Response:

    [DB] A better thread for the tree ring discussion is probably Climategate: Hiding the Decline?

    As you are new to this forum, you may want to read it before proceeding further.  Respondees to this, please take it up there.

    The hockey stick challenge Roh234 issues is fair game here.

    Take heat island comments to the It's Urban Heat Island effect thread.  Please read both the Basic and Intermediate tabs to prepare yourself.

    For the record, please in the future also indicate the paternity of your sources for furnished graphics.  Ex:

    Graphic 1 above:  http://joannenova.com.au/globalwarming/hockey-stick/rcs_chronologies1v2.gif

    Graphic 2 above:  http://wattsupwiththat.files.wordpress.com/2009/09/rcs_chronologies_rev2.gif?w=420&h=360

    Graphic 3 above:  http://www.friendsofscience.org/assets/documents/FOS%20Essay/seasurface.GIF

    Graphic 4 above:  http://www.friendsofscience.org/assets/documents/FOS%20Essay/Mann%201998%20+%20Corrected.gif

    Congratulations, no peer-reviewed primary sources used.

  13. Roh234 - the world has moved on from 1998, but Mc Intyre hasn't. The rebuttal to future hockey sticks remark is amusing, but in all seriousness the evidence is overwhelming that present temperatures surpass that of the Medieval Warm(ish) Period. For starters: 1. Glaciers were advancing in North America during the MWP. See SkS post: Icing the Medieval Warm Period 2. The North American cordillera snowpack was much heavier during the MWP - indicating that it was colder back then. See: The Unusual Nature of Recent Snowpack Declines in the North American Cordillera - Pederson (2011) 3. Atmospheric circulation patterns match the paleoclimate proxies - See SkS post: The Medieval Warm(ish) Period in Pictures 4. Paleoclimate reconstruction below:
  14. It would also by nice if you provided a link back to your sources. You are aware of various non-tree ring proxy reconstructions as well?
  15. Roh234, as others have pointed out, the 'hockey stick' has been confirmed by numerous subsequent studies by different groups of scientists, and even 'skeptics', all over the world using several different data sources. Alot of this is also detailed in the article above. On McIntyre's specific claim about 34 tree ring data sets... have you heard of the divergence problem? Basically, over the past century many trees have shown very low growth even as the temperature has increased. This is believed to be due to environmental toxins and other factors. However, what it means is that the rings on these trees are not accurate proxies for RECENT temperatures. Thus, McIntyre essentially went out and found recent tree rings (from a completely different study BTW) that did not match ACTUAL temperatures and is claiming that Briffa should have factored them in. In short, he is criticizing Briffa for not using INCORRECT data. That McIntyre is wrong should be obvious to any thinking person who looks at the graph. The red and black temperature lines essentially match up until the last 50 years or so. Then the black line plummets downward while the red shoots up. Now let's engage basic reasoning for a moment... What have actual temperatures done over the past 50 years? Has it gotten significantly colder? If not, then the black line is wrong. Ask yourself how 'skeptical' you are being when you blindly accept the validity of a graph which is at odds with observed reality.
  16. On the Briffa-Yamal series being "crack cocaine for paleoclimatologists" (the comment made by McIntyre), there were non-addictive alternatives available: e.g. http://18a.akadem.ru/Articles/02/naurzbaev_en_2.pdf and http://www.nosams.whoi.edu/PDFs/papers/Holocene_v12a.pdf versus Briffa: http://www.cru.uea.ac.uk/cru/people/briffa/qsr1999/ Briffa's response to the impact of his series: http://www.cru.uea.ac.uk/cru/people/briffa/yamal2009/cautious/cautious.htm McIntyre's response to Briffa's response: http://climateaudit.org/2009/10/28/response-to-briffa-on-yamal-impact/
  17. The thread of the argument in the top post is a little disorganised. The skeptical point at the top begins "In 2003 Professor McKitrick teamed with a Canadian engineer, Steve McIntyre, in attempting to replicate the hockey stick and debunked it as statistical nonsense...." M&M03 doesn't get discussed at all in the article proper, which is a bit of an oversight I think. Also, McIntyre 2004 (?) is referenced, but the paper linked is actually McIntyre & McKitrick 2005.
  18. Eric, as I explained in comment #90 above (and as can be clearly seen in Ro234's first graph), McIntyre's 'alternative' tree ring data series diverge from reality over recent decades. So the question is... why should Briffa have sought out and incorporated erroneous data? McIntyre is here not disputing the 'stick' but rather the 'blade'... the recent large upward turn. Yet that is established not only by selection of ACCURATE tree ring proxies, but by numerous other proxies (see the main post above)... and actual surface temperature measurements... and satellite readings... and ice loss... and species migration... and... The planet has NOT experienced a massive drop in temperatures since the 1950s. So McIntyre's argument that Briffa should have shown that it had is pure nonsense. He's accusing Briffa of malfeasance for showing CORRECT results.
  19. Roh234 (@ 87) shows how easy it is for those that wish to misrepresent the science to pick-n-choose stuff that seems to support their misrepresentations. He shows a graph from Keigwin (1996). This data set refers specifically to a location in the Sargasso sea. If one was to address this particular data set scientifically, one would likely conclude that it was consistent with the evidence that the temperature variations during MWP (and to a lesser extent) during the LIA, were significantly related to ocean current and wind transport regime changes (solar driven?) that changed the distribution of global heat, with a large contribution involving “Gulf Stream” heat transport to the high Northern latitudes. It’s not surprising that temperatures in the Sargasso sea are sensitive to these. In support of this interpretation Keigwin and Pickart (1999) have shown that if one samples historical temperatures from cored proxies in the Laurentian Fan area to the NW of the Bermuda Rise, Sargasso Sea data, that sea surface temperatures were apparently much colder during the MWP compared to the LIA, and the temperatures of the Bermuda Rise-Laurentian Fan vary in “antiphase” as current regimes change. So if Roh234 (or the people that construct and disseminate misrepresentations) were to have selected Keigwin and Pickart (1999) rather than Keigwin (1996) he would have come to the opposite conclusion. Interestingly, Monckton uses the Keigwin 1996 graph to pursue exactly the same misrepresentation which is perhaps testament to the inherent laziness of those that consider it useful to attempt to pull the wool over our eyes!
  20. Chris, I think you have highlighted one of the difficulties in using proxy data. Roh234 showed that even recent proxies can result in opposite conclusions. Consequently, some scientific organizations have backed away from claiming that recent temperatures are higher / lower than those during the MWP.
    Response:

    [DB] "some scientific organizations have backed away from claiming that recent temperatures are higher / lower than those during the MWP"

    Kindly please support that assertion with links; thanks!

  21. Jonathon, the issue Chris discussed was the misuse of a small area proxy to falsely claim a global trend. This does not suggest that proxies are unreliable... just that some people will misrepresent them. That said, the tree ring divergence problem of the past century does show an example of proxy results being unreliable. However, when you get matching temperature proxy results from glaciers, stalagmites, rock boreholes, tree rings, and many other sources it becomes very difficult to argue that they ALL experienced some effect OTHER than temperature which caused matching variations. Which is one of many reasons that the original Mann 1998 finding that the MWP was a localized effect with global temperatures significantly lower then current is now considered far more strongly established than it was then.
  22. CB, By localized, do you mean NH only? Because no significant difference has beenestablished between the NH temperatures then and today. I agree that some proxies have been used to misrepresent the data.
  23. Jonathon wrote: "Because no significant difference has beenestablished between the NH temperatures then and today." That statement is simply false. As extensively documented in the post at the top of the thread.
  24. Jonathan - "Because no significant difference has beenestablished between the NH temperatures then and today." That's not just wrong, that's blatantly wrong, and contradicted by the peer reviewed literature. As CB said, read above! I'm puzzled as to why you would make such an unsupportable statement.
  25. First, with one exception, the graphs show that recent temperatures are the warmest in ~500 years. I have no argument with that statement; and many scientific association seem to agree, as many of their statements claim that recent temperatures are higher than any time in the past four centuries. They have backed away from claims of the past millenium. The following are a few temperature reconstructions in peer reviewed literature that support my earlier statement. Also, see the Greenland ice core data in post #59. You seem to be selectively choosing that data which supports your position, while ignoring that which does not. This is similar to what you are saying about using proxies to misrepresent the data. http://www.nature.com/nature/journal/v460/n7259/abs/nature08233.html http://agbjarn.blog.is/users/fa/agbjarn/files/ljungquist-temp-reconstruction-2000-years.pdf Recent temperatures may very well be warmer than any tiem in the past millenium. However, there is sufficient data in the literature which shows otherwise.

Prev  1  2  3  4  5  Next

Post a Comment

Political, off-topic or ad hominem comments will be deleted. Comments Policy...

You need to be logged in to post a comment. Login via the left margin or if you're new, register here.

Link to this page


The Consensus Project Website

THE ESCALATOR

(free to republish)


© Copyright 2024 John Cook
Home | Translations | About Us | Privacy | Contact Us