Climate Science Glossary

Term Lookup

Enter a term in the search box to find its definition.

Settings

Use the controls in the far right panel to increase or decrease the number of terms automatically displayed (or to completely turn that feature off).

Term Lookup

Settings


All IPCC definitions taken from Climate Change 2007: The Physical Science Basis. Working Group I Contribution to the Fourth Assessment Report of the Intergovernmental Panel on Climate Change, Annex I, Glossary, pp. 941-954. Cambridge University Press.

Home Arguments Software Resources Comments The Consensus Project Translations About Support

Bluesky Facebook LinkedIn Mastodon MeWe

Twitter YouTube RSS Posts RSS Comments Email Subscribe


Climate's changed before
It's the sun
It's not bad
There is no consensus
It's cooling
Models are unreliable
Temp record is unreliable
Animals and plants can adapt
It hasn't warmed since 1998
Antarctica is gaining ice
View All Arguments...


Username
Password
New? Register here
Forgot your password?

Latest Posts

Archives

Positives and negatives of global warming

What the science says...

Select a level... Basic Intermediate Advanced

Negative impacts of global warming on agriculture, health & environment far outweigh any positives.

Climate Myth...

It's not bad

"By the way, if you’re going to vote for something, vote for warming. Less deaths due to cold, regions more habitable, larger crops, longer growing season. That’s good. Warming helps the poor." (John MacArthur)

At a glance

“It's not going to be too bad”, some people optimistically say. Too right. It's going to be worse than that. There are various forms this argument takes. For example, some like to point out that carbon dioxide (CO2) is plant-food – as if nobody else knew that. It is, but it's just one of a number of essential nutrients such as water and minerals. To be healthy, plants require them all.

We know how climate change disrupts agriculture through more intense droughts, raging floods or soil degradation – we've either experienced these phenomena ourselves or seen them on TV news reports. Where droughts intensify and/or become more prolonged, the very viability of agriculture becomes compromised. You can have all the CO2 in the world but without their water and minerals, the plants will die just the same.

At the same time, increased warming is adversely affecting countries where conditions are already close to the limit beyond which yields reduce or crops entirely fail. Parts of sub-Saharan Africa fall into this category. Elsewhere, many millions of people – about one-sixth of the world’s population - rely on fresh water supplied yearly by mountain glaciers through their natural melt and regrowth cycles. Those water supplies are at risk of failure as the glaciers retreat. Everywhere you look, climate change loads the dice with problems, both now and in the future.

Please use this form to provide feedback about this new "At a glance" section. Read a more technical version below or dig deeper via the tabs above!


Further details

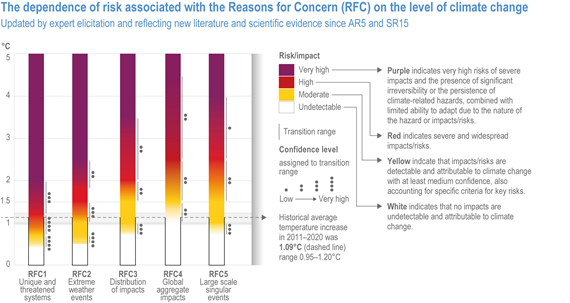
Most climate change impacts will confer few or no benefits, but may do great harm at considerable costs. We'll look at the picture, sector by sector below figure 1.

IPCC AR6 WGII Chapter 16 Figure FAQ 16.5.1

Figure 1: Simplified presentation of the five Reasons for Concern burning ember diagrams as assessed in IPCC AR6 Working Group 2 Chapter 16 (adapted from Figure 16.15, Figure FAQ 16.5.1).

Agriculture

While CO2 is essential for plant growth, that gas is just one thing they need in order to stay healthy. All agriculture also depends on steady water supplies and climate change is likely to disrupt those in places, both through soil-eroding floods and droughts.

It has been suggested that higher latitudes – Siberia, for example – may become productive due to global warming, but in reality it takes a considerable amount of time (centuries plus) for healthy soils to develop naturally. The soil in Arctic Siberia and nearby territories is generally very poor – peat underlain by permafrost in many places, on top of which sunlight is limited at such high latitudes. Or, as a veg-growing market gardening friend told us, “This whole idea of "we'll be growing grains on the tundra" is just spouted by idiots who haven't grown as much as a carrot in their life and therefore simply don't have a clue that we need intact ecosystems to produce our food.” So there are other reasons why widespread cultivation up there is going to be a tall order.

Agriculture can also be disrupted by wildfires and changes in the timing of the seasons, both of which are already taking place. Changes to grasslands and water supplies can impact grazing and welfare of domestic livestock. Increased warming may also have a greater effect on countries whose climate is already near or at a temperature limit over which yields reduce or crops fail – in parts of the Middle East and sub-Saharan Africa, for example.

Health

Warmer winters would mean fewer deaths, particularly among vulnerable groups like the elderly. However, the very same groups are also highly vulnerable to heatwaves. On a warmer planet, excess deaths caused by heatwaves are expected to be approximately five times higher than winter deaths prevented.

In addition, it is widely understood that as warmer conditions spread polewards, that will also encourage the migration of disease-bearing insects like mosquitoes, ticks and so on. So long as they have habitat and agreeable temperatures to suit their requirements, they'll make themselves at home. Just as one example out of many, malaria is already appearing in places it hasn’t been seen before.

Polar Melting

While the opening of a year-round ice-free Arctic passage between the Atlantic and Pacific oceans would have some commercial benefits, these are considerably outweighed by the negatives. Detrimental effects include increased iceberg hazards to shipping and loss of ice albedo (the reflection of sunshine) due to melting sea-ice allowing the ocean to absorb more incoming solar radiation. The latter is a good example of a positive climate feedback. Ice melts away, waters absorb more energy and warming waters increase glacier melt around the coastlines of adjacent lands.

Warmer ocean water also raises the temperature of submerged Arctic permafrost, which then releases methane, a very potent greenhouse gas. The latter process has been observed occurring in the waters of the East Siberian Arctic Shelf and is poorly understood. At the other end of the planet, melting and break-up of the Antarctic ice shelves will speed up the land-glaciers they hold back, thereby adding significantly to sea-level rise.

Ocean Acidification

Acidity is measured by the pH scale (0 = highly acidic, 7 = neutral, 14 = highly alkaline). The lowering of ocean pH is a cause for considerable concern without any counter-benefits at all. This process is caused by additional CO2 being absorbed in the water. Why that's a problem is because critters that build their shells out of calcium carbonate, such as bivalves, snails and many others, may find that carbonate dissolving faster than they can make it. The impact that would have on the marine food-chain should be self-evident.

Melting Glaciers

The effects of glaciers melting are largely detrimental and some have already been mentioned. But a major impact would be that many millions of people (one-sixth of the world’s population) depend on fresh water supplied each year by the seasonal melt and regrowth cycles of glaciers. Melt them and those water supplies, vital not just for drinking but for agriculture, will fail.

Sea Level Rise

Many parts of the world are low-lying and will be severely affected even by modest sea level rises. Rice paddies are already becoming inundated with salt water, destroying the crops. Seawater is contaminating rivers as it mixes with fresh water further upstream, and aquifers are becoming saline. The viability of some coastal communities is already under discussion, since raised sea levels in combination with seasonal storms will lead to worse flooding as waves overtop more sea defences.

Environmental

Positive effects of climate change may include greener rainforests and enhanced plant growth in the Amazon, increased vegetation in northern latitudes and possible increases in plankton biomass in some parts of the ocean.

Negative responses may include some or all of the following: further expansion of oxygen-poor ocean “dead zones”, contamination or exhaustion of fresh water supplies, increased incidence of natural fires and extensive vegetation die-off due to droughts. Increased risk of coral extinction, changes in migration patterns of birds and animals, changes in seasonal timing and disruption to food chains: all of these processes point towards widespread species loss.

Economic

Economic impacts of climate change are highly likely to be catastrophic, while there have been very few benefits projected at all. As long ago as 2006, the Stern Report made clear the overall pattern of economic distress and that prevention was far cheaper than adaptation.

Scenarios projected in IPCC reports have repeatedly warned of massive future migrations due to unprecedented disruptions to global agriculture, trade, transport, energy supplies, labour markets, banking and finance, investment and insurance. Such disturbances would wreak havoc on the stability of both developed and developing nations and they substantially increase the risk of future conflicts. Furthermore, it is widely accepted that the detrimental effects of climate change will be visited mostly on those countries least equipped to cope with it, socially or economically.


These and other areas of concern are covered in far more detail in the 36-page Summary for Policymakers from the IPCC AR6 Synthesis Report, released in March 2023. The report spells out in no uncertain terms the increasingly serious issues Mankind faces; the longer that meaningful action on climate is neglected, the greater the severity of impacts. The report is available for download here.


Last updated on 21 April 2023 by John Mason. View Archives

Printable Version  |  Offline PDF Version  |  Link to this page

Argument Feedback

Please use this form to let us know about suggested updates to this rebuttal.

Related Arguments

Further reading

National Geographic have an informative article listing the various positives and negatives of global warming for Greenland.

Climate Wizard is an interactive tool that lets you examine projected temperature and precipitation changes for any part of the world.

A good overview of the impacts of ocean acidification is found in Ken Caldeira's What Corals are Dying to Tell Us About CO2 and Ocean Acidification

Denial101x video

Here is a related video lecture from Denial101x - Making senses of climate science denial

Comments

Prev  1  2  3  4  5  6  7  8  9  10  11  Next

Comments 176 to 200 out of 265:

  1. mohyla103 it takes only a slight rise in temperature to make precipitation fall as rain instead of snow. Rain runs off glaciers and cannot add to their mass: that requires snow.
  2. mohyla @174 - "reduced global precipitation hasn't been proven as a result of AGW yet. Has it?" No. Global precipitation is expected to increase with global warming - it appears to have done so in ancient "greenhouse" periods much warmer than today. So there is an observational basis to support the modeling too. The problem being that it (precipitation) won't fall in some areas where humans have set up large tracts of agriculture. A compounding problem is the precipitation is likely to fall in heavier, but less frequent, downpours. Again a significant problem for agriculture. See SkS post:The Dai After Tomorrow
  3. mohyla103 @174: (1) is definitely cringe worthy. On the other hand, the following rivers are all sourced in the Himalayas and are at least partially dependent on glacial melt water for steady flows: Ganges (India, Bangladesh)400 million plus Huang He [Yellow River] (Tibet, China) 150 million plus Indus (India, Pakistan) 170 million plus Irrawaddy (Burma) 30 million plus Mekong (China, Burma, Laos, Thailand, Cambodia, Vietnam) 17 plus million (delta only) Yangtze (Tibet, China) 430 million plus Total: 1.2 billion plus This excludes several minor rivers flowing into arid regions with lower population density: Glaciers act as natural dams, absorbing large precipitation events while maintaining a relatively steady flow of melt water. As such, they help prevent floods, and prevent seasonal water shortages. Consequently your skepticism is in this case at least unwarranted. How dependent the various rivers are on melt water varies substantially, ranging from 60% for the Indus river to 10% for the Huang He and Yangtze. As such, loss of the water flow buffer from glacial melts would only effect people relying on the Yangtze or Huang He on very wet (flood) or very dry (drought years), whereas on the Indus, adverse impacts could be expected every year. Further, because glacial melt is not the only impact of global warming, the overall effects on different rivers can be quite different. The primarily rainfall dependent Chinese rivers, for example, are expected to increase average flows by about 10%, while the Brahmaputra (a major tributary of the Ganges) is expected to reduce average annual flows by about 20%. (Note these are annual figures, and do not address the issue of changes of timing of river flows.)
  4. JMurphy: Maybe I'm splitting hairs here, but the misleading part is that the paragraph title is "melting glaciers" but the 1/6 of the world's population figure seems to be referring to the number of people living in a "snowmelt-dominated, low-reservoir-storage" area. Glaciers and annual snowfall are quite different things but Barnett seems to ignore the difference. The Barnett paper says of the Himalaya–Hindu Kush region: "...there is little doubt that melting glaciers provide a key source of water for the region in the summer months: as much as 70% of the summer flow in the Ganges and 50–60% of the flow in other major rivers." After checking the three sources for these figures, I find this claim to be very misleading! Allow me to present the relevant sections of Barnett's sources: Singh, Bengtsson: "Reduction of water availability during the summer period, which contributes about 60% to the annual flow..." Careful reading reveals that this source does not say glaciers contribute 60% of the total water flow in the river, but rather that the water flowing in the summer period (a combination of rain, glacier melt and snow melt) is 60% of the annual total. From this we can deduce that glacier melt itself is only a fraction of 60% of annual flow, not a full 60%. Singh, Jain, Kumar: "The snow-covered area in the basin was determined using satellite imagery. It is observed that, on average, about 70% of the area of the basin is covered with snow in March/April and this is reduced to about 24% in September/October. The average snow and glacier runoff contribution to the annual flow of the Chenab River at Akhnoor is estimated to be about 49 percent." They do not claim 49% is from glaciers, but a combination of snow and glaciers, so for Barnett to use this figure when talking about glaciers alone is inaccurate. Also, it appears there is still snow cover in this basin into October, so presumably it would be there all year. The importance of this is that, in a glacierless basin, there would still be plenty of snow melting every year to replenish the river. The actual fraction by which river flow would be lowered without the glaciers is not explained here (?) but it certainly is not 50%. Singh, Kain: "It was found that the average contribution of snow and glacier runoff in the annual flow of the Satluj River at Bhakra Dam is about 59%..." Once again, snow and glacier runoff is lumped together. As snow is an annually replenished resource whereas a retreating glacier is a more irreversible change, it would be helpful to know the separate contributions of each. For Barnett to use the full 59% in his paper, he is actually talking about a scenario where not only are the glaciers gone, but it never snows anymore either! Sorry, I can't comment on the Immerzeel paper as I can only read the abstract and there is nothing specific to the Barnett paper in it. But I hope you'll agree, that Barnett's paper is misleading and a misrepresentation of data.
  5. logicman: Good point. However, I'm not arguing that glaciers aren't shrinking or won't continue to shrink. I'm just curious where the evidence is that *so many* people are dependent on the actual water melting off glaciers in the first place instead of other sources like snowmelt or rain runoff.
  6. Tom Curtis: I do like your phrase "partially dependent". This seems a much more reasonable way to describe the situation. Do you know if there have been any studies in at-risk areas to determine how much meltwater actually comes from glaciers in the summer vs. remaining snowpack from the previous winter? It seems this would be valuable information. "Glaciers act as natural dams..." which can burst causing massive flooding events downstream. A retreating glacier would eliminate this possible threat, so it's not all bad news. "...absorbing large precipitation events..." I don't understand what you're referring to here: rain or snow? Does a glacier have a way of absorbing rainwater besides damming it up? logicman just told me rain cannot add to the mass of a glacier, so I'm confused now. If it's snow, why would a glacier need to absorb this? Is snow just accumulating on the ground more of a danger? "...while maintaining a relatively steady flow of melt water." Melting snow would also provide this, but in areas where the snow melts away quickly, glaciers would definitely provide a more permanent source of water. I agree with you on this point. I just wonder how significant this percentage is compared to snowmelt in those at-risk areas.
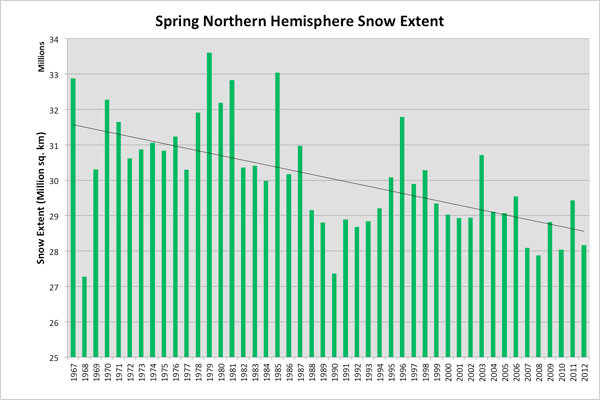
  7. mohyla103 - Snowpack is right up there with the glaciers. [Source] Less snow, less summer storage, less runoff - hence impacts on drinking water and agriculture
  8. KR: I see. Declining snow extent seems a natural result of a warming planet so I'm not surprised. My original post was not an argument that warming isn't happening, just that the figures presented there seemed exaggerated in reference to "melting glaciers".
  9. myhyla103, could you provide the link to where you read the Singh, Bengtsson paper.
  10. JMurphy, I didn't read the full paper of any of those three as I don't have free access to them. However, the figures are right in the abstracts. Singh, Bengtsson: http://onlinelibrary.wiley.com/doi/10.1002/hyp.1468/abstract Singh, Jain, Kumar: www.jstor.org/stable/3673913 Singh, Jain: http://www.mendeley.com/research/snow-and-glacier-melt-in-the-satluj-river-at-bhakra-dam-in-the-western-himalayan-region/
  11. mohyla103 wrote : "I didn't read the full paper of any of those three as I don't have free access to them. However, the figures are right in the abstracts." OK, so firstly, when you wrote : "After checking the three sources for these figures, I find this claim to be very misleading!", you hadn't actually checked the sources - you read the abstracts and decided that was enough to make your 'misleading' claims. That seems to be very strong and yet insubstantial, as far as I can see, especially when you haven't read the details in the papers themselves. Anyone would need to be very sceptical of your claims, especially (with regard to Singh & Bengtsson) when you previously claimed "[c]areful reading" of that source allowed you to "deduce that glacier melt itself is only a fraction of 60% of annual flow, not a full 60%." Who claimed it to be "a full 60%" ? With regard to that "fraction", how have you worked out that fraction ? The abstract states : Under warmer climate, a typical feature of the study basin was found to be reduction in melt from the lower part of the basin owing to a reduction in snow covered area and shortening of the summer melting season, and, in contrast, an increase in the melt from the glacierized part owing to larger melt and an extended ablation period. Thus, on the basin scale, reduction in melt from the lower part was counteracted by the increase from melt from upper part of the basin, resulting in a decrease in the magnitude of change in annual melt runoff. I.E. Less from snow and more from the glaciers, leading to decrease in magnitude of annual change - in no way misleading or wrong with regard to Barnett et al's claim : "...but there is little doubt that melting glaciers provide a key source of water for the region in the summer months: as much as 70% of the summer flow in the Ganges and 50–60% of the flow in other major rivers." (My bold) If you still think that is misleading, provide the evidence for a figure you think is more valid, i.e. under 50%.
  12. JMurphy: The abstracts are all I had access to, and I apologize for any misunderstanding. The figures are already present in the abstracts though, so I would still consider my statement valid. I'm going to ignore the quotation you pasted in from the abstract because it does not mention percentages at all and it's the percentages that I said Barnett must have got wrong. Once again, the relevant sentence from the abstract is: "Reduction of water availability during the summer period, which contributes about 60% to the annual flow, may have severe implications on the water resources of the region..." Here we have an actual figure, 60%. The way I read this sentence is that there may be water flowing all year in this river, but the *water* from the summer period specifically represents 60% of the annual flow; i.e. the water from fall, winter and spring together makes up only 40% of the annual total. Do you agree with my analysis of this sentence? If not, please ignore the paragraphs below and clarify how I read this sentence wrong. Now if *all* the water flowing in the river in the summer period came from melting glaciers, this would mean that 60% of the annual flow does indeed come from glaciers, since the summer water accounts for 60% of the annual flow. However, I made the reasonable (wouldn't you say?) presumption that the summer flow does not only come from glacier melt, but also snow melt and rainfall. If you agree with my presumption, then you would agree only a fraction of the summer flow is from actual glacier melt, which means only a fraction of 60% of the annual flow is from glaciers. That's how I arrived at this "fraction" and I stand by my previous statement. How big is the fraction from glaciers? If 5/6 of summer runoff comes from glaciers (that seems pretty generous, but without further evidence I admit it's possible) then Barnett would still be OK using a figure of 50%, but any less and Barnett's figure wouldn't be accurate. Without searching the full text of the paper for a percentage for glacier melt specifically, we have no way of proving or disproving this. Considering his sloppy use of the other 2 sources, I don't have much confidence in his referencing of this source either. If you have access to the full text, by all means let me know if there is a figure for glacier melt specifically. If not, we'll just have to leave a question mark on this one. However, I'll take your lack of comment on the other 2 sources as agreement that Barnett's misrepresented the data in saying that "melting glaciers provide....50-60% of the flow" in these rivers. It is not melting glaciers alone, but the combination of melting glaciers and melting snowpack.
  13. mohyla103, as you were the one who made the original accusations, i.e. : misleading claims that make me skeptical of AGW reporting accuracy in general; Glaciers and annual snowfall are quite different things but Barnett seems to ignore the difference.; After checking the three sources for these figures, I find this claim to be very misleading!; and But I hope you'll agree, that Barnett's paper is misleading and a misrepresentation of data., then it is incumbent on you to back up those accusations by quoting the relevant actual figures to show where they have been misused. So far, you have been unable to because, as you later admitted : I didn't read the full paper of any of those three as I don't have free access to them., and you tried to justify this by claiming : The figures are already present in the abstracts though, so I would still consider my statement valid.. However, as you have already admitted with regard to the Singh & Bengtsson paper : How big is the fraction from glaciers? If 5/6 of summer runoff comes from glaciers (that seems pretty generous, but without further evidence I admit it's possible) then Barnett would still be OK using a figure of 50%, but any less and Barnett's figure wouldn't be accurate. Without searching the full text of the paper for a percentage for glacier melt specifically, we have no way of proving or disproving this. Considering his sloppy use of the other 2 sources, I don't have much confidence in his referencing of this source either.. So, you don't know what the actual relevant percentage is but you still feel justified in making your original accusation anyway, because of your reading of the other two abstracts. I'm sorry but that is not the sign of someone who wants to discover the truth, but someone who has already made their mind up and will not change it, no matter what. How can anyone confidently make the accusations you have without first checking whether there was at least some justification in what you are claiming ? This is why, when you finally come out with : However, I'll take your lack of comment on the other 2 sources as agreement that Barnett's misrepresented the data in saying that "melting glaciers provide....50-60% of the flow" in these rivers. It is not melting glaciers alone, but the combination of melting glaciers and melting snowpack., I have to say 'What is the point ?' It would appear that you are not here to discuss, but only to make baseless accusations and to stick to your beliefs come what may. I have read exactly the same abstracts as you have but I know that only reading the full papers will give the answers to any queries you might have. I also have confidence that those who have produced all the papers referred to did so using figures that have been checked and confirmed by others. Until you have proof otherwise, I suggest you withdraw your accusations.
  14. JMurphy: I think you may be over-reacting to mohyla103. Questions raised are reasonable, and are still valid based on info reported in the abstracts. Remember, those of us outside of the paywall don't always have free access to the entire paper. Also, mohyla103 reacts reasonable to KRs evidence presented @182, suggesting motives are in line with seeking the truth.
  15. I want to point out another peer-reviewed article, which I think is quite relevant to this thread. It is a research review assessing the economic impacts of climate change (Tol 2009). Here is the link [link] Some findings from the paper: 1. Negative economic impact is more likely for temperature increase exceeding 2 degrees C (minimum estimated in IPCC AR4 for year 2100). See figure 1 in the paper. 2. Table 2 shows estimated carbon taxes (per metric ton) that would compensate for the expected future economic loss. In Tol's words: "The best available knowledge—which is not very good—is given in Table 2. A government that uses the same 3 percent discount rate for climate change as for other decisions should levy a carbon tax of $25 per metric ton of carbon (modal value) to $50/tC (mean value). A higher tax can be justified by an appeal to the high level of risk, especially of very negative outcomes, not captured in the standard estimates (Weitzman, forthcoming)."
    Response: [RH] Embedded link that was breaking page format.
  16. MarkOhio, I did not intend to over-react but if it is seen in that way then I apologise to mohyla103 for giving that impression, and hope I haven't scared him/her away ! However, I still think it excessive to make the four accusations I quoted in my previous post, without the required solid evidence to back them up. At least, I don't see the abstracts as containing such solid evidence, anyway. And I'm not saying that the accusations are necessarily definitely wrong - just unproven and, so far, carelessly made, in my opinion.
  17. MarkOhio: Thank you. JMurphy: When I do find a way to get access to the articles I will read them. I don't understand why you would say "what's the point". Saying that it "would appear that [I am] not here to discuss, but only to make baseless accusations and to stick to [my] beliefs come what may" is not only rude but is also baseless and should be withdrawn. I *still* stand by my claim. Here is the HARD EVIDENCE which you have requested but, even though I presented it above, you have not yet confronted: The Singh, Jain, Kumar paper's abstract states "The average snow and glacier runoff contribution to the annual flow of the Chenab River at Akhnoor is estimated to be about 49 percent." It doesn't really matter what the rest of the paper says, the abstract already tells me that snow and glacier melt together make up less than 50 percent of the flow in this river. There's no way the paper can have any figure higher than 49 percent for glacial melt alone... unless snowmelt somehow imparts a negative amount of water to the river. Also, unless snow melt accounts for 0% of the flow in the river, the amount from glaciers MUST be even less than 49%. So for Barnett to cite this source as evidence for a 50-60% glacial melt contribution is in fact WRONG. Please acknowledge this or I will have to believe it is you who is going to stick to his beliefs come what may. Considering he definitely misrepresented data from at least this source, wouldn't you think it reasonable to examine the other sources more closely as similar errors are likely? Apparently peer review completely missed the error in Barnett citing this source, which is why I don't have the same "confidence that those who have produced all the papers referred to did so using figures that have been checked and confirmed by others" like you do. In light of recent discussion, I will restate my position: 1. "misleading claims that make me skeptical of AGW reporting accuracy in general;" I stand by this, as Barnett's use of data has been proven to be wrong in at least one case. Notice I said skeptical of "AGW reporting" not "AGW itself". It's the exaggerations in reporting that irritate me. 2. "Glaciers and annual snowfall are quite different things but Barnett seems to ignore the difference.;" I can rephrase this as "Barnett seems to ignore the difference in citing at least one paper, where he cited a 49% for combined glacier and snow melt figure as evidence for 50-60% contribution from glacial melt alone". 3. "After checking the three sources for these figures, I find this claim to be very misleading!" can be rephrased as "After checking the abstracts of these three sources, I find Barnett's claim to be misleading. At least one abstract proves Barnett misrepresented the data, so careful examination of the other 2 sources is definitely warranted." 4. "But I hope you'll agree, that Barnett's paper is misleading and a misrepresentation of data." can be rephrased as "But I hope you'll agree that the figures in this part of Barnett's paper are misleading and a misrepresentation of data."
  18. mohyla103, I'm afraid you are still arguing based on incomplete information, which is never a good idea. As an illustration with regard to that 49% average, can you answer the following questions : What is the maximum percentage possible ? When does that maximum occur ? How much of that maximum is contributed by glacier-melt ?
  19. I'll answer your 1st and 3rd questions together: What is the maximum percentage possible ? How much of that maximum is contributed by glacier-melt? Admittedly more than 49% from glacier and snowpack melt is possible at a peak time of the year. Admittedly, the amount from glacier melt could at a peak time exceed 49% of the flow in the river. However, this is irrelevant as Barnett never made this claim. See below. Your 2nd question: When does that maximum occur ? I don't know. However, this is irrelevant as Barnett's original 50-60% did not refer to peak flow at a certain time of year but total flow. Were this the Ganges, I could understand your point as Barnett specifically referred to the summer period for the Ganges. However, for the Chenab river, he did not. As far as I can tell, Barnett was not talking about some peak melting time where glacier and snowpack melt contribute more to the river than usual, he was talking about their total contribution to river flow; therefore, an average yearly figure is what would be required as evidence, not a figure about a period of peak contribution. Maybe this is where our misunderstanding lies?
  20. Mohyla103 at #181:
    "Glaciers act as natural dams..." which can burst causing massive flooding events downstream. A retreating glacier would eliminate this possible threat, so it's not all bad news.
    Erm, no. No, no, and NO. Glaciers do not impound water, they hold it as frozen mass, so there is no equivalency with "bursting" dams. However... If precipitation falls as water when it would previously have fallen as snow, then there will be greater downstream flows during precipitation seasons. This may indeed cause flooding, but not of the instantaneous sort that follows a dam bursting. Therefore a "retreating" glacier will more likely cause flooding events, but not in a manner akin to a bursting dam. It also means that there will be reduced (or no) flow during non-precipitation seasons. This is bad news on both counts.
  21. mohyla103 wrote : "As far as I can tell, Barnett was not talking about some peak melting time where glacier and snowpack melt contribute more to the river than usual, he was talking about their total contribution to river flow; therefore, an average yearly figure is what would be required as evidence, not a figure about a period of peak contribution. Maybe this is where our misunderstanding lies?" The misunderstanding would be dependent on whether you were referring to this statement in Barnett et al : The hydrological cycle of the region is complicated by the Asian monsoon, but there is little doubt that melting glaciers provide a key source of water for the region in the summer months: as much as 70% of the summer flow in the Ganges and 50–60% of the flow in other major rivers 40,41,42. (40. Singh, P. & Bengtsson, L. Hydrological sensitivity of a large Himalayan basin to climate change. Hydrol. Process. 18, 2363–-2385 (2004). 41. Singh, P., Jain, S. K. & Kumar, N. Estimation of snow and glacier-melt contribution to the Chenab River, Western Himalaya. Mount. Res. Develop. 17(1), 49–-56 (1997). 42. Singh, P. & Jain, S. K. Snow and glacier melt in the Satluj River at Bhakdra Dam in the western Himalayan region. Hydrol. Sci. J. 47, 93–-106 (2002).) If so, he mentions "summer months" and "summer flow" (peak melting time, perhaps ?); references the Chenab river, and writes "as much as...50-60%...". Which part of Barnett, specifically, were you referring to - particularly with regard to those particular references ?
  22. Yes, that's exactly the sentence I'm referring to. The wording here is tricky, so this is probably where the misunderstanding comes from. I find it strange that he mentioned summer months, then specifically referred to "summer flow" with the Ganges, but not with other major rivers. So I interpret this sentence like this: "a key source of water for the region in the summer months" Glacier meltwater provides water in the summer for the Ganges and other major rivers. The sources all confirm this as well. "as much as 70% of the summer flow in the Ganges" This one's straightforward. The abstracts of Barnett's sources don't mention this but I presume this figure is in the full text and I'm not arguing anything here. "and 50-60% of the flow in other major rivers" What flow is he talking about? I interpret this as a yearly average, not summer specifically, especially since the sources all mention a yearly average figure around 50-60% right in their abstracts. Notice Barnett did not say "summer flow" like he did with the Ganges. Obviously, glaciers do provide water "in the summer months", so Barnett is not wrong to word the first part of his sentence this way, but I don't think you can assume this 50-60% figure actually refers to summer flow. I'm working on getting access to the full text of the Singh, Jain, Kumar paper and I'll let you know what it says in there as soon as I find out.
  23. Bernard J.: "Glaciers do not impound water, they hold it as frozen mass." Did you mean that glaciers can be actual dams that hold liquid water back behind them, or that glaciers act like a dam in that they hold precipitation (snow, not rain) at a higher altitude? If it is the latter, then I misunderstood the phrase "natural dam" in your original statement. I thought you were referring to something like this, where a glacier acts as a true dam, actually impounding water, and actually bursting: http://en.wikipedia.org/wiki/Glacial_lake_outburst_flood
  24. JMurphy I got a hold of a copy of the Singh, Jain and Kumar paper. As expected, there is no mention whatsoever of glacial melt separate from snow melt. In this study, they were calculated together and, in fact, not even directly measured. FYI the study was completed with data collected over 10 years, so the figures presented are averages. Nowhere in the paper does it give a "maximum percentage possible" that you had asked about, so for Barnett's figures to be referring to that isn't possible. Here's one relevant section, from page 52, showing that the author of this paper did not distinguish between glacial melt and snow melt in this study: "Snow and glacier contribution to the 10 years' volume of flow in the Chenab River at Akhnoor has been estimated using the following water balance approach: Snow + glacier runoff volume = Observed flow volume - (rainfall volume - evapotranspiration)" Barnett was definitely correct to cite this paper in saying that glaciers provide a key source of water in the summer, of course. Page 51: "In the post-monsoon season, flow is believed to be from the glaciers and occasional rainfall events in the basin. In general, glacier contribution starts in June/July and continues until September/October." But that's all it says. There are no percentages given here for glacial melt. There is a table on page 51 showing the "Average quarterly distribution of annual flows" where we learn that the water flowing in the July-Sept period represents 51.1% of the annual flow. However, this is once again not referring to glacial melt alone, as flow in the July-Sept period comes from rain, glaciers and snow. Singh et al. confirm this in the discussion below the table where they say "[t]he higher contribution to the annual flow from the pre-monsoon season (April-June) and the monsoon season (July-September) is due to the combination of rain, and snow and glacier-melt runoff." One more relevant bit, from the Conclusion section on page 56: "2. It was found that snow and glacier-melt runoff contribute significantly to the total runoff of the Chenab River at Akhnoor. Based on 10 years of data analysis, the average snow and glacier-melt contribution to the annual flow of Chenab at Akhnoor was found to be 49.10 percent. The remainder is contributed by rainfall." In conclusion, Barnett was wrong to cite this paper as evidence that glaciers contribute 50-60% of the flow in this river, either for the summer or a yearly average. It is actually glacier and snow melt together (and technically it's not 50 it's 49). The peer-review process missed this error. Please acknowledge this, as I am no longer arguing based on incomplete information. Considering the same kind of wording and figures appear in the abstracts of the other 2 papers cited by Barnett for this claim, I strongly suspect he and the reviewers committed the same error there. To Barnett's credit, the summary at the beginning of the article actually does mention snowpack and glaciers, not just glaciers alone.
  25. You write: Health negatives. Spread in mosquite-borne diseases such as Malaria and Dengue Fever. The article you quote (Epstein et al. 1998) states: "the minimum temperature for P. falciparum malaria parasite development is experimentally between 16° and 19°C and varies among mosquito species (Molineaux 1988). In general, isotherms present boundary conditions, and transmission is generally limited by the 16°C winter isotherm." This is simply wrong: malaria was endemic in Canada less than 100 years ago. A recent Canadian editorial (reference and quote below) quotes several old medical articles on this subject. The recent recurrence of malaria in developed countries is entirely due to increased air travels and drug-resistant Plasmodium. It has nothing to do with climate change. J. Dick MacLean, MD; Brian J. Ward, MD. The return of swamp fever: malaria in Canadians. Can Med Ass J JAN. 26, 1999; 160:211-212. "Malaria is an old Canadian disease. It was an important cause of illness and death in the past century in Upper and Lower Canada and out into the Prairies.1,2 During the period 1826–1832, malaria epidemics halted the construction of the Rideau Canal between Ottawa and Kingston, Ont., during several consecutive summers, with infection rates of up to 60% and death rates of 4% among the labourers.3 Malaria also appears to have had an important effect on the health of the Northwest Mounted Police in the Prairies.1 When the Montreal General Hospital opened, in 1823, 3% of the first 3665 patients admitted were ill with malaria, and 3% died in hospital as a consequence. Canada’s own William Osler popularized the use of the microscope for the diagnosis of malaria in North America in the late 19th century.4 The endemic malaria in North America was probably reinforced each spring by waves of infected immigrants from Europe. Several of our indigenous Anopheles mosquitoes were, and still are, capable vectors of human plasmodia."

Prev  1  2  3  4  5  6  7  8  9  10  11  Next

Post a Comment

Political, off-topic or ad hominem comments will be deleted. Comments Policy...

You need to be logged in to post a comment. Login via the left margin or if you're new, register here.

Link to this page


The Consensus Project Website

THE ESCALATOR

(free to republish)


© Copyright 2024 John Cook
Home | Translations | About Us | Privacy | Contact Us