Climate Science Glossary

Term Lookup

Enter a term in the search box to find its definition.

Settings

Use the controls in the far right panel to increase or decrease the number of terms automatically displayed (or to completely turn that feature off).

Term Lookup

Settings


All IPCC definitions taken from Climate Change 2007: The Physical Science Basis. Working Group I Contribution to the Fourth Assessment Report of the Intergovernmental Panel on Climate Change, Annex I, Glossary, pp. 941-954. Cambridge University Press.

Home Arguments Software Resources Comments The Consensus Project Translations About Support

Twitter Facebook YouTube Mastodon MeWe

RSS Posts RSS Comments Email Subscribe


Climate's changed before
It's the sun
It's not bad
There is no consensus
It's cooling
Models are unreliable
Temp record is unreliable
Animals and plants can adapt
It hasn't warmed since 1998
Antarctica is gaining ice
View All Arguments...


Username
Password
New? Register here
Forgot your password?

Latest Posts

Archives

Positives and negatives of global warming

What the science says...

Select a level... Basic Intermediate Advanced

Negative impacts of global warming on agriculture, health & environment far outweigh any positives.

Climate Myth...

It's not bad

"By the way, if you’re going to vote for something, vote for warming. Less deaths due to cold, regions more habitable, larger crops, longer growing season. That’s good. Warming helps the poor." (John MacArthur)

At a glance

“It's not going to be too bad”, some people optimistically say. Too right. It's going to be worse than that. There are various forms this argument takes. For example, some like to point out that carbon dioxide (CO2) is plant-food – as if nobody else knew that. It is, but it's just one of a number of essential nutrients such as water and minerals. To be healthy, plants require them all.

We know how climate change disrupts agriculture through more intense droughts, raging floods or soil degradation – we've either experienced these phenomena ourselves or seen them on TV news reports. Where droughts intensify and/or become more prolonged, the very viability of agriculture becomes compromised. You can have all the CO2 in the world but without their water and minerals, the plants will die just the same.

At the same time, increased warming is adversely affecting countries where conditions are already close to the limit beyond which yields reduce or crops entirely fail. Parts of sub-Saharan Africa fall into this category. Elsewhere, many millions of people – about one-sixth of the world’s population - rely on fresh water supplied yearly by mountain glaciers through their natural melt and regrowth cycles. Those water supplies are at risk of failure as the glaciers retreat. Everywhere you look, climate change loads the dice with problems, both now and in the future.

Please use this form to provide feedback about this new "At a glance" section. Read a more technical version below or dig deeper via the tabs above!


Further details

Most climate change impacts will confer few or no benefits, but may do great harm at considerable costs. We'll look at the picture, sector by sector below figure 1.

IPCC AR6 WGII Chapter 16 Figure FAQ 16.5.1

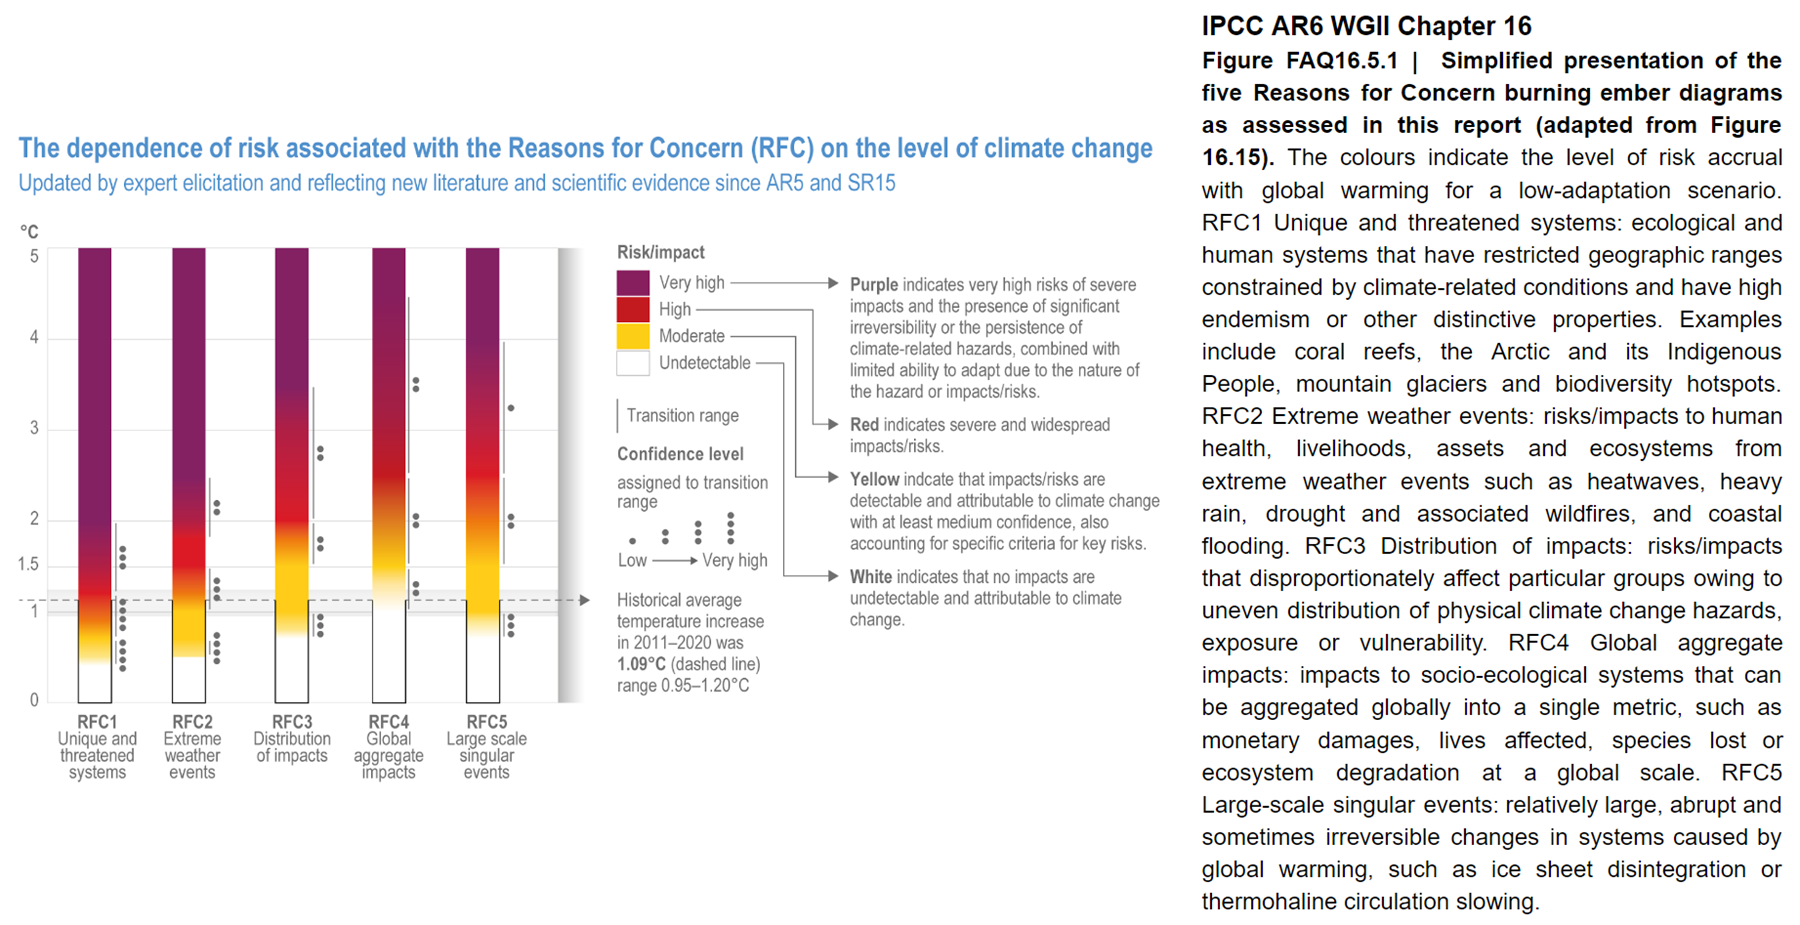
Figure 1: Simplified presentation of the five Reasons for Concern burning ember diagrams as assessed in IPCC AR6 Working Group 2 Chapter 16 (adapted from Figure 16.15, Figure FAQ 16.5.1).

Agriculture

While CO2 is essential for plant growth, that gas is just one thing they need in order to stay healthy. All agriculture also depends on steady water supplies and climate change is likely to disrupt those in places, both through soil-eroding floods and droughts.

It has been suggested that higher latitudes – Siberia, for example – may become productive due to global warming, but in reality it takes a considerable amount of time (centuries plus) for healthy soils to develop naturally. The soil in Arctic Siberia and nearby territories is generally very poor – peat underlain by permafrost in many places, on top of which sunlight is limited at such high latitudes. Or, as a veg-growing market gardening friend told us, “This whole idea of "we'll be growing grains on the tundra" is just spouted by idiots who haven't grown as much as a carrot in their life and therefore simply don't have a clue that we need intact ecosystems to produce our food.” So there are other reasons why widespread cultivation up there is going to be a tall order.

Agriculture can also be disrupted by wildfires and changes in the timing of the seasons, both of which are already taking place. Changes to grasslands and water supplies can impact grazing and welfare of domestic livestock. Increased warming may also have a greater effect on countries whose climate is already near or at a temperature limit over which yields reduce or crops fail – in parts of the Middle East and sub-Saharan Africa, for example.

Health

Warmer winters would mean fewer deaths, particularly among vulnerable groups like the elderly. However, the very same groups are also highly vulnerable to heatwaves. On a warmer planet, excess deaths caused by heatwaves are expected to be approximately five times higher than winter deaths prevented.

In addition, it is widely understood that as warmer conditions spread polewards, that will also encourage the migration of disease-bearing insects like mosquitoes, ticks and so on. So long as they have habitat and agreeable temperatures to suit their requirements, they'll make themselves at home. Just as one example out of many, malaria is already appearing in places it hasn’t been seen before.

Polar Melting

While the opening of a year-round ice-free Arctic passage between the Atlantic and Pacific oceans would have some commercial benefits, these are considerably outweighed by the negatives. Detrimental effects include increased iceberg hazards to shipping and loss of ice albedo (the reflection of sunshine) due to melting sea-ice allowing the ocean to absorb more incoming solar radiation. The latter is a good example of a positive climate feedback. Ice melts away, waters absorb more energy and warming waters increase glacier melt around the coastlines of adjacent lands.

Warmer ocean water also raises the temperature of submerged Arctic permafrost, which then releases methane, a very potent greenhouse gas. The latter process has been observed occurring in the waters of the East Siberian Arctic Shelf and is poorly understood. At the other end of the planet, melting and break-up of the Antarctic ice shelves will speed up the land-glaciers they hold back, thereby adding significantly to sea-level rise.

Ocean Acidification

Acidity is measured by the pH scale (0 = highly acidic, 7 = neutral, 14 = highly alkaline). The lowering of ocean pH is a cause for considerable concern without any counter-benefits at all. This process is caused by additional CO2 being absorbed in the water. Why that's a problem is because critters that build their shells out of calcium carbonate, such as bivalves, snails and many others, may find that carbonate dissolving faster than they can make it. The impact that would have on the marine food-chain should be self-evident.

Melting Glaciers

The effects of glaciers melting are largely detrimental and some have already been mentioned. But a major impact would be that many millions of people (one-sixth of the world’s population) depend on fresh water supplied each year by the seasonal melt and regrowth cycles of glaciers. Melt them and those water supplies, vital not just for drinking but for agriculture, will fail.

Sea Level Rise

Many parts of the world are low-lying and will be severely affected even by modest sea level rises. Rice paddies are already becoming inundated with salt water, destroying the crops. Seawater is contaminating rivers as it mixes with fresh water further upstream, and aquifers are becoming saline. The viability of some coastal communities is already under discussion, since raised sea levels in combination with seasonal storms will lead to worse flooding as waves overtop more sea defences.

Environmental

Positive effects of climate change may include greener rainforests and enhanced plant growth in the Amazon, increased vegetation in northern latitudes and possible increases in plankton biomass in some parts of the ocean.

Negative responses may include some or all of the following: further expansion of oxygen-poor ocean “dead zones”, contamination or exhaustion of fresh water supplies, increased incidence of natural fires and extensive vegetation die-off due to droughts. Increased risk of coral extinction, changes in migration patterns of birds and animals, changes in seasonal timing and disruption to food chains: all of these processes point towards widespread species loss.

Economic

Economic impacts of climate change are highly likely to be catastrophic, while there have been very few benefits projected at all. As long ago as 2006, the Stern Report made clear the overall pattern of economic distress and that prevention was far cheaper than adaptation.

Scenarios projected in IPCC reports have repeatedly warned of massive future migrations due to unprecedented disruptions to global agriculture, trade, transport, energy supplies, labour markets, banking and finance, investment and insurance. Such disturbances would wreak havoc on the stability of both developed and developing nations and they substantially increase the risk of future conflicts. Furthermore, it is widely accepted that the detrimental effects of climate change will be visited mostly on those countries least equipped to cope with it, socially or economically.


These and other areas of concern are covered in far more detail in the 36-page Summary for Policymakers from the IPCC AR6 Synthesis Report, released in March 2023. The report spells out in no uncertain terms the increasingly serious issues Mankind faces; the longer that meaningful action on climate is neglected, the greater the severity of impacts. The report is available for download here.


Last updated on 21 April 2023 by John Mason. View Archives

Printable Version  |  Offline PDF Version  |  Link to this page

Argument Feedback

Please use this form to let us know about suggested updates to this rebuttal.

Related Arguments

Further reading

National Geographic have an informative article listing the various positives and negatives of global warming for Greenland.

Climate Wizard is an interactive tool that lets you examine projected temperature and precipitation changes for any part of the world.

A good overview of the impacts of ocean acidification is found in Ken Caldeira's What Corals are Dying to Tell Us About CO2 and Ocean Acidification

Denial101x video

Here is a related video lecture from Denial101x - Making senses of climate science denial

Comments

Prev  1  2  3  4  5  6  7  8  9  10  11  12  13  14  15  16  17  Next

Comments 226 to 250 out of 419:

  1. mohyla103, please note that mspelto is a widely respected, practicing/publishing glaciologist who is kind enough to make himself available here at SkS from time to time. Some of the above links I gave you refer to his work. He is also the author of several posts here at SkS and at RealClimate.
  2. I see! So when a previous poster said that rain simply "runs off a glacier" this wasn't entirely true, and it's the drainage system within a glacier that can actually help prevent floods by slowing down the rate at which the rain can flow downhill. I guess this is what Tom Curtis was talking about. It makes a lot more sense now; thanks for the explanation mspelto! ====== A little aside here: While many may blindly accept the existence of AGW and accept any predictions of what the future holds for the planet simply because they hear about this in the mass media or pop culture, I cannot blindly accept it. This is not to say that I *will not* accept it, as has been implied here by at least one person. My position is simply that I won't accept something until I first see the evidence. Others telling me that there IS a mountain of evidence is still not going to sway me. I need to examine and try to understand it firsthand. That is why I am here on this site after all: to get deeper into the real evidence, all the while looking at it critically until I have a clear understanding of it one way or another. Skeptical Science really is an apt name for this website. As an analogy, many people believe aliens have visited Earth, but I'm not going to believe that just because others do, no matter what their number. The same applies to AGW and its predicted consequences. I'm not going to believe it simply because others do, no matter what their number. There is a difference though: there is actually a fairly solid scientific consensus on AGW and its consequences, as well as an abundance of published literature, so it is actually worth my time to go and exam the evidence. This seems like a reasonable position to me. I hope everyone on this board understands where I'm coming from now and if I ask any seemingly ignorant questions you will know my intentions are sincere. Thanks to those who have actually clarified things for me. You have not only helped me gain a deeper understanding, but the countless other "skeptical" visitors to this site who may be reading these posts.
  3. mohyla103: One out of twelve of the Apostles was a "Doubting Thomas." May the Force be with you.
  4. John Hartz ...and also with you. ;)
  5. Apologies for the delay in replying, mohyla103, but I have been working on something else and have only just gotten around to reading the relevant paper myself. Having done so, I believe you are once more focussing on details which are not as black-and-white as you seem to believe. Firstly, the fact that the relevant figure is 49.1% (i.e. the average snow and glacier-melt contribution to the annual flow of Chenab) over a 10 year period, suggests that the contribution is likely to have been over 50% during certain of those years. In fact, one of the graphs in the paper (showing mean monthly flow characteristics) showed how great were the deviations in monthly flow during the summer months. Also, that 49.1% contribution is concentrated in the four (mainly summer) months of June to October, so certain of those yearly rates can easily be over 50% at times during summer. Combine that with the 51.1% contribution to the yearly flow from the summer months, not all of which, of course, is due to glacier-melt but more than 50% of which could quite easily be due to glacier-melt during certain summer months of certain of the years of the study. Finally, you haven't taken account of two of the other figures in that study which showed seasonal (if I remember the term correctly) and permanent snow covered areas during March and September - again if I have remembered the correct months. During March the maximum coverage was roughly 80% but during September that that had dropped to roughly 20%. I can't believe that the amount of snow-melt would be a huge proportion of total snow/glacier-melt runoff anyway, but as the summer progresses the contribution from snow-melt would get less and less while the glacier-melt would at least remain constant but would actually probably increase. (See this abstract for further information). This means that glacier-melt would become a very large percentage of total snow/glacier-melt runoff so that, again, during certain years and certain summer months, glacier-melt would be "as much as...50-60%..." (You can see more about snow-covered areas in this study from 2001. So, to me, you have not shown that in fact your "reading of the original sources was correct and it was Barnett who was confused and/or did not report data accurately in his paper". You have made an unfair accusation for which you have not been able to provide clear evidence - you have read some abstracts and one paper, and then considered that you know more than Barnett and can accuse him of 'confusion' and 'inaccurate data-reporting'. You wrote that "[c]learing up misunderstandings is a good thing, be they my own or ones in published papers". I believe the misunderstanding is yours and not that of experienced scientists or the peer-review system. And, Barnett was NOT wrong (as far as I can see) to cite this paper as evidence, and the peer-review process did not miss any errors which you believe you have discovered. You should withdraw the accusations you have made, including the following : Considering the same kind of wording and figures appear in the abstracts of the other 2 papers cited by Barnett for this claim, I strongly suspect he and the reviewers committed the same error there.
  6. JMurphy, First, thank you for taking the time to continue the discussion. Unfortunately, the misunderstanding appears to be yours and I will explain it in detail below. See especially (2). 1. "…so certain of those yearly rates can easily be over 50% at times during summer." You mention yearly rates, during summer. This is a logical contradiction, please restate. If you're talking about something being over 50% in the summer, then you're not talking about a yearly rate, you're talking about a summer rate or summer amount. If you're talking about a yearly rate, then it's not just during summer and summer peaks are irrelevant as a yearly rate is, by definition, averaged over the year. I do agree that the percentage of meltwater in the river can be over 50% at times during the summer. Is this what you meant to say? That may be true, but remember that this still refers to all meltwater, and we have no specific figure about glacial water to go by. In addition, please note Barnett cites "flow" for the Chenab not "summer flow" as you're talking about. 2. "Also, that 49.1% contribution is concentrated in the four (mainly summer) months of June to October….Combine that with the 51.1% contribution to the yearly flow from the summer months, not all of which, of course, is due to glacial melt…" You're comparing apples and oranges here once again. Take a closer look at what these numbers represent. 49.1% refers to an amount contributed yearly by a source without mention of seasonal breakdown, whereas 51.1% refers to a fraction of yearly flow during one season without mention of flow source composition. There simply is no way to accurately "combine" these 2 sets of data to interpolate a summer glacial melt fraction, as you have tried to do, as their domains and ranges (?) are different. The data sets are, in fact, almost entirely independent of one another. Theoretically speaking, I could "combine" these two figures and get a percentage of meltwater in the summer river flow that is anywhere from 0.4% up to 96%! (I can show you the calculations if you so desire) Of course there are constraints due to known trends in timing of precipitation, but no definite numbers are presented. With a possible range like this, how you or Barnett could reliably determine not only how much of the summer flow is specifically from meltwater but also how much of that meltwater is specifically from glaciers is totally beyond me. We don't know how the 49.1% meltwater total breaks down season by season (let alone how it breaks down to glacial melt vs. snow melt within each season), as it is a yearly average. We only know trends. The seasonal values presented in the graph and table refer to total flow, not specifically to meltwater so are not helpful here. We also don't know how the 51.1% summer flow total breaks down source by source, i.e. how much of the 51.1% is from rain and how much is from meltwater. We know even less how the meltwater portion of 51.1 breaks down into snow vs. glacial. Only if we knew all of these things could we actually put a figure on the glacial melt contribution in the summer. For Barnett to concoct a figure for glacial melt like 50-60% when it's not present in the source is not very scientific and I don't believe he did this. Your point about variability from year to year is well taken! However, there is simply no way to assign a number, or even range of numbers, for meltwater percentage in exceptionally wet summers, at least according to this paper. It's even more ridiculous to try to put a figure on glacial melt alone during these periods, when the total meltwater amount isn't even known. 3. "…but more than 50% of which could quite easily be due to glacier-melt during certain summer months of certain of the years of the study." You said "50% of which" in the above sentence. When I look back I see the referent of "which" is the 51% contribution to the yearly flow from the summer months. So what you meant is: …but more than 50% of the 51% contribution to the yearly flow from the summer months could quite easily be due to glacier-melt during certain summer months of certain of the years of the study. Doing the math, this means: …more than 25.55% of the yearly flow from the summer months could quite easily be due to glacier-melt during certain summer months of certain of the years of the study. Even if you can back up your use of 50% (?), how does 25.55% from glacier-melt support Barnett's figures? This statement of 50% of 51.1% does not support your argument at all. Perhaps this arises from a misreading of the 51% contribution to the yearly flow from the summer months as the 51% contribution to the yearly flow from summer meltwater? Once again, this paper did not present any figures about glacial melt alone, so it would take me quite a leap of faith to believe that Barnett somehow deduced them out of thin air with enough certainty to publish them. You're piling presumptions upon educated guesses here trying to explain where Barnett could come up with 50-60% but I don't see the evidence in the source anywhere for these particular figures. You've also misunderstood and/or misused the 49.1% and 51.1% figures in the source while making your educated guesses, as explained above in (2). The simplest explanation is that Barnett simply took the figure 49% for glacier and snowpack melt, rounded up to 50% and mistakenly cited glacial melt instead of glacier and snow melt. It seems he made the mistake of just dropping one word: snow. This is supported by the fact that in the abstract for his article, he actually does mention snowpack and glaciers together, and it's only in the sentence citing 50-60% that he seems to have forgotten to mention snow. 4. "and then considered that you know more than Barnett" Nope, never said that, don't claim that. I'm sure Barnett's knowledge of this field is vastly superior to mine, but when we're talking about something as simple and limited in scope as checking a source and reading a plain English explanation of the figures, I do feel I'm on equal footing with Barnett and have the right to point out mistakes. But since when does pointing out someone's mistake mean that you think you know more than them? It just means you're observant enough to have noticed a mistake. I don't believe Barnett did this intentionally. 5. I will not withdraw: "Considering the same kind of wording and figures appear in the abstracts of the other 2 papers cited by Barnett for this claim, I strongly suspect he and the reviewers committed the same error there." The reason is that this is not an "accusation" as you said, but a suspicion, and I worded it as such. A suspicion is unproven, but may be something worth looking into. It is a suggestion to others that the sources might be worth double-checking. 6. Your point about the little remaining snow cover is well taken, and it's true that the ratio of glacier melt to snow melt would increase throughout the summer. However, since no figure was given in the paper about this, further discussion of this point will be fruitless with respect to the Barnett paper.
  7. mohyla103, we're going round in circles here and I admit to not making myself very clear in my last response - but you definitely have misread what I was trying to get across. Therefore, to make things as simple as possible, your claims of "misleading", "inaccurate", "misrepresentation of data", "sloppy use", "WRONG", "he definitely misrepresented data", "peer review completely missed the error", "proven to be wrong", "proves Barnett misrepresented the data" have yet to be proven because the average 49.1% you are basing all your claims on is just that - an average. Any of the ten years comprising that average may well have had snow- and glacier-melt contributions of over 50%. As well as that, certain periods may well have seen those contributions comprised totally of glacier-melt. Anyone who wanted to claim, therefore, what Barnett claimed, would need to have knowledge of the details of that 10-year study, as well as knowledge of snow- and glacier-melt in general. I have neither of those - do you ? If you don't, your claims are based on an average figure from one paper (which itself has references relating to snow- and glacier-melt, e.g. Hydrological characteristics of a Himalayan glacier and problems associated with discharge measurements in the glacier melt streams - Hydrology, 16: 30-51) and one average figure; whereas I reckon Barnett's claim is based on that paper (as well as its references), and his own knowledge of such studies. I also reckon that the peer-review system is sturdy and capable of making decisions as to which papers are substantiated and worthy of publication, and which aren't or which need further clarification. In the end, I don't have the time or resources to check every claim and rely on the science and scientists of each discipline to produce credible and reliable work. Even if that means accepting 49.1% as meaning the same as "as much as 50%", so be it. Obsession about words and extreme details are not my cup of tea. In fact, if you feel so certain about your claims, why not email him and let him know your feelings ? What have you got to lose ? timdotbarnett@ucsd.edu
  8. "Even if that means accepting 49.1% as meaning the same as "as much as 50%", so be it." I can accept that, too, of course. The point was the missing word "snow". You raise an excellent point, though, sources within sources. As that was original research and measurement data being reported, and there was no discussion about snow vs. glacial melt, I hadn't thought of checking further sources regarding the snow vs. glacial melt amounts, but perhaps it is in there somewhere. Then again, probably not or it would have been discussed in the original paper. I will try digging deeper into the other sources and will indeed contact Barnett if still nothing turns up to support his statement. I don't expect an answer but as you say, I've got nothing to lose. Thanks for the discussion. I believe we've come as far as we can on this one.
  9. Agreed, and I look forward to any further information you may be able to obtain, particularly from Barnett.
  10. Allow me to revisit the following statement in this article: "Spread in mosquite-borne diseases such as Malaria and Dengue Fever (Epstein 1998)" Like just about everywhere else, malaria was endemic in Florida in the early 20th century. From Malaria in Florida (D. B. Lieux, The Florida Entomologist, Vol. 34, No. 4 (Dec., 1951), pp. 131-135), there was 1,895 cases in 1919. By 1949, thanks in great part to DDT, the US was declared malaria-free (CDC timeline). Florida has a tropical climate, is home to the world's largest swamp and remains largely malaria-free. If malaria is not currently spreading to balmy Florida, what is the basis for your claim that, as the climate warms, malaria will spread to areas that are currently malaria-free?
  11. 235, Manny, Perhaps its because we've only yet seen a fraction of the warming we're on course to invoke, and not yet enough to generate a sizable change in something like malaria. Perhaps, also, a major factor in the control of malaria is the elimination of swamps near populated areas, and the vast tracts of urbanized pavement that have replaced much of the swampland anywhere near populated areas. Too, as with any disease, it will thrive better in a population of weak, unhealthy, underfed victims -- hardly a description of today's Florida. What makes you think that if malaria were going to spread it would have done so by now, and if it hasn't, there's nothing to worry about?
  12. The primary controlling factor in the U.S. is "prompt diagnosis and treatment of infectious individuals" (from LINK) I find no reason to believe that this will change.
    Response: [RH] Fixed link that was breaking page format.
  13. Manny#235: "If malaria is not currently spreading to balmy Florida" This just in from balmy Jacksonville, Fla (2010): Duval County health officials issued an unusual warning Wednesday: Beware of malaria. Tests show that a 31-year-old Jacksonville woman has become infected with the typically tropical disease despite having no history of international travel, the health department announced. For the present, US wealth and infrastructure can control diseases that are normally found in tropical climates. Fast-forward to a time when tropical climates are more widespread and demands on under-funded public health services are overwhelming their capacities. What will you tell us then?
  14. New Research, showing decrease in fertility: "...Our findings imply that climate change affects aboveground–belowground interactions through changes in nutrient availability." Interactions between above- and belowground organisms modified in climate change experiments Stevnbak et al., Nature Climate Change(2012) doi:10.1038/nclimate1544
  15. One major positive benefit of increased atmospheric C02 concentration which has yet to be listed here is the enhanced efficiency of mitochondrial respiration that it would provide to animals via the Bohr effect. Because the Co2 to O2 ratio determines the hemoglobin's affinity for O2 and plays a major role in vasodilation/vasoconstriction (C02 is a vasodilator while 02 is a vasoconstrictor), increasing the ratio of Co2 to 02 significantly increases the distribution of 02 throughout the body, thus enhancing krebs cycle efficiency and general mitochondrial respiration. More atmospheric C02 is beneficial for plants (as has been described in this thread) and animals.
  16. AHuntington1 cen you give a verifiable source to support that hypothesis? I very much doubt rising atmospheric CO2 levels will have a significant direct effect on human health for the simple reason that most of us live in cities, or near places with large CO2 fluxes between the atmosphere and terrestrial biota, which swamp the effects of even large increases in background CO2 levels. I did a quick search myself and found: A proposed potential role for increasing atmospheric CO2 as a promoter of weight gain and obesity L-G Hersoug, A Sjödin, and A Astrup Human obesity has evolved into a global epidemic. Interestingly, a similar trend has been observed in many animal species, although diet composition, food availability and physical activity have essentially remained unchanged. This suggests a common factor—potentially an environmental factor affecting all species. Coinciding with the increase in obesity, atmospheric CO2 concentration has increased more than 40%. Furthermore, in modern societies, we spend more time indoors, where CO2 often reaches even higher concentrations. Increased CO2 concentration in inhaled air decreases the pH of blood, which in turn spills over to cerebrospinal fluids. Nerve cells in the hypothalamus that regulate appetite and wakefulness have been shown to be extremely sensitive to pH, doubling their activity if pH decreases by 0.1 units. We hypothesize that an increased acidic load from atmospheric CO2 may potentially lead to increased appetite and energy intake, and decreased energy expenditure, and thereby contribute to the current obesity epidemic. Note particularly the point about CO2 levels being higher indoors. Perhaps not so beneficial afterall.
  17. AHuntington1, your post lacks substantiation with published science articles. The adverse consequences of abrupt climate change and precipitations patterns disturbances likely dwarf any possible benefit from your alleged enhanced Krebs cycle. I am curious to see references for the "CO2 to O2 ratio dtermines the Hgb's affinity for O2" assertion. Links? Furthermore, as we have discussed on this thread the CO2 concentrations used in commercial greenhouses range between 800 and 1200 ppm, far beyond even pre-industrial level doubling, and with all other factors controlled and optimized. Truly nothing like the real world, these greenhouses...
  18. The paper to which Dikran refers is available (refreshingly, for free) online here.
  19. Composer99 It is indeed nice to see a paper not behind a paywall for once! However, I'm rather skeptical about this paper; as I said I very much doubt the CO2 levels have risen in cities as fast as the background level has been rising, and there are many more obvious explanations for obesity in the first world, such as sedentary lifestyles with little physical exertion - I am giving a good example of that right now by sitting on a sofa typing on a computer, rather than going to the gym. Similarly, I'd be very surprised if atmospheric CO2 levels were having a significant, or even measurable, effect on metabolism, and even if it were it is not a given that an increasing metabolic rate is necessarily a good thing as far as long term health is concerned. Essentially I think this is a fine example of "clutching at straws", but I'd be happy to be proven wrong.
  20. Dikran Marsupial, it is extremely important not to confuse correlation and causation. There are many other, significantly more pertinent factors at work when it comes to the development of obesity in animals. Increased environmental estrogen levels is one example (which would affect wild animals and humans more proportionately than Co2)there are many more. Fascinating study, btw. Although, considering all the other factors at work, it is doubtful that respiratory acidosis causing the firing rate of the orexigen neurons to increase is the major contributing factor to obesity, IMHO. Increased Co2 might also cause weight gain by increasing krebs cycle activity and thereby producing more energy per glucose. Or it could be through increased bone uptake of Co2 (co2 is converted to carbonic acid by the carbonic anhydrase enzyme, and can then can be converted to bicarbonate which is taken up by the bones)- higher bone density. Philippe Chantreau, I'm so used to talking with people who know about nutrition that I assumed people would know what the Bohr effect is- my bad. Here's the wiki: http://en.wikipedia.org/wiki/Bohr_effect you said " Truly nothing like the real world, these greenhouses... " Isn't a greenhouse an ideal example of the greenhouse effect? A controlled environment is the only way to study a single variable, like Co2. Controlled studies, in greenhouses are the only way to reliably study specific changes in atmospheric gasses. To quote Friedrich Miescher 1885, "Over the oxygen supply of the body carbon dioxide spreads its protecting wings."
  21. AHuntingdon1 I asked for a verifiable reference supporting the hypothesis you put forward. A peer-reviewed paper that shows that rising CO2 levels have a significant effect on metabolism in vivo would be fine. I suspect there isn't one, for the reasons I gave in my previous post.
  22. Dikran Marsupial, well I missed your last post; I'm glad we agree that the study published in the peer reviewed NCBI which you posted, and its hypothesis, are most likely wrong. You used logic to determine the validity of a study. Peer reviewed does not mean proven. Co2 levels absolutely influence the rate of oxidative respiration via the Bohr effect- this has been well established. When considering the reduced ratio of O2 to Co2 at higher elevations the "lactate paradox" (whereby people accustomed to high altitudes display higher levels of krebs cycle activity[make more ATP] during exercise) no longer is a paradox (evidence for Co2 increasing krebs activity). This study,http://www.ncbi.nlm.nih.gov/pubmed/7581542 implies Co2 as a potent antioxidant. This study shows Co2 protecting the organism from hypoxia. http://www.ncbi.nlm.nih.gov/pubmed/720676 Here's another interesting study. http://www.ncbi.nlm.nih.gov/pubmed/9139450 The positive attributes of Co2 on the organism have been well established. The fact that it is hard to find a peer reviewed study on the overall benefits of Co2 and the appropriate atmospheric concentration in which said benefits are maximized, reflects the mentality of most nutrition scientists more than the evidence. Again, Co2 is good for plants and animals.
  23. Readers, please note that AHuntington1 appears to be a master of both the Gish Gallop and the non sequitur. First, he impresses all with his ability to recite terms in respiratory biology, accompanied with a supercilious attitude ("Dikran Marsupial, it is extremely important not to confuse correlation and causation" and "I'm glad we agree that...") that gives no thought to the qualifications of the people with whom he is speaking. Second, he is able to compile a list of fairly inconsequential papers that show potential effects of elevated CO2 levels in rats, and projects this into the grand idea that increased CO2 levels in the atmosphere will have positive (and no negative) effects on all living creatures. These papers in no way make the case for his grandiose claim about "the enhanced efficiency of mitochondrial respiration that it would provide to animals via the Bohr effect." So he sets the goal post, then moves it, while with slight-of-hand appearing to support it. He hopes that you don't notice that (a) the papers do not reflect on his original proposition at all (b) they are impressive enough to convince you he is right, (c) they focus on very specific aspects of biology which may or may not have actual, real-life positive effects on the species studied and (d) they have little to do with elevated atmospheric carbon dioxide levels. He closes with the woefully simplistic (and wrong) statement that "Co2 is good for plants and animals" which is all he knows most (uncritical) readers will take away from the discussion.
  24. How much C02 is good for us? My car heater can keep me alive in winter. It does not follow that using my car heater in summer is even better for me. As to metabolic processes and C02, simply look up what's been established w/regard to concentrations of C02 in naval submarines and for that matter spacecraft. More does not equal better. In any case, remember: The "C02 is good for us" gambit is a frantic attempt to change the subject of conversation from geophysics to another only vaguely related topic. When nothing more can be done to evade the physical problem of global warming it's imperative to switch conversation to something else. You're seeing that happen right here.
  25. Sphaerica, the qualifications of of the people with whom I am communicating are less important than the information they present ( -snip-). Dikran mentioned that obesity rates and Co2 have been rising hand in hand, I pointed out that correlation does not equal causation and mentioned that there are a multitude of other potential contributory factors. As to your second point- the majority of time that organisms evolved on earth (especially during krebs cycle evolution, which was a very early adaptation), Co2 concentrations have been significantly higher than the present day. The fact that neither aerobic nor anaerobic bacteria can survive without Co2 highlights this fact. http://jmm.sgmjournals.org/content/13/4/573.abstract The idea that I cite random mouse studies unrelated to my point is simply wrong. Numerous studies have shown Co2 to be protective against acute hypoxia. I also wanted to point out that Co2 is potentially a potent antioxidant. The lactate paradox ceases to be a paradox when the ratio of Co2 to O2 is considered. It is also interesting that people who live in high altitudes (and are exposed to a higher Co2 to O2 ratio) experience lower mortality rates, in general. High altitudes provide a real life example of a population that breathes a higher Co2 to O2 ratio. http://en.wikipedia.org/wiki/Effects_of_high_altitude_on_humans#Long-term_effects These are factual benefits from increases in atmospheric Co2 concentration, and I'm simply asking for them to be included in the above list of pros and cons.
    Response: [DB] Inflammatory snipped.

Prev  1  2  3  4  5  6  7  8  9  10  11  12  13  14  15  16  17  Next

Post a Comment

Political, off-topic or ad hominem comments will be deleted. Comments Policy...

You need to be logged in to post a comment. Login via the left margin or if you're new, register here.

Link to this page


The Consensus Project Website

THE ESCALATOR

(free to republish)


© Copyright 2024 John Cook
Home | Translations | About Us | Privacy | Contact Us