Climate Science Glossary

Term Lookup

Enter a term in the search box to find its definition.

Settings

Use the controls in the far right panel to increase or decrease the number of terms automatically displayed (or to completely turn that feature off).

Term Lookup

Settings


All IPCC definitions taken from Climate Change 2007: The Physical Science Basis. Working Group I Contribution to the Fourth Assessment Report of the Intergovernmental Panel on Climate Change, Annex I, Glossary, pp. 941-954. Cambridge University Press.

Home Arguments Software Resources Comments The Consensus Project Translations About Support

Bluesky Facebook LinkedIn Mastodon MeWe

Twitter YouTube RSS Posts RSS Comments Email Subscribe


Climate's changed before
It's the sun
It's not bad
There is no consensus
It's cooling
Models are unreliable
Temp record is unreliable
Animals and plants can adapt
It hasn't warmed since 1998
Antarctica is gaining ice
View All Arguments...


Username
Password
New? Register here
Forgot your password?

Latest Posts

Archives

Sun & climate: moving in opposite directions

What the science says...

Select a level... Basic Intermediate Advanced

The sun's energy has decreased since the 1980s but the Earth keeps warming faster than before.

Climate Myth...

It's the sun

"Over the past few hundred years, there has been a steady increase in the numbers of sunspots, at the time when the Earth has been getting warmer. The data suggests solar activity is influencing the global climate causing the world to get warmer." (BBC)

At a glance

Thankfully for us, our Sun is a very average kind of star. That means it behaves stably over billions of years, steadily consuming its hydrogen fuel in the nuclear reaction that produces sunshine.

Solar stability, along with the Greenhouse Effect, combine to give our planet a habitable range of surface temperatures. In contrast, less stable stars can vary a lot in their radiation output. That lack of stability can prevent life, as we know it, from evolving on any planets that might orbit such stars.

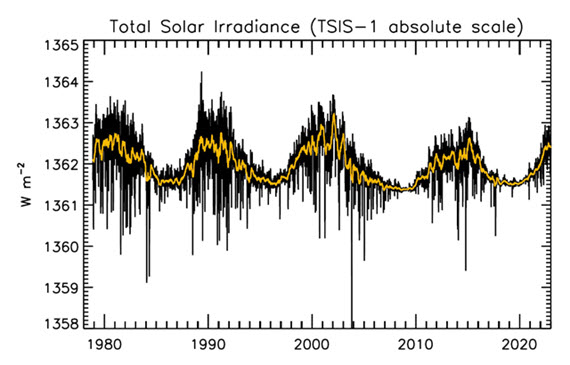
That the Sun is a stable type of star is clearly demonstrated by the amount of Solar energy reaching Earth's average orbital position: it varies very little at all. This quantity, called the Total Solar Irradiance, has been measured for around forty years with high accuracy by sensitive instruments aboard satellites. Its average value is 1,362 watts per square metre. Irradiance fluctuates by about a watt either way, depending on where we are within the 11-year long sunspot cycle. That's a variation of no more than 0.15%.

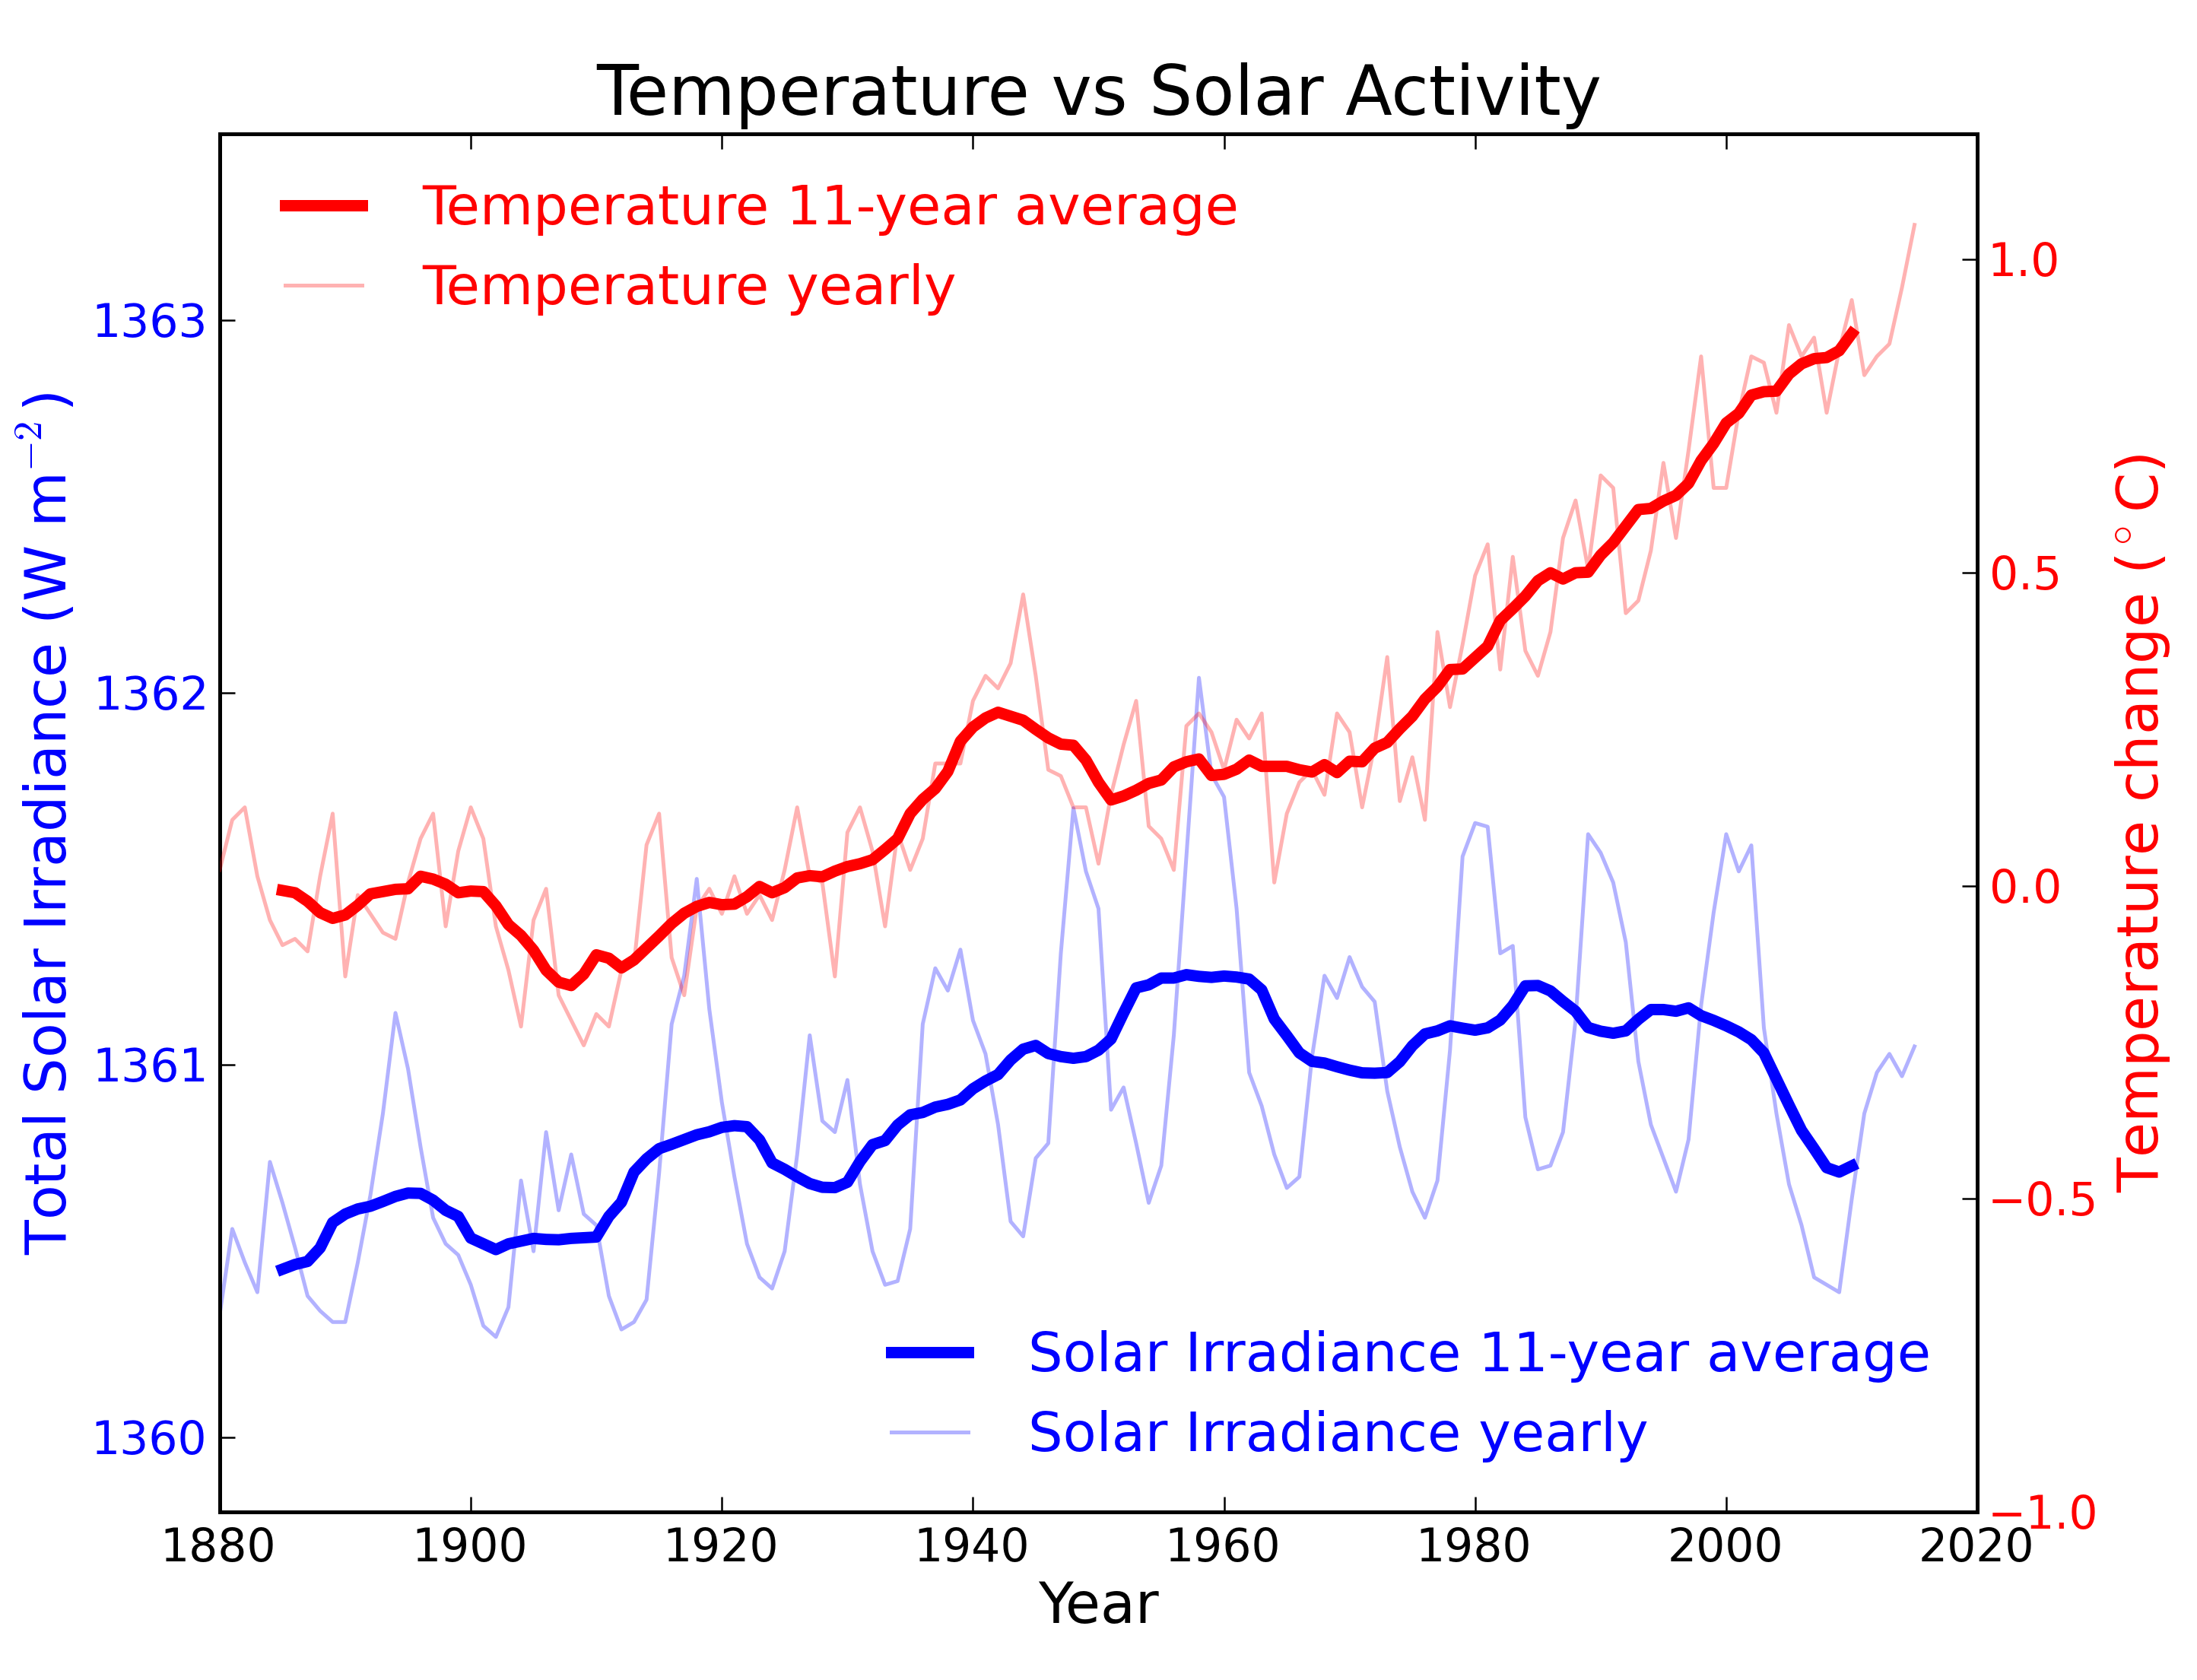
From the early 1970s until today, the Solar radiation reaching the top of Earth's atmosphere has in fact shown a very slight decline. Through that same period, global temperatures have continued to increase. The two data records, incoming Solar energy and global temperature, have diverged. That means they have gone in opposite directions. If incoming Solar energy has decreased while the Earth continues to warm up, the Sun cannot be the control-knob of that warming.

Attempts to blame the sun for the rise in global temperatures have had to involve taking the data but selecting only the time periods that support such an argument. The remaining parts of the information - showing that divergence - have had to be ditched. Proper science study requires that all the available data be considered, not just a part of it. This particular sin is known as “cherry-picking”.

Please use this form to provide feedback about this new "At a glance" section, which was updated on May 27, 2023 to improve its readability. Read a more technical version below or dig deeper via the tabs above!


Further details

Our Sun is an average-sized main sequence star that is steadily using its hydrogen fuel, situated some 150 million kilometres away from Earth. That distance was first determined (with a small error) by a time consuming and complex set of measurements in the late 1700s. It led to the first systemic considerations of Earth's climate by Joseph Fourier in the 1820s. Fourier's number-crunching led him to realise a planet of Earth's size situated that far from the Sun ought to be significantly colder than it was. He was thereby laying the foundation stone for the line of enquiry that led after a few decades to the discovery of what we now call the Greenhouse Effect – and the way that effect changes in intensity as a response to rising or falling levels of the various greenhouse gases.
TSI Solar cycles

Figure 1: Plot of the observational record (1979-2022) on the scale of the TSIS-1 instrument currently flying on the space station. In this plot, the different records are all cross calibrated to the TSIS-1 absolute scale (e.g., the TSIS1-absolute scale is 0.858 W/m^2 higher than the SORCE absolute scale) so the variability of TSI in this plot is considered to be its “true variability” (within cross calibration uncertainties). Image: Judith Lean.

The Sun has a strong magnetic field, but one that is constantly on the move, to the extent that around every 11 years or so, Solar polarity flips: north becomes south, until another 11 years has passed when it flips back again. These Solar Cycles affect what happens at the surface of the Sun, such as the sunspots caused by those magnetic fields. Each cycle starts at Solar Minimum with very few or no sunspots, then rises mid-cycle towards Solar Maximum, where sunspots are numerous, before falling back towards the end. The total radiation emitted by the Sun – total solar irradiance (TSI) is the technical term – essentially defined as the solar flux at the Earth's orbital radius, fluctuates through this 11-year cycle by up to 0.15% between maximum and minimum.

Such short term and small fluctuations in TSI do not have a strong long term influence on Earth's climate: they are not large enough and as it's a cycle, they essentially cancel one another out. Over the longer term, more sustained changes in TSI over centuries are more important. This is why such information is included, along with other natural and human-driven influences, when running climate models, to ask them, “what if?"

An examination of the past 1150 years found temperatures to have closely matched solar activity for much of that time (Usoskin et al. 2005). But also for much of that time, greenhouse gas concentrations hardly varied at all. This led the study to conclude, "...so that at least this most recent warming episode must have another source."
TSI vs. T
Figure 2: Annual global temperature change (thin light red) with 11 year moving average of temperature (thick dark red). Temperature from NASA GISS. Annual Total Solar Irradiance (thin light blue) with 11 year moving average of TSI (thick dark blue). TSI from 1880 to 1978 from Krivova et al. 2007. TSI from 1979 to 2015 from the World Radiation Center (see their PMOD index page for data updates). Plots of the most recent solar irradiance can be found at the Laboratory for Atmospheric and Space Physics LISIRD site.

The slight decline in Solar activity after 1975 was picked up through a number of independent measurements, so is definitely real. Over the last 45 years of global warming, Solar activity and global temperature have therefore been steadily diverging. In fact, an analysis of solar trends concluded that the sun has actually contributed a slight cooling influence into the mix that has driven global temperature through recent decades (Lockwood, 2008), but the massive increase in carbon-based greenhouse gases is the main forcing agent at present.

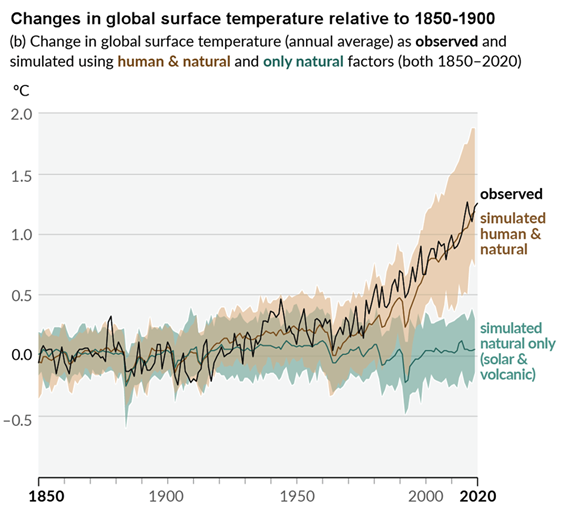
Other studies tend to agree. Foster & Rahmstorf (2011) used multiple linear regression to quantify and remove the effects of the El Niño Southern Oscillation (ENSO) and solar and volcanic activity from the surface and lower troposphere temperature data.  They found that from 1979 to 2010, solar activity had a very slight cooling effect of between -0.014 and -0.023°C per decade, depending on the data set. A more recent graphic, from the IPCC AR6, shows these trends to have continued.

AR6 WGI SPM Figure 1 Panel p

Figure 3: Figure SPM.1 (IPCC AR6 WGI SPM) - History of global temperature change and causes of recent warming panel (b). Changes in global surface temperature over the past 170 years (black line) relative to 1850–1900 and annually averaged, compared to Coupled Model Intercomparison Project Phase 6 (CMIP6) climate model simulations (see Box SPM.1) of the temperature response to both human and natural drivers (brown) and to only natural drivers (solar and volcanic activity, green). For the full image and caption please click here or on the image.

Like Foster & Rahmstorf, Lean & Rind (2008) performed a multiple linear regression on the temperature data, and found that while solar activity can account for about 11% of the global warming from 1889 to 2006, it can only account for 1.6% of the warming from 1955 to 2005, and had a slight cooling effect (-0.004°C per decade) from 1979 to 2005.

Finally, physics does not support the claim that changes in TSI drive current climate change. If that claim had any credence, we would not expect to see the current situation, in which Earth's lower atmosphere is warming strongly whereas the upper atmosphere is cooling. That is exactly the pattern predicted by physics, in our situation where we have overloaded Earth's atmosphere with greenhouse gases. If warming was solely down to the Sun, we would expect the opposite pattern. In fact, the only way to propagate this myth nowadays involves cherry-picking everything prior to 1975 and completely disregarding all the more recent data. That's simply not science.

Longer-term variations in TSI received by Earth

It's also important to mention variations in TSI driven not by Solar energy output but by variations in Earth's orbit, that are of course independent of Solar activity. Such variations, however, take place over very long periods, described by the Milankovitch orbital cycles operating over tens of thousands of years. Those cycles determine the distance between Earth and the Sun at perihelion and aphelion and in addition the tilt the planet's axis of rotation: both affect how much heat-radiation the planet receives at the top of its atmosphere through time. But such fluctuations are nothing like the rapid changes we see in the weather, such as the difference between a sunny day and a cloudy one. The long time-factor ensures that.

Another even more obscure approach used to claim, "it's the sun" was (and probably still is in some quarters) to talk about, "indirect effects". To wit, when studies can't find a sufficiently large direct effect, bring even lesser factors to the fore, such as cosmic rays. Fail.

In conclusion, the recent, post 1975 steep rise in global temperatures are not reflected in TSI changes that have in fact exerted a slight cooling influence. Milankovitch cycles that operate over vastly bigger time-scales simply don't work quickly enough to change climate drastically over a few decades. Instead, the enormous rise in greenhouse gas concentrations over the same period is the primary forcing-agent. The physics predicted what is now being observed.

Last updated on 27 May 2023 by John Mason. View Archives

Printable Version  |  Offline PDF Version  |  Link to this page

Argument Feedback

Please use this form to let us know about suggested updates to this rebuttal.

Related Arguments

Further viewing

Related video from Peter Sinclair's "Climate Denial Crock of the Week" series:

Further viewing

This video created by Andy Redwood in May 2020 is an interesting and creative interpretation of this rebuttal:

Myth Deconstruction

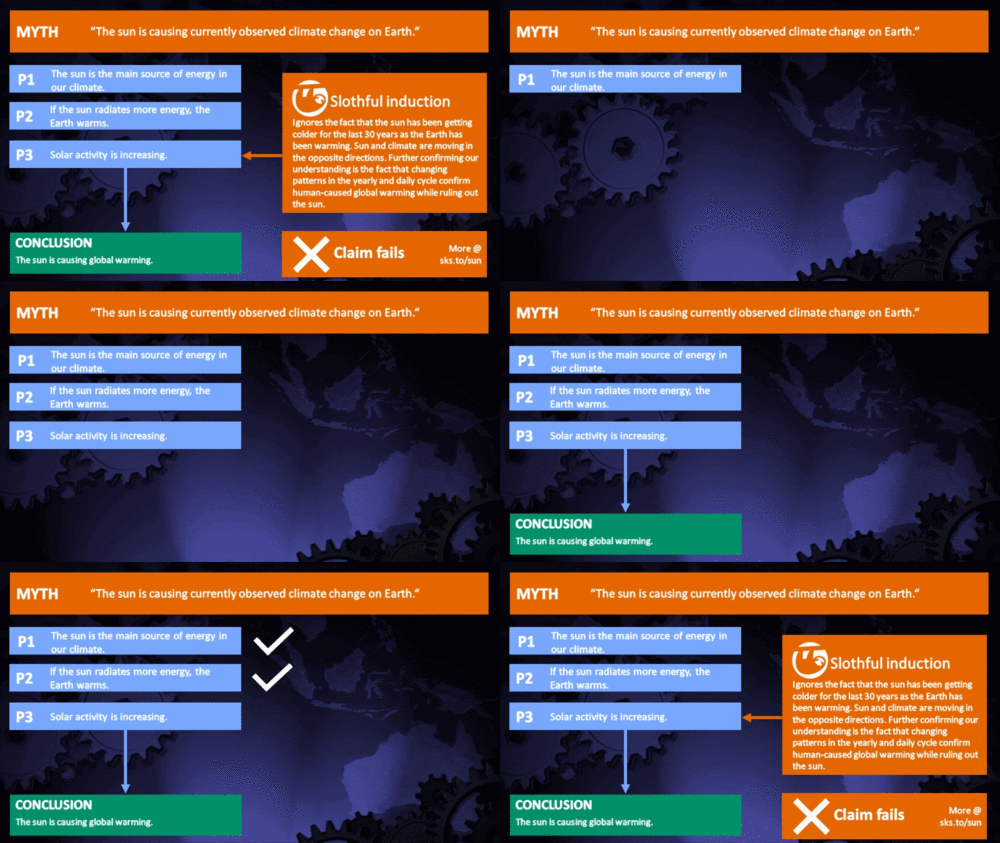
Related resource: Myth Deconstruction as animated GIF

MD Sun

Please check the related blog post for background information about this graphics resource.

Denial101x videos

Related lecture-videos from Denial101x - Making Sense of Climate Science Denial

and

Additional video from the MOOC

Expert interview with Mike Lockwood

Comments

Prev  12  13  14  15  16  17  18  19  20  21  22  23  24  25  26  27  28  29  30  31  Next

Comments 526 to 550 out of 1304:

  1. Dan, I take it then that you are the author?
  2. Since sunspot activity is observed for numbers, energy and radiation charistics a complete thermal balance with the earth is a very difficult if not impossible task. I believe that the oceans with their tremendous heat capacity are the key to the earths global temperature. The sunspot numbers count could be used as an indication of the sun's variation from a nominal output. I plotted an a weiighted sunspot number vs time from 1770 to the present. The average sunspot was developed using weighting factors of .4, .3, .2 and .1 for the periods of 0-10, 10-20, 20-30 and 30-40 years before the date of the data point. The resulting plot is consistant with observed long term temperature trends. It would predict the rapid temperature increase of the past century.
  3. Cliff Oates, can you attribute any physical meaning to your linear weighting function? It looks a bit arbitrary.
  4. It is arbitrary. I looked a little at other averaging methods. The general shape of the sunspot averaging results are similar. All show that an increase in global temperatures would be expected after 1920. I believe that the overall time period is of the order of 40 or more years. Other weighting factors may be more appropriate, but I don't know how to determine them. This approach is only for long term temperature studies. Short term temperature responses will neccessarily scatter around the longer trends. Since the Little Ice Age was likly the result of the lack of sunspot activity this shows that solar activity should not be ignored even though direct quantification cannot be derived. Is there any real reason to believe that greenhouse gasses are any more responsible for global temperatures than solar activity?
    Response: Is there any real reason to believe that greenhouse gasses are any more responsible for global temperatures than solar activity?

    This question is answered in The empirical evidence for an enhanced greenhouse effect. Just to clarify, greenhouse gases aren't the sole driver of climate but over the last few decades, the forcing from CO2 have been greater than any other climate forcing (as well as the fastest rising).
  5. In answer to response. There is nothing to show that greenhouse gasses caused global warming except that co2 has increased concurrently with the warming. The increase in sunspot numbers during the same period could have been totally responsible. Greenhouse gasses are an over simplified solution to a complex climate phenomenon and again seems to ignore the effects of the oceans interaction.
    Response: There is nothing to show that greenhouse gasses caused global warming

    I suggest you read through the empirical evidence for an enhanced greenhouse effect. Satellites find less infrared radiation escaping at CO2 wavelengths. Surface measurements find more infrared radiation returning back to Earth at CO2 wavelengths. This is experimental evidence for a direct causal link between increased CO2 and a build-up of heat in our climate.

    I also suggest you read the article above. Sunspot numbers have shown a long term declining trend during the last few decades of global warming.
  6. Sunspot numbers averaged 45.8 from 1749 to 1920. they averaged 72.7 from 1920 to October 2009. This is an increase of 59 percent. If the Maunder Minimum from 1640 to 1710 was somewhat responsible for the Little Ice Age, this increase cannot be ignored.
  7. Cliff Oates, indeed no one ignores it and we are grateful to the sun for pulling us out of the LIA. And we are also grateful for not increasing activity from the '50s at least up to now, it could have been worse.
  8. This is the first time in my life that i see the IPCC accused of over-emphasizing the role of the sun. Never say never, indeed.
  9. Total Solar radiation has had a large effect on climate chane based on the scientifc article below: Combine the information below with the closing of the ozone hole in the past 20 years and that in itself could explain all of the global warming from the past 25 years. Phenomenological solar contribution to the 1900–2000 global surface warming http://www.agu.org/pubs/crossref/2006/2005GL025539.shtml We study the role of solar forcing on global surface temperature during four periods of the industrial era (1900–2000, 1900–1950, 1950–2000 and 1980–2000) by using a sun-climate coupling model based on four scale-dependent empirical climate sensitive parameters to solar variations. We use two alternative total solar irradiance satellite composites, ACRIM and PMOD, and a total solar irradiance proxy reconstruction. We estimate that the sun contributed as much as 45–50% of the 1900–2000 global warming, and 25–35% of the 1980–2000 global warming. These results, while confirming that anthropogenic-added climate forcing might have progressively played a dominant role in climate change during the last century, also suggest that the solar impact on climate change during the same period is significantly stronger than what some theoretical models have predicted.
  10. More data on total slar irradiation. The graph in the link shows the irradiation has been quite a bit higher in the last decade. http://www.ngdc.noaa.gov/stp/SOLAR/IRRADIANCE/irrad.html Total solar irradiance describes the radiant energy emitted by the sun over all wavelengths that falls each second on 1 square meter outside the earth's atmosphere--a quantity proportional to the "solar constant" observed earlier in this century. It measures the solar energy flux in Watts/square meter. The data contains six sets of satellite observations: values from NIMBUS-7, from the Solar Maximum Mission (SMM) spacecraft, from the Earth Radiation Budget Satellite (ERBS), from the NOAA-9 and 10 platforms, and from the Upper Atmospheric Research Satellite (UARS). Measurements span the periods: NIMBUS-7 16 Nov 78-13 Dec 93; SMM 16 Feb 80-01 Jun 89; ERBS 25 Oct 84-21 Dec 94; NOAA-9 23 Jan 85-20 Dec 89; NOAA-10 22 Oct 86-01 Apr 87; UARS 5 Oct 91-30 Sep 94. -------------------------------------------------------------------------------- To get to our FTP archive of solar irradiance data, click here. For more information on the various satellies, click on the appropriate hypertext link: NIMBUS-7 UARS/ACRIM II ERBS go to Solar Data Services Home
  11. neerndt, "the irradiation has been quite a bit higher in the last decade." do you mean the solar maximum of the well known 11 years cycle? We're now at a solar minimum, a quite prolonged one indeed. But it does not look like it's going to impact the actual trend that much.
  12. Another link between the sun and earth climate broken. It's the old Scafetta et al. 2003 hypothesis of a link between solar flares or other sun related fluctuations (e.g. Scafetta et al. 2004 and West et al. 2008) and temperature variability. In a new paper Rypdal et al. found that the claimed "complexity linking" is due to a faulty analysis and that proper tests show that the opposite is true: "These results suggest that the stochastic properties of the global temperature record is governed by the long-memory internal dynamics of the climate system and are not linked to the short-memory intermittent fluctuations which characterize the solar output." In a interview reported by physorg.com Rypdal adds: "A corresponding theory of global warming of solar origin does not exist. What does exist is a set of disconnected, mutually inconsistent, ad hoc hypotheses. If one of these is proven to be false, the typical proponent of solar warming will pull another ad hoc hypothesis out of the hat. This has been the strategy of Scafetta and West over the years, and we have no illusion that our paper will put them to silence" Quite a strong statement, I'd say.
  13. Isn't it possible that the Sun is causing an increase in temperature of the core of the earth by way of radiation that passes harmlessly through the atmosphere and crust much like a microwave oven? Or is this just impossible? thanks
  14. Friend, the microwave power emitted by the sun is many orders of magnitude lower the the IR or visible emission. I'd not expect any significant effect.
  15. Basic question- This topic addresses a skeptic's argument that sunspots have been increasing. The scientific rebuttal says the sun is cooling. Does sunspot activity = sun's temperature as the rebuttal implies?
    Response: "Does sunspot activity = sun's temperature as the rebuttal implies?"

    There's more to it than that. Solar activity is measured by more than just sunspots - we directly measure solar output using satellites. When the various satellite records are stitched together, they find a slight cooling trend over the satellite record. However, direct measurements only go back to 1978.

    So we use proxies to go further back. Sunspots go back to the early 1600s and are a good proxy for solar output. We can confirm this by comparing them to the direct satellite measurements when the two records overlap.

    Here's more info on how we measure solar activity...
  16. Thanks.. I clicked on the link. It was a little more difficult for me to undestand- lots of acronyms. But I will try. It talks about TSI (Total Solar Irradiance) and a debate over how to measure it. I tried to gleen sunspot info from it. It appears to use sunspot activity to reconstruct TSI. TSI corrolates to sunspots. The argument is complicated for me- trying to focus on sunspot activity, the skeptic claim is that it is increasing. The science response says it is decreasing. (confirmed by corrolating TSI in the other link) Is that correct- sunspot activity is decreasing?
  17. JSFarmer, look yourself. The picture is from a NASA site.
  18. Thanks for the link... It appears to confirm both the skeptics' argument and the science rebuttal. Is that correct?
  19. JSFarmer, yes if you you exclude the last half century. Problem is that no one says that the sun is irrelevant in general, scientists say it's not the only one. This is expecially true in the last fifty years, being the TSI flat or even slightly declining.
  20. Thanks, I appreciate that there are many factors. I am trying to focus though, since its a complicated subject for me. I am trying to examine Skeptics' #1 argument, sunspots- that the sunspots are increasing, and the Science rebuttal that they are decreasing. Can you elaborate on your statement that the Skeptics' sunpot claim is true only if you exclude the last half century? The chart you provided is more of a visual representation so I'm not sure how to interpret it. The lows in the chart seem pretty consistant- seems to hit 0 every decade like clockwork. The vaiations seem to come in the highs. If I break it down into roughly half century segments (segments of 5 highs each), I get this for the highs: years abt 200 abt 150 abt 100 abt 50 1960 - now 3 2 1905 - 1950 1 2 2 1850 - 1895 2 3 1790 - 1840 2 2 1 The last half century is the highest when eyeballing the highs. Can you be more specific on the decline for me? Is the decline hidden somewhere in middle of these cycles?
  21. JSFarmer, the last 50 years are indeed the highest of the last centuries. What I meant is that during the last half century sun's activity has been flat or declining.
  22. OK, got it... Thanks!
  23. Lockwood exhibits his bias in the context paragraph that precedes his scientific paper: "But there is a crucial difference about the climate change debate compared with many of its predecessors: humankind could often afford to wait for previous controversies to abate ... There is evidence ... that time for effective action is extremely short (Kriegler et al. 2009; Vaughan et al. 2009)." This type of unnecessary polemic is unscientific, and leads the reader to conclude that Lockwood is grinding a political axe -- not furthering any scientific understanding. Indeed, all evidence indicates warmer temperatures and higher levels of CO2 are beneficial, not harmful. So what is the purpose of Lockwood's context, if not to scare people into failing to use their objectivity when forming conclusions about anthropogenic global warming?
  24. Johno, I believe you're referring to Lockwood 2010, rather than any of the papers actually cited in this thread, right? But in any case, which part of the quotation do you disagree with? The first part of the quote just says that in past scientific controversies (e.g., geocentrism vs. heliocentrism) there was no particular urgency that necessitated action. There's no citation, but it seems fairly straightforward. If the "skeptics" of the time had the effect of slowing acceptance of the Copernican Revolution, there was no palpable consequence other than a slight retardation of scientific progress. The second part of your quote merely points out that in the case of global climate change, there is evidence that there will be more severe consequences for delay. Lockwood provides two citations to peer-reviewed papers that justify this claim. I don't read that as a "polemic" at all. Your final paragraph seems a bit problematic, though. You write all evidence indicates warmer temperatures and higher levels of CO2 are beneficial, not harmful. You must not be very familiar with the evidence -- perhaps you should spend more time exploring this site? Here is a good page to start with: Peer reviewed impacts of global warming. "Beneficial" and "harmful" are value judgments, and are only relevant within particular frames of reference. However, some impacts (e.g., amplification of the hydrologic cycle leading to increases in both drought and flooding) are likely to be economically and socially harmful more or less across the board.
  25. That said, thank you for pointing out Lockwood 2010, which is newer than the papers cited in this thread and which might be of interest to many readers.

Prev  12  13  14  15  16  17  18  19  20  21  22  23  24  25  26  27  28  29  30  31  Next

Post a Comment

Political, off-topic or ad hominem comments will be deleted. Comments Policy...

You need to be logged in to post a comment. Login via the left margin or if you're new, register here.

Link to this page


The Consensus Project Website

THE ESCALATOR

(free to republish)


© Copyright 2024 John Cook
Home | Translations | About Us | Privacy | Contact Us