


 Arguments


How reliable are climate models?
What the science says...
| Select a level... |
 Basic
Basic
|
 Intermediate
| |||
|
Models successfully reproduce temperatures since 1900 globally, by land, in the air and the ocean. |
|||||
Climate Myth...
Models are unreliable
"[Models] are full of fudge factors that are fitted to the existing climate, so the models more or less agree with the observed data. But there is no reason to believe that the same fudge factors would give the right behaviour in a world with different chemistry, for example in a world with increased CO2 in the atmosphere." (Freeman Dyson)
At a glance
So, what are computer models? Computer modelling is the simulation and study of complex physical systems using mathematics and computer science. Models can be used to explore the effects of changes to any or all of the system components. Such techniques have a wide range of applications. For example, engineering makes a lot of use of computer models, from aircraft design to dam construction and everything in between. Many aspects of our modern lives depend, one way and another, on computer modelling. If you don't trust computer models but like flying, you might want to think about that.
Computer models can be as simple or as complicated as required. It depends on what part of a system you're looking at and its complexity. A simple model might consist of a few equations on a spreadsheet. Complex models, on the other hand, can run to millions of lines of code. Designing them involves intensive collaboration between multiple specialist scientists, mathematicians and top-end coders working as a team.
Modelling of the planet's climate system dates back to the late 1960s. Climate modelling involves incorporating all the equations that describe the interactions between all the components of our climate system. Climate modelling is especially maths-heavy, requiring phenomenal computer power to run vast numbers of equations at the same time.
Climate models are designed to estimate trends rather than events. For example, a fairly simple climate model can readily tell you it will be colder in winter. However, it can’t tell you what the temperature will be on a specific day – that’s weather forecasting. Weather forecast-models rarely extend to even a fortnight ahead. Big difference. Climate trends deal with things such as temperature or sea-level changes, over multiple decades. Trends are important because they eliminate or 'smooth out' single events that may be extreme but uncommon. In other words, trends tell you which way the system's heading.
All climate models must be tested to find out if they work before they are deployed. That can be done by using the past. We know what happened back then either because we made observations or since evidence is preserved in the geological record. If a model can correctly simulate trends from a starting point somewhere in the past through to the present day, it has passed that test. We can therefore expect it to simulate what might happen in the future. And that's exactly what has happened. From early on, climate models predicted future global warming. Multiple lines of hard physical evidence now confirm the prediction was correct.
Finally, all models, weather or climate, have uncertainties associated with them. This doesn't mean scientists don't know anything - far from it. If you work in science, uncertainty is an everyday word and is to be expected. Sources of uncertainty can be identified, isolated and worked upon. As a consequence, a model's performance improves. In this way, science is a self-correcting process over time. This is quite different from climate science denial, whose practitioners speak confidently and with certainty about something they do not work on day in and day out. They don't need to fully understand the topic, since spreading confusion and doubt is their task.
Climate models are not perfect. Nothing is. But they are phenomenally useful.
Please use this form to provide feedback about this new "At a glance" section. Read a more technical version below or dig deeper via the tabs above!
Further details
Climate models are mathematical representations of the interactions between the atmosphere, oceans, land surface, ice – and the sun. This is clearly a very complex task, so models are built to estimate trends rather than events. For example, a climate model can tell you it will be cold in winter, but it can’t tell you what the temperature will be on a specific day – that’s weather forecasting. Climate trends are weather, averaged out over time - usually 30 years. Trends are important because they eliminate - or "smooth out" - single events that may be extreme, but quite rare.
Climate models have to be tested to find out if they work. We can’t wait for 30 years to see if a model is any good or not; models are tested against the past, against what we know happened. If a model can correctly predict trends from a starting point somewhere in the past, we could expect it to predict with reasonable certainty what might happen in the future.
So all models are first tested in a process called Hindcasting. The models used to predict future global warming can accurately map past climate changes. If they get the past right, there is no reason to think their predictions would be wrong. Testing models against the existing instrumental record suggested CO2 must cause global warming, because the models could not simulate what had already happened unless the extra CO2 was added to the model. All other known forcings are adequate in explaining temperature variations prior to the rise in temperature over the last thirty years, while none of them are capable of explaining the rise in the past thirty years. CO2 does explain that rise, and explains it completely without any need for additional, as yet unknown forcings.
Where models have been running for sufficient time, they have also been shown to make accurate predictions. For example, the eruption of Mt. Pinatubo allowed modellers to test the accuracy of models by feeding in the data about the eruption. The models successfully predicted the climatic response after the eruption. Models also correctly predicted other effects subsequently confirmed by observation, including greater warming in the Arctic and over land, greater warming at night, and stratospheric cooling.
The climate models, far from being melodramatic, may be conservative in the predictions they produce. Sea level rise is a good example (fig. 1).

Fig. 1: Observed sea level rise since 1970 from tide gauge data (red) and satellite measurements (blue) compared to model projections for 1990-2010 from the IPCC Third Assessment Report (grey band). (Source: The Copenhagen Diagnosis, 2009)
Here, the models have understated the problem. In reality, observed sea level is tracking at the upper range of the model projections. There are other examples of models being too conservative, rather than alarmist as some portray them. All models have limits - uncertainties - for they are modelling complex systems. However, all models improve over time, and with increasing sources of real-world information such as satellites, the output of climate models can be constantly refined to increase their power and usefulness.
Climate models have already predicted many of the phenomena for which we now have empirical evidence. A 2019 study led by Zeke Hausfather (Hausfather et al. 2019) evaluated 17 global surface temperature projections from climate models in studies published between 1970 and 2007. The authors found "14 out of the 17 model projections indistinguishable from what actually occurred."
Talking of empirical evidence, you may be surprised to know that huge fossil fuels corporation Exxon's own scientists knew all about climate change, all along. A recent study of their own modelling (Supran et al. 2023 - open access) found it to be just as skillful as that developed within academia (fig. 2). We had a blog-post about this important study around the time of its publication. However, the way the corporate world's PR machine subsequently handled this information left a great deal to be desired, to put it mildly. The paper's damning final paragraph is worthy of part-quotation:
"Here, it has enabled us to conclude with precision that, decades ago, ExxonMobil understood as much about climate change as did academic and government scientists. Our analysis shows that, in private and academic circles since the late 1970s and early 1980s, ExxonMobil scientists:
(i) accurately projected and skillfully modelled global warming due to fossil fuel burning;
(ii) correctly dismissed the possibility of a coming ice age;
(iii) accurately predicted when human-caused global warming would first be detected;
(iv) reasonably estimated how much CO2 would lead to dangerous warming.
Yet, whereas academic and government scientists worked to communicate what they knew to the public, ExxonMobil worked to deny it."
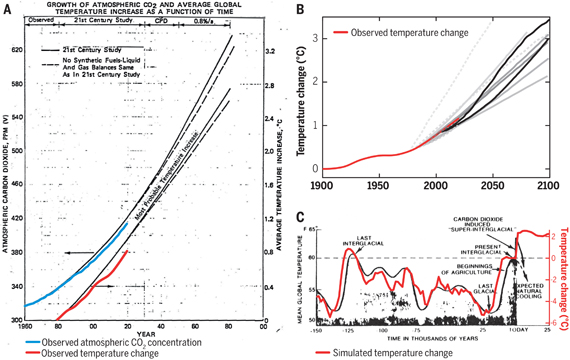
Fig. 2: Historically observed temperature change (red) and atmospheric carbon dioxide concentration (blue) over time, compared against global warming projections reported by ExxonMobil scientists. (A) “Proprietary” 1982 Exxon-modeled projections. (B) Summary of projections in seven internal company memos and five peer-reviewed publications between 1977 and 2003 (gray lines). (C) A 1977 internally reported graph of the global warming “effect of CO2 on an interglacial scale.” (A) and (B) display averaged historical temperature observations, whereas the historical temperature record in (C) is a smoothed Earth system model simulation of the last 150,000 years. From Supran et al. 2023.
Updated 30th May 2024 to include Supran et al extract.
Various global temperature projections by mainstream climate scientists and models, and by climate contrarians, compared to observations by NASA GISS. Created by Dana Nuccitelli.
Last updated on 30 May 2024 by John Mason. View Archives


Spencer now shows Cornbelt data, and "42 CMIP5 models.
http://www.drroyspencer.com/wp-content/uploads/Corn-belt-temp-JJA-thru-2016-vs-42-CMIP5-models-1.jpg
He implies that the CMIP5 projections are for the cornbelt.
Is this true?
(In my local newspaper I clash with Joe D'Aleo's misiformation, can use help.)
There seems to be alot of confusion on setting up a model.... "fudging" "tweaking" "adjusting"....
Any good model is "Calibrated" and then "Verified". One dat aset--say climate data from 1900-1950--is used to calibrate the model. That is adjust coeficients and varibles, tweak if you will, to match existing data.
The model is then verified against a second data set--say 1951-2000— to "verify" if the "calibrated" model can predict actual data without any tweaking or fudging. Only then is a model ready to "predict" future conditions.
Though the question of whether the "calbration" dataset is similar enough to future conditions to ensure that predicted results are meaniful still remains.
ramprasad
Here are some climate scientists discussing climate models:
https://www.youtube.com/watch?v=PZo1TYpsy2U
I'm new here, but here's a quick intro, I'm a chemical engineer with approximately 20 years experience in the semiconductor industry. A significant portion of that time involved computational fluid dynamics (CFD) modeling of reacting flows. Thus, I'm quite familiar with the capabilities and limitations of CFD models. All GCMs are at heart, large-scale CFD models.
@1003 - The video gives a nice overview of the climate models for the layman, but I can't help but think the scientists are downplaying many of the model limitations.
Yes, for most of the phenomena of interest the basic physics are pretty well understood, but to model them on a planetary scale, gross simplifying assumptions must be made due to computational limitations. The skill of the model is intimately tied to the accuracy of these assumptions and that is where the model can easily go astray.
Dr. Judith Curry gives a pretty good summary for the layman of some of the most salient model limitations in an article linked here:
https://wattsupwiththat.com/2017/02/21/curry-computer-predictions-of-climate-alarm-are-flawed/
The bottom line is that while some of the approximations are extremely accurate, by necessity the models for some processes are quite crude. This latter set, varies from model to model depending on the specific model purpose and is one reason for the spread in reported model results. It is these crude approximations that ultimately must be tuned to fit the available data, but with such tuning comes the ever present risk of getting the right answer for the wrong reason, in which case there is no guarantee that the model will be useful for future predictions.
If we had several earths to experiment on, we could run multiple experiments with different forcing conditions and sort out the various contributions of different effects, but since we have only one earth, we don't have any way to completely distinguish the impact of the various forcings (eg. CO2 levels, solar radiation, cloud formation, SO2 and aerosols, Natural variability, etc...) from each other. This means we have to make educated guesses about the various sensitivities. Over time, these guesses will get better, as we get more data to compare them to and we better understand the various sources of natural variaton (eg El Nino/La Nina).
However, at the moment, we really only have about 40 years of reliable, high-density data (the satellite era) and we're trying to decouple the impact of increasing CO2 from a natural variability signal that also seems to have a 30-60 year period. Dr. Curry contends that the due to such factors, the IPCC has over-estimated the sensitivity of the climate to CO2, possibly by as much as a factor of two.
If true, this means that climate change will happen much more slowly and to a lesser degree than originally predicted.
SemiChemE @1004, neither Judith Curry, the Global Warming Policy Foundation nor Nic Lewis have a sterling reputation when it comes to climate science. All have shown a strong prediliction to cherry pick results in favour of low sensitivity/low impact projections. That is evidenced again in the report for which you provide the URL.
More specifically, in Table 1 Curry reports the climate sensitivity estimates of the IPCC AR4, the IPCC AR5, and the CMIP5 model ensemble, along with just two recent estimates. Nic Lewis is an author of both of those estimates, with Judith Curry being his coauthor in the first, and higher estimate. The two climate sensitivity (best) estimates are, respectively, 1.64 oC and 1.54 oC per doubling of CO2. Both estimates are by the energy balance method. I should note that by "best estimate", Curry means the modal value. Given the use of estimates of ECS in estimating likely damages from global warming, it is more appropriate to report the mean value. Given the assymetry in the uncertainty ranges, the mean value is likely to be higher than the modal value.
For comparison, using the same method but less controversial assumptions, Otto et al (2013) found a most likely (ie, modal) estimate of 1.9 oC with a 5-95% confidence range of 0.9-5.0 oC. That is warmer than the effective IPCC estimate of the modal value as determined by Rogelj et al (2014) (See supplementary data, tables 1 & 2, case f).
Further, when we look outside the strict confines of energy balance based estimiates of ECS, the range of values becomes much larger. Bodman and Jones (2016) report estimates of mean values for the ECS of 2.0, 3.2, 1.8, and 2.6 oC per doubling of CO2 for a range of studies, the oldest of which was published in 2012. An even greater range is obtained if we consider studies of paleo data, as shown in Figure 1 of Heydt et al (2016):
(To read the graph, the x axis shows the approximate GMST relative to 20th century values, while the y axis shows the climate sensitivity parameter. To obtain the ECS for 2xCO2, multiply that value by 3.7 W/m^2. As can be seen a range of values are obtained, most commensurate with the IPCC AR5 and CMIP 5 estimates, though with some lower and some much higher.
Lewis likes to argue that energy balance estimates are incontrovertibly superior to other estimates, but there are good reasons to doubt that. Indeed, there are good reasons to think that such estimates are biased low. Nic Lewis' results are further biased low on top of that by his controversial assumptions all of which tend towards a lower estimate of ECS.
To summarize, Judith Curry's GWPF report is typical of their productions in being based on extreme cherry picking of data to drive an ideological point. It is not a fair summary of the science, and therefore need not be considered in a science based blog.
I should note that while some estimates from Heydt et al are in the low end of the AR5 range, all are higher than those cherry picked by Judith Curry.
SemiChemE,
You should read more about satalite temperature records. Carl Mears, head scientist at RSS says the surface record is more reliable. The model to convert measurements into temperature is very complicated and major errors are found all the time. The final result is the temperature several miles up into the air. How useful is that?
By contrast, the surface results have been consistent for decades. BEST used a new method of analysis and added a great deal of data and got an identical result. The surface station project eliminated a great deal of data and the result was identical. Both BEST and the surface station were run by deniers.
You should look more at paleo results. Compared to satalite records they are great. They give insight into very long data series.
michael sweet @1007, to add a bit of irony, the two estimates of climate sensitivity on which Curry, and hence SemiChemE rely on depend on comparing current temperatures and Ocean Heat Content with that from the late 19th century. What is worse, they do not use the only empirical data regarding the change in OHC since the late 19th century. Rather, they use model estimates. That means that if we reject the models as insufficiently accurate, we must also reject Nic Lewis's estimate of the ECS.
Tom,
I am puzzled to learn how Nic Lewis can estimate that the sensitivity to a doubling of CO2 is 1.5 - 1.6C when in 2016 the temperature was already about 1.5C above pre-industrial. Hansen estimates about 0.6C in the pipeline and we are nowhere near doubing CO2. Granted that 2016 was an El Nino year, but that only adds about 0.1C to the temperature.
Nic Lewis initially made his estimates in about 2012 when the temperature had risen slowly for a few years. SInce the temperature has risen so quickly the last three years, I would epect that Nic would need to rework his calcualtions. I doubt that Mr. Lewis or Dr. Curry will redo the calculations.
michael sweet @1009, in fact Nic Lewis has updated his estimates, at least to include 2015 data. As he needs updates on forcings and OHC as well as temperatures, we may need to wait until late April for his 2016 update.
The update is in fact the Lewis (2016) cited by Curry. He produced a table of updates and alternative estimates as follows:
Unsurprisingly, Curry reports only the lowest estimate of ECS on the table.
The other estimates are consistent with, or higher than the AR5 estimate (bearing in mind they are modal values). The differ significantly from the AR5 estimate only in having (for the most part) tighter uncertainty bounds. That in turn is due to their all coming from a single method, whereas the IPCC allowed consideration of other emperical estimates as well. That is, Nic Lewis (and Judith Curry) increase their certainty that ECS will be in the low end of the IPCC range by the easy expedient of excluding relevant data (and other methods of analysing the data they use).
Tom
Thank you for the update. I apologize to Nic Lewis.
Imagine my surprise to hear that Nic Lewis' result is now consistent with the IPCC. 2016 will bring him higher still. Interesting that Curry reports only the lowest estimate. I wonder why ;P.
Using GISS data baseline 1880-1910 and now as 1996-2016 I get a difference of 0.94C while Lewis shows only 0.75C for similar times. Lewis is probably using HADCRU which is biased low at current times. Before 1880 GISS does not estimate temperature because they think there is not enough data. If Lewis used GISS his estimates would be even more similar to the IPCC.
Tom Curtis @1005 the point of my comment was that the models still contain a great deal of uncertainty, which limits their usefulness for predicting long-term climate trends and the impact of CO2 emissions on those trends. This is self-evident from the CMIP5 model estimates of ECS: 3.22 (2.1-4.7), mean (5%-95%). Thus, even the best models show a fairly large range of sensitivities, likely spanning more than a factor of 2.
Lewis and Curry's analyses suggest that the real climate sensitivity could be even less and thus the models may have even more uncertainty. While it's fair to criticize some of their assumptions and argue that similar analyses, such as those you cited by Otto are more likely to be accurate, even Otto's modal value of 1.9C is below the 5% lower limit of the CMIP5 models (2.1). This suggests the models are still imature and as a result, there is a reasonable possibility that they overstate the impact of CO2.
Finally, I disagree with your last statement that Curry's analysis need not be considered in a science based blog. She and Lewis show plausible (though possibly unlikely) scenarios consistent with a low ECS. Even the IPCC fifth assessment does not rule out an ECS as low as 1C. Rather, if you want to make a rational science-based case for why we should be concerned about global warming, you should instead be prepared to show which of their assumptions are weak and why a higher ECS is considerably more likely.
SemiChemE... What all this comes down to is risk assessment. If you're assessing risk you shouldn't pick one best case scenario. You need to look at the full range.
Who knows. Curry and Lewis might be correct about CS. There are reasons that other researchers believe their assessments are wrong (glacial-interglacial feedbacks being one). But are you really going to risk global lifesupport systems for generations based on a best case estimate?
I'd suggest it's probably more rational to base a course of action on higher end CS estimates. Plan for the worst but hope for the best.
michael sweet @1007 - Certainly, the surface temperature record has its place and I did not mean to imply that the satellite data was the only valid dataset, rather that only in the satellite era do we have a spacially complete dataset. Before this time, there are huge gaps in the temperature record, especially over the oceans, which constitute roughly 71 percent of the Earth's surface and in sparcely populated regions (Antarctica and large regions of Russia, Africa, South Amercia, etc...).
Without a spacially complete dataset, it is impossible to verify whether a particular model properly distributes heat across the planet. Further this adds significant uncertainty to attempts to understand the relative contributions of CO2 and other natural sources of climate variability, since there could be local temperature variations, which the sparce temperature records do not capture.
Like you said, paleoclimate data is great in that it covers very long time periods, but again it tends to be even more sparce and somewhat less precise, again leading to significant uncertainty.
For these reasons, we are likely still decades away from having a highly accurate estimate of climate sensitivity to CO2.
Rob Honeycutt @1013 - While I agree that planning for the best case scenario would be a mistake, the social costs of planning for an overly pessimistic ECS would also be tremendous. While its easy to say these costs should be born by the wealthy and are a minimal sacrifice, the reality is that in both scenarios, the bulk of the costs will be born by the poor, who cannot afford them. So, in the end it is critical that we get it right, which means understanding the limitations of the models and continuously improving them.
SemiChemE... It could be much longer than decades before we have a highly accurate estimate of CS. This is a problem that's been worked on for many decades and the range has remained essentially unchanged. The satellite record is a very poor data set to use for these purposes because the uncertainty of that data is much higher than the surface temperature data.
The higher end CS uncertainties are not going to be resolved by better estimates coming from either satellite or surface station data since the higher end uncertainties revolve around (in part) things like methane releases from permafrost and clathrates.
You need to understand, we're approaching uncharted waters relative to at least the past 2-3 million years once we push past 2°C over preindustrial.
It's becoming a bit of a cliche phrase now, but uncertainty is not our friend. Uncertainty is a case for stronger action, rather than inaction.
SCE @1015... But no one is even close to planning for overly pessimistic scenarios. Even the scenarios that are as likely as Curry&Lewis are in the 4-6°C range. We're challenged to just get a rational carbon tax that could even start to address a 3°C scenario. We're currently trotting along almost as if CS is near zero, and we've been doing that for the past 30 years while the scientific community has been telling us that we have a critical problem.
That said, a lot is happening with renewables that people should be cautiously relieved by. But that's not progressing anywhere near fast enough to deal with just a central estimate of 3°C.
"...the social costs of planning for an overly pessimistic ECS would also be tremendous."
When economists look at these questions, that's not what they're telling us. They're saying, very clearly, the most economical thing to do is to invest now in mitigation. It only gets worse the longer we wait.
"rather that only in the satellite era do we have a spacially complete dataset. Before this time, there are huge gaps in the temperature record, especially over the oceans, which constitute roughly 71 percent of the Earth's surface and in sparcely populated regions"
Still caution here. Satellite temperatures derived from MSU (UAH, RSS) are attempting (with large errors) to measure the temperature from a several kilometer thick chunk of lower troposphere. They cannot measure surface temperature. Comparing surfaceSAT records (eg GISTEMP, BEST, C&W) use ship and bouy data to cover the ocean, supplemented by satellite derived estimates. The estimates of trend from SATs have lower uncertainities that those from MSU (see here for more discussion and comment there if you want to discuss this further)
Rob Honeycutt @1016 - My understanding is that one of the largest sources of natural climate variability is the Pacific Decadal Oscillation. I am by no means an expert, but my understanding is that this phenomenon has a period of 50-70 years (see wikipedia). As stated before, we are roughly 40 years into the satellite era, so presumably we have observed roughly 2/3's of one cycle with a relatively dense data set (eg. the satellite record). I believe that once we have observed a complete cycle (or perhaps even a bit sooner), our understanding of this major natural process will greatly improve and as a result, our ability to model it properly will also improve. Thus, I'm anticipating a significant advance in the modeling accuracy within the next two decades. Presumably, this will lead to significant improvements in the precision and accuracy of model-based ECS estimates.
Note, I'm not saying that the satellite data set is perfect or the best temperature measurement, but it is the only set with nearly complete coverage of the earth's atmosphere. Thus it is the natural data set for use in calibration and validation of models designed to cover the atmosphere.
SemiChemE
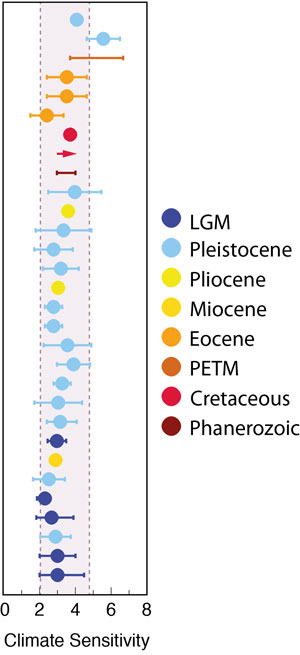
Although we don't have multiple planets to run experiments on, we do have a long history of climate on this planet. Paleoclimatology is able to estimate climates going back 100's of millions of years. And one recent meta-study put all this together to estimate what climate sensitivity actually was from that history
Thus graph is adapted from the PALEOSENS study. The study looked at several dozen papers that had estimated climate forcings and sensitivities over various geological ages. It harmonised the methods they had used to produce a common method of estimating sensitivity to a radiative forcing, due to CO2 or anything else. Then John Cook applied the accepted forcing from CO2 - 3.7 W/M2 per doubling of CO2 to get ECS.
The different periods are LGM - Last Glacial Maximum, 20,000 years ago. Pleistocene/Pliocene - millions of years ago. Miocene/Eocene 10's of millions. PETM (Paleocene/Eocene Thermal Maximum) was a period 55 million years ago where a rapid warming event occurred, The Cretaceous is the end of the age of the Dinosaurs up to 65 million years ago, and the Phanerozoic is the entire period back to 420 million years ago.
As you can see none of these studies suggest particularly low values for ECS. A few do suggest higher than 3 and there are several outlier studies that John hasn't included that do suggest even higher values.
To me the Earth has run the experiments for us and these are the results. ECS of less than 2 seems very unlikely.
A second aspect we learn from paleo studies is about speed. The LGM was probably 5 C colder than now as a global average. The warming (and retreat of the ice sheets) took around 10,000 years. so 0.05C/century. Now temps are rising at of the order of 1 C/century and that might increase. CO2 varied over the same period, rising by around 100 parts per million (ppmv) from 180 to 280. Thats 1 ppm/century. Today CO2 is rising at around 1ppm every 20 weeks.
During the PETM, temperatures spiked up by around 6 C, a small extinction event happened and an ocean acidification event. A sediment core sample from Svalbard from this period puts the rate of change of CO2 concentrations then at only 1/10th tha pace of today.
To find a geological period where CO2 concentrations rose probably faster than today we have to go back 252 million years, to the end-Permian Mass Extinction event. A vast volcanic event lasting 10's and possible 100's of 1000's of years in Siberia included periods where CO2 levels may have risen faster than today. The end-Permian event saw 75% of families of species on land go extinct, 96% in the oceans.
Where changing climate is concerned, 'Speed Kills'.
scaddenp @1019 - I'm afraid you are missing the point. I do not claim that the satellite data set is the best. Rather that only in the satellite era do we have a spacially dense data set adequate for capturing most of the relevant phenomena that must be captured and calibrated in the models.
I'm completely fine with climate scientists using a hybrid record, incorporating surface records, radiosonde data, satellite data, and Ship-based and buoy based observations to make the best data set possible. But, my point is that only in the satellite era has such a data set been possible.
Furthermore, since we are only 40 years into this era, we are barely half-way through a complete Pacific Decadal Oscillation, which appears to be one of the larger sources of natural climate variability. For these reasons, modelers must make assumptions about natural climate variability that may or may not be true. Once we have observed a complete cycle, we'll be in a much better position to verify or refine these assumptions as necessary. This will lead either to improved model verification, which will significantly increase our confidence in the existing models or development of refined models that are much more accurate.
SCE
Another aspect that paleoclimate can tell us a bit about is sea level. The transition out from the last glacial maximum saw sea level rise by 120 meters of more. The map of the world looked different then. There is still enough ice left in Antarctica and Greenland to raise sea level andothe 65-70 meters if it were to melt - essentially a 5 C warming melted 2/3rds of the ice present at the LGM. How much warming to melt the rest?
The previous inter-glacial period the Eemian 125,000 years ago was lightly warmer than the current one (before we started raising the temperatuire) Temperatures during the Eemian were something similar to todays. And sea level was 5-9 meters higher than today. If we look for when CO2 levels were last around 400 ppm we have to go back around 3 million years, to the middle Plieocene. There were still glacial cycels but they were warmer. Theinter-glacials appear to have had CO2 levels around 400 pp or so. Temperatures were 2-3 C warmer than today, and sea level was 10-20 meters higher. So just with what we have done so far, if CO2levels don't drop, we would appear to have locked in many meters of sea level rise. It isn't just this century that this will happen, it will last for centuries.
But we are still raising CO2 levels. At current emission rates we could get to 600-700 ppm by the end of the century. To find a period like that in the past we now need to go back 30+ million years. Back to when the Antarctic ice sheet was only just starting to form. We are certainly capable of taking CO2 levels to that height. If we still haven't reigned in emissions we could almost lock in sea level rise of many 10's of meters over subsequent centuries, and possiby millenia.
Flood Myths are a common feature of many cultures, from the Epic of Gilgamesh to the Bible. Queensland Aborigines have oral traditions telling of how their ancestors walked the hills we now call the Great Barrier Reef.
In the centuries ahead, those times of myth will be returning. The seas will rise, thats what they have done in the past.
SCE:
Did you read the US Climate Change report I linked earlier? It is already costing us a lot dealing with the changes that have already occured. The drought that started the Syrian war was the worst drought they have had in 900 years. Does that seem like a coincidence, or was it caused by AGW?
According to Jacobson (which is peer reviewed), if we switch to renewable energy (WWS) it will save money, create more jobs, solve AGW (at least stop adding to the damage) and result in a dramatic lessening of pollution. Currently over 13,000 people in the USA die every year from air pollution from coal burning power plants. Additional combustion results in tens of thousands more premature deaths. You want to continue this for what?
Please cite a peer reviewed report that backs your claim that changing to renewable energy will be bad for the economy. You appear to be citing worries from propaganda on the internet.
You have not addressed the cost of continuing to use fossil fuels. The cost of sea level rise alone is trillions of dollars, even if we count the cost of the dead (and their health care before they die) as zero. What is the cost of treating fossil fuel caused disease like asthma and heart disease?
If we were to start to seriously start to build out WWS and it turned out to be bad for the economy we could easily just stop the build. It would cost less than the Iraq war to build out a complete WWS system for the USA so that we no longer needed to import oil forever.
What are you fearful you need to defend? Are you old enough to remember the terrible pollution problems from the 1960's and '70's? I am. It was almost as bad as China today. Air was unbreathable across the US. The fossil fuel executives currently in charge of EPA want to return to air that cannot be breathed. Is that what you want? If not, how do you propose to move forward?
SemiChemE @1012,
You disagree with opinion expressed in this thread, in that you consider that Curry's GWPF paper does have a place here in scientific discussion. Given the main thrust of Curry's GWPF paper reiterates Lewis & Curry (2014) which carries no such dispute, can you make clear what it is in Curry's GWPF paper you feel is necessary to include in this discussion but which is absent from Lewis & Curry (2014).
I should make plain my position. I have in the past examined a number of GWPF papers and found them "consistently wrong and entirely flawed." GWPF policy papers are thus entirely without scientific credibility. They actually make rather good comedy.