


 Arguments


How reliable are climate models?
What the science says...
| Select a level... |
 Basic
Basic
|
 Intermediate
| |||
|
Models successfully reproduce temperatures since 1900 globally, by land, in the air and the ocean. |
|||||
Climate Myth...
Models are unreliable
"[Models] are full of fudge factors that are fitted to the existing climate, so the models more or less agree with the observed data. But there is no reason to believe that the same fudge factors would give the right behaviour in a world with different chemistry, for example in a world with increased CO2 in the atmosphere." (Freeman Dyson)
At a glance
So, what are computer models? Computer modelling is the simulation and study of complex physical systems using mathematics and computer science. Models can be used to explore the effects of changes to any or all of the system components. Such techniques have a wide range of applications. For example, engineering makes a lot of use of computer models, from aircraft design to dam construction and everything in between. Many aspects of our modern lives depend, one way and another, on computer modelling. If you don't trust computer models but like flying, you might want to think about that.
Computer models can be as simple or as complicated as required. It depends on what part of a system you're looking at and its complexity. A simple model might consist of a few equations on a spreadsheet. Complex models, on the other hand, can run to millions of lines of code. Designing them involves intensive collaboration between multiple specialist scientists, mathematicians and top-end coders working as a team.
Modelling of the planet's climate system dates back to the late 1960s. Climate modelling involves incorporating all the equations that describe the interactions between all the components of our climate system. Climate modelling is especially maths-heavy, requiring phenomenal computer power to run vast numbers of equations at the same time.
Climate models are designed to estimate trends rather than events. For example, a fairly simple climate model can readily tell you it will be colder in winter. However, it can’t tell you what the temperature will be on a specific day – that’s weather forecasting. Weather forecast-models rarely extend to even a fortnight ahead. Big difference. Climate trends deal with things such as temperature or sea-level changes, over multiple decades. Trends are important because they eliminate or 'smooth out' single events that may be extreme but uncommon. In other words, trends tell you which way the system's heading.
All climate models must be tested to find out if they work before they are deployed. That can be done by using the past. We know what happened back then either because we made observations or since evidence is preserved in the geological record. If a model can correctly simulate trends from a starting point somewhere in the past through to the present day, it has passed that test. We can therefore expect it to simulate what might happen in the future. And that's exactly what has happened. From early on, climate models predicted future global warming. Multiple lines of hard physical evidence now confirm the prediction was correct.
Finally, all models, weather or climate, have uncertainties associated with them. This doesn't mean scientists don't know anything - far from it. If you work in science, uncertainty is an everyday word and is to be expected. Sources of uncertainty can be identified, isolated and worked upon. As a consequence, a model's performance improves. In this way, science is a self-correcting process over time. This is quite different from climate science denial, whose practitioners speak confidently and with certainty about something they do not work on day in and day out. They don't need to fully understand the topic, since spreading confusion and doubt is their task.
Climate models are not perfect. Nothing is. But they are phenomenally useful.
Please use this form to provide feedback about this new "At a glance" section. Read a more technical version below or dig deeper via the tabs above!
Further details
Climate models are mathematical representations of the interactions between the atmosphere, oceans, land surface, ice – and the sun. This is clearly a very complex task, so models are built to estimate trends rather than events. For example, a climate model can tell you it will be cold in winter, but it can’t tell you what the temperature will be on a specific day – that’s weather forecasting. Climate trends are weather, averaged out over time - usually 30 years. Trends are important because they eliminate - or "smooth out" - single events that may be extreme, but quite rare.
Climate models have to be tested to find out if they work. We can’t wait for 30 years to see if a model is any good or not; models are tested against the past, against what we know happened. If a model can correctly predict trends from a starting point somewhere in the past, we could expect it to predict with reasonable certainty what might happen in the future.
So all models are first tested in a process called Hindcasting. The models used to predict future global warming can accurately map past climate changes. If they get the past right, there is no reason to think their predictions would be wrong. Testing models against the existing instrumental record suggested CO2 must cause global warming, because the models could not simulate what had already happened unless the extra CO2 was added to the model. All other known forcings are adequate in explaining temperature variations prior to the rise in temperature over the last thirty years, while none of them are capable of explaining the rise in the past thirty years. CO2 does explain that rise, and explains it completely without any need for additional, as yet unknown forcings.
Where models have been running for sufficient time, they have also been shown to make accurate predictions. For example, the eruption of Mt. Pinatubo allowed modellers to test the accuracy of models by feeding in the data about the eruption. The models successfully predicted the climatic response after the eruption. Models also correctly predicted other effects subsequently confirmed by observation, including greater warming in the Arctic and over land, greater warming at night, and stratospheric cooling.
The climate models, far from being melodramatic, may be conservative in the predictions they produce. Sea level rise is a good example (fig. 1).

Fig. 1: Observed sea level rise since 1970 from tide gauge data (red) and satellite measurements (blue) compared to model projections for 1990-2010 from the IPCC Third Assessment Report (grey band). (Source: The Copenhagen Diagnosis, 2009)
Here, the models have understated the problem. In reality, observed sea level is tracking at the upper range of the model projections. There are other examples of models being too conservative, rather than alarmist as some portray them. All models have limits - uncertainties - for they are modelling complex systems. However, all models improve over time, and with increasing sources of real-world information such as satellites, the output of climate models can be constantly refined to increase their power and usefulness.
Climate models have already predicted many of the phenomena for which we now have empirical evidence. A 2019 study led by Zeke Hausfather (Hausfather et al. 2019) evaluated 17 global surface temperature projections from climate models in studies published between 1970 and 2007. The authors found "14 out of the 17 model projections indistinguishable from what actually occurred."
Talking of empirical evidence, you may be surprised to know that huge fossil fuels corporation Exxon's own scientists knew all about climate change, all along. A recent study of their own modelling (Supran et al. 2023 - open access) found it to be just as skillful as that developed within academia (fig. 2). We had a blog-post about this important study around the time of its publication. However, the way the corporate world's PR machine subsequently handled this information left a great deal to be desired, to put it mildly. The paper's damning final paragraph is worthy of part-quotation:
"Here, it has enabled us to conclude with precision that, decades ago, ExxonMobil understood as much about climate change as did academic and government scientists. Our analysis shows that, in private and academic circles since the late 1970s and early 1980s, ExxonMobil scientists:
(i) accurately projected and skillfully modelled global warming due to fossil fuel burning;
(ii) correctly dismissed the possibility of a coming ice age;
(iii) accurately predicted when human-caused global warming would first be detected;
(iv) reasonably estimated how much CO2 would lead to dangerous warming.
Yet, whereas academic and government scientists worked to communicate what they knew to the public, ExxonMobil worked to deny it."
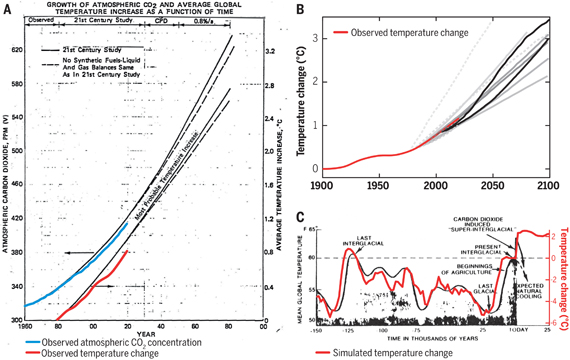
Fig. 2: Historically observed temperature change (red) and atmospheric carbon dioxide concentration (blue) over time, compared against global warming projections reported by ExxonMobil scientists. (A) “Proprietary” 1982 Exxon-modeled projections. (B) Summary of projections in seven internal company memos and five peer-reviewed publications between 1977 and 2003 (gray lines). (C) A 1977 internally reported graph of the global warming “effect of CO2 on an interglacial scale.” (A) and (B) display averaged historical temperature observations, whereas the historical temperature record in (C) is a smoothed Earth system model simulation of the last 150,000 years. From Supran et al. 2023.
Updated 30th May 2024 to include Supran et al extract.
Various global temperature projections by mainstream climate scientists and models, and by climate contrarians, compared to observations by NASA GISS. Created by Dana Nuccitelli.
Last updated on 30 May 2024 by John Mason. View Archives


@MA Rodger 1141
You state: “The constant 0.5 imbalance is "almost" (Christy also says "much more" which is a poor description - "more" yes, "much more" no.) the same size as the occasional fluctuations, his examples being monthly wobbles of +/-1.0 & +/-1.5.”
But Christy’s examples, which you appear to accept, take for instance evaporation of 24 average increasing to compared to 27 over a monthly which is actually a 12.5% change in the amount of heat lost through evaporation. That is clearly not small and that is just a monthly rather than annual, let alone centennial fluctuation of one of the many variables of both inputs (eg amount of solar radiation) and outputs.
Christy’s diagram does NOT imply 0.5 units is retained. His diagrams show in=out.
I think Christy believes one possible reason for the difference is explained by the extra heat being lost in the troposphere. This backed up by Steven C Sherwood and Nidhi Nishant “ tropospheric warming does not reach quite as high in the tropics and subtropics as predicted in typical models”. https://iopscience.iop.org/article/10.1088/1748-9326/10/5/054007/pdf.
Rupisnark @1151 ,
how does evaporation qualify as an input or output of the planet?
"Top Of Atmosphere" [TOA] is normally taken as the planetary boundary, concerning the gaining of heat/energy and the losing of heat/energy (i.e. concerning the equilibrium or disequilibrium of energy flux re global warming or cooling). Evaporation & condensation move the heat around within the boundary ~ this plus convections of ocean and atmosphere do variably affect the distribution of heat/energy . . . but this is all part of the "averaging" which contributes to the TOA energy flux.
The multi-decadal average is the determinant of climate change. Dr Christy is obfuscating.
rupisnark @1151,
The basic message is as Eclectic @1152 says, Christy is trying to pull the wool over your eyes. It may be he has managed to pull the wool over his own eyes as well. That would square with him being in denial over climate change.
And Eclectic @1152 is correct to say that AGW is a phenomenon at the TOA but Christy is not discussing TOA. He is indeed obfuscating.
Your first point, that global evaporation can vary by large amounts month-to-month (Christy quoted examples of 24 and 27 'units' in his talk, a variation peak-to-peak of some 12%, a little more variation than his words in GWPF Note 17 - "In other words, evaporation might be 24 one month, but it might be 26 the next."), looking at actual monthly variation, the maximum variation of measured global monthly precipitation over decads (there's a graph of it 1980-2011 on this web-page) is about 12% peak-to-peak. Thus to say such a variation could occur "one month" to "the next" is pure exaggeration. The typical variation month-to-month is far far smaller.
And it is far far smaller doubly-so. Your point that 12% is a big value is twice incorrect. As they say '100% of naff-all is still naff-all.' And the typical variation month-to-month in surface heat flux due to precipitation is naff-all relative to the total precipitation which in turn is a small component of the total surface heat flux.
And your inference that such variation in precipitation would be even larger at longer timescales, "annual, let alone centennial fluctuation" is not correct. Over longer timescales the variations will tend to average out, although there will be trends caused by the likes of AGW.
You also suggest that longer term fluctuation could exist in "the many other variables of both inut (eg amount of solar radiation) and output." The solar cycle resilts in TSI wobbling by 1Wm^-2 peak-to-peak. In Christy-units that would be 0.07 units peak-to-peak (of the 11-year cycle) but when averaged out over longer periods the measure would be far far smaller. That this is a minor effect climate-wise is evinced by the absence of any noticable 11-year climate cycle.
Your second point is that "Christy’s diagram does NOT imply 0.5 units is retained." I don't know why you would suggest such an implication. In GWPF Note 17 Christy states "The extra carbon dioxide we have added to the atmosphere amounts to about an extra 0.5 of a unit of the 100 downwelling from the air." So if the CO2 is there, surely the 0.5 units are there. I see no evidence of any implication that the forcing is not permanent.
You further suggest that there is "extra heat being lost in the troposphere" which might provide "one possible reason," this proposal "backed up" by an area of the upper troposphere that has not warmed in line with modelled projections. I don't follow the logic. By what mechanism would a cooler part of the upper troposphere constitute a sink for a heat flux of 0.5 Christy-units?
Dr. Christy has a long history of presenting irrelevant, cherry-picked (tiny parts of the Sierras to argue that snowfall isn't decreasing, temps in Alabama which is relatively unchanged relative to other regions of the US), over-averaged (averaging rainfall over the US, ignoring that some regions are changing drier, others changing wetter), unnormalized (temp. extreme records without normalizing for the length of the observations at each station), and/or deceptively graphed data (his temp. record graph, which uses a variety of choices that all exaggerate variability in models/observations while his own look better than they actually are). And yes, I can point to concrete examples of each of those, most directly in the various testimonies he's submitted to Congress.
It's well worth taking any climate statement from Christy with both a large grain of salt and a careful examination of the evidence presented.
@rupisnark 1151
Christy's offers his usual distortions that he's been giving for decades. His core argument is that climate models exaggerate bulk tropospheric warming, especially in the topics, and this results from climate models over-estimating climate sensitivity (over-estimating CO2-induced warming). His conclusion is wrong, and the discrepancies he points out are primarily not due to model error, but instead primarily due to errors in inputted forcings for the models, along with internal variability and observational uncertainty (ex: Christy showing tropospheric warming estimates contaminated by stratospheric cooling). So the models aren't greatly over-estimating climate sensitivity.
If you want an introduction to this subject, then I recommend reading "A response to the “Data or Dogma?” hearing", "Fact sheet for “Causes of differences between model and satellite tropospheric warming rates”", along with the papers with the following DOI numbers: 10.1175/JCLI-D-16-0333.1 ; 10.1038/NGEO2973 ; 10.1002/2017GL073798
Here is a list of some of the problems:
1) If bulk tropospheric warming was muted relative to surface warming, especially in the tropics, then that would be a sign of a muted negative lapse rate feedback. That would increase climate sensitivity, not decrease it, contrary to what Christy claims. And there's plenty of evidence of a multi-decadal, positive water vapor feedback.
2) If Christy's position was right, then we'd expect to see a strong model vs. observational analyses discrepancy pre-1999. But we don't. We instead see it post-1999, as one would predict if the issues were with errors in inputted forcings over that period, not over-estimated climate sensitivity.
3) The models don't greatly exaggerate temperature responses to volcanic eruptions in the way one would expect if Christy were right about over-estimated climate sensitivity.
4) A number of papers showed that errors in inputted forcings largely explained residual post-1999 differences between surface analyses vs. models; that would also imply a contribution to post-1999 bulk tropospheric discrepancies as well.
5) Christy has a decades-long history of too hastily jumping to model error as an explanation, when the actual explanation was something else. This includes the notorious case in which he claimed models over-estimated satellite-based bulk tropospheric warming, when actually Christy screwed up the sign of the diurnal drift correction for his UAH satellite-based analysis.
There are other problems with Christy's position, but I think that list should be enough to get you started.
[DB] Hot-linked reports and DOI's.
By logic, any model has the potential to be short a certain number of variables. Yet, without them, it is difficult to grasp functionality of a field of science.
One of the often missed factors in any scientific study is that we can only assume that what we observe over a long period of time has a consistant variable. For example, in the early 1970's we observed that polar north migrates at a rate of 7 miles per year towards Russia. Today, we find that it now is further moving at a rate of 34mpy (Source: https://www.forbes.com/sites/trevornace/2019/02/05/earths-magnetic-north-pole-has-officially-moved/#f15dce368625).
It the source provided above, it also provides a model. Can anyone find something that it's not accounting for?
Worth reading about the subject: latest update at Real Climate. CMIP 3 seems to be doing quite good.
http://www.realclimate.org/index.php/archives/2020/01/update-day-2020/
Dr Michael Mann produced his "iconic" hockey stick graph ( model ) while working with the IPCC , which showed an exponential increase in global temperatures predicted .Dr Tim Ball publicly stated " Mann belongs in the state pen , instead of Penn State , because his model is a fraud , and his work was paid for by American taxpayers .Mann sued Ball for libel , in the supreme court of Canada ( Ball is Canadian) .Mann refused to show his raw data to the court , after 8 years of proceedings .Mann was charged with contempt of court for this . Ball was awarded all court costs , because he won the "Truth decision". Why was this climate change "trial of the century not " widely publicized ? It does not fit the government's agenda ! See the entire details at " Principia Scientific" .
[PS] Multiple breaches of comments policy
Please note that posting comments here at SkS is a privilege, not a right. This privilege can be rescinded if the posting individual treats adherence to the Comments Policy as optional, rather than the mandatory condition of participating in this online forum.
Whilst the comment @1158 has been snipped, it may be worth pointing out to the commenter OH YES that the court case for libel by Mann against Ball and co-defendants 'Frontier Centre for Public Policy' resulted in 'Frontier' apologising and settling out-of-court while the action against Ball was terminated by Ball pleading that his aging witnesses who would enable him to argue hs case were dead and dying and that he himself was old and irrelevant and so no damage was caused by him to Mann that could justified the much delayed court action against such a vulnerable defendant. Those in denial over AGW have little difficulty in denying the actual legal situation and so feel they can celebrate the 'dismissal' of the libel action as a victory.
I want to know if the climate models take the latent heat of melting ice into account ? Now the temperature in 80 N area is moderated at 0 C in the summer. (see 80 N graph of DMI) If all ice has gone the temperature will increase very fast. Because it looks like the models are interpolating the observed temperatures , they do not see the latent heat of 334 KJ/kg of melting ice. This amount of energy will be replaced by sensibile heat of water 4,18 KJ/kg.K. Also the specific heat of water is almost twice the specific heat of ice 2.108 kJ/kg.K This also explains why the Arctic Amplification only happens from October tot April, because it's below zero and thus not part of the fusion water/ice at 0 C. I read in many papers that AA is not well understood. But I'm sure this is the main cause; It's the specific heat of ice in the Arctic compared with specific heat of water in the rest of the world.
Frank:
Short answer is "yes". It takes energy to melt ice. It takes energy to evaporate water. Freezing and condensation involve the opposite energy conversion. Subllimation (solid-->gas or gas-->solid) is also considered.
All of this is part of the conservation of energy, which is incorporated into the models.
Your statement "...because it's below zero and thus not part of the fusion water/ice at 0 C" makes no sense, Perhaps you can clarify.
I am an anthropogenic climate change skeptic because I’ve read criticism of the validity of the climate temperature models referenced by the IPCC. I am not a climate researcher by training or profession and to satisfy my scientific curiosity I’ve been trying to find a university course in climate temperature modeling including CO2 sensitivity analysis. From my undergraduate degree I have an extensive background in operations research, mathematics, computer science and basic physics and chemistry courses for Engineers. So I can’t imagine there is any computer modelling that will be beyond my ability.
I’ve looked at the undergraduate and graduate curriculum for the top US environmental science universities and have found only one course on climate modeling. Penn State offered METEO 523 in Spring 2020 and only 6 of 30 seats were filled and the course has been since dropped.
Can anyone suggest a climate modeling course I can pursue? Sorry to ask here but I’ve spent a lot of time searching and have come up short.
Thank you.
Deplore_This: I don't understand how you could have trouble finding courses. David Archer at U. of Chicago has an online course that starts today. It was the fourth result from my Duck Duck Go search for climate modeling course class online.
Deplore_This, also from that simple search of the internet I quickly found a course at the U. of Washington, Swedish e-Science Education (taught in English), several by MIT, University of California Santa Cruz...
Deplore_This, you could also simply search the internet for climate modelling textbook, and you'll get a plethora of books.
Deplore_This: Not exactly sure what you mean by "climate temperature models referenced by the IPCC" but I assume you mean the GCMs used by CMIP to predict future climate (of which temperature is but variable that can be extracted). If this is the case, then note that these are the best means we have available to predict future climate, but by themselves say nothing about the validity of anthropogenic climate change. They could be completely wrong do to some fundimental algorithmic error which would affect their ability to infer the future, but say nothing about the accuracy of the physic of anthopogenic climate change.
The science does depend on other models (but not necessarily computer models), especially the radiative properties of gases and the Radiative Transfer Equations in particular. These have real-world applications and the detailed work was initially done by USAF because laser-guided bombs depend on them.
There are rather more direct ways of checking validity of science (eg empirical evidence). You can also directly measure the increase in surface irradiation. I rather suspect that you would agree that an increase in surface irradation because sun increased its output would warm the planet. The GHE can do that too.
I would also recommend that read the chapter in the IPCC WG1 report on evaluation of climate models before getting too far into the course. (chp 9 in the latest report).
@Dayton 1163, 1164 and 1165
@ scaddenp 1166 and 1167
Thank you for the responses. However, I had previously found and reviewed on my own the course syllabuses for your suggested courses before posting.
Reading the syllabuses of these courses they include basic discussions of what GCM is but not how to do it. None of these courses give the student the opportunity to construct and run GCM and measure their predictive capability by hindcasting.
I am candidly stating that I am a skeptic of these models and I’m trying to understand the science. I have been frustrated that everything I find is a consensus opinion on these models but I haven’t found anything that allows me to get under the hood and see how the models work for myself and to evaluate the predictive sensitivity of these models.
I’m not looking for a book. I’m retired and have the time and the money to pay for the best university course I can take. I have the academic qualifications and professional technical knowledge and experience to dig deep into this. My problem is I haven’t found one. I’ve reviewed the curriculum of the top environmental science university programs and I haven’t found a single course. I am asking for a recommendation.
Thank you again for your response but I still don’t know where to find a course that achieves my objective. I appreciate any assistance you can provide.
Deplore_This: I strongly suggest you take some courses instead of merely reading the syllabi. if you refuse to do that, thinking you know too much already, then go ahead and skip the courses and dive into an open source model: https://www.giss.nasa.gov/tools/modelE/
Deplore_This: You should use one of the textbooks to inform you as you play with that model.
Deplore_This: Perhaps the ISCA framework is what you want.
Deplore_This: I suspect you incorrectly believe that "climate models" are different from climate theory, which is why you do not want to take any of those courses that are not devoted to what you incorrectly think of as climate models. General Circulation Models (GCMs) are just instantiations of those theories in those courses and textbooks. So by learning those theories you will be learning about what you call "climate models." Please try reading Tamino's "Not Computer Models."
I agree that over the past century, the state-of-the-art of modeling and simulation has grown by leaps and bounds, especially since the development of supercomputers in the 1980s. They have been valuable tools for research and development in general, not just climate science. It should be noted, however, that such models are meant to aid scientists in their understanding of certain phenomenon, possibly identifying causes and even making short-term general predictions. They are NOT meant for government use to generate long-term predictions (which no model can do reliably), and use them as a basis for carbon taxes and regulations.
In order for a model to accurately predict climate change, it must take into account the dynamics of atmospheric fluid motion, realizing that the atmosphere is not in thermal equilibrium. [If it were in thermal equilibrium, there would be a uniform temperature and humidity over the entire surface with no winds nor storms.] This involves solving the time-dependent equations of mass balance (equation of continuity), momentum balance (Navier-Stokes equation), and energy balance which is what is done in the climate General Circulation Models. This is a set of partial differential equations that are first order in time which are generally solved in time by some type of finite difference method given the initial conditions. Note that the terms "forcings" and "feedbacks" aren't even in the vocabulary. Therefore, if there is H2O vapor in the air, its greenhouse effect is accounted for in the energy balance equation. If there is CO2 in the air, its greenhouse effect is also accounted for in the same energy balance equation. The contributions from the H2O greenhouse warming will, of course, be much greater than those of the CO2 warming, but there is nothing to indicate that CO2 has any "control knob" effect.
The only model that predicts AGW and the CO2 control knob is the one used by Lacis et. al. 2010, the staff here at SkS, or wherever AGW is preached. This is a highly oversimplified, zero dimensional model in which the earth's temperature is represented by a single scalar value T, and the H2O vapor concentration is determined by the Clausius-Clapeyron equation at temperature T. This means that the entire globe is rigidly held to this one fixed value of temperature and corresponding value of humidity, which we know is false. Furthermore, it assumes (through the Clausius-Clapeyron equation) that H2O in its vapor state and condensed states are in constant thermal equilibrium with each other, which is also false. At this point, AGW advocates generally understand the (invalid) argument as to how CO2 becomes the controlling GHG even though it is much weaker than H2O vapor, so I won't repeat it here. In general, those who preach the doctrine that a non-condensable GHG can only be a “forcing” and a condensable GHG can only be a “feedback” have been duped by the fallacies and self-inconsistencies of this “carbon-in-control” model. Another false manifestation of this model is the frozen earth scenario where all CO2 is eliminated, and as a result, there is no non-condensable GHG in the atmosphere to provide the temperature forcing needed to put H2O vapor, the stronger GHG, in the air. As a result, the entire terrestrial greenhouse effect collapses since there isn’t any of either GHG in the atmosphere, thereby leaving an iceball of an earth behind. Aside from the highly anti-intuitive nature of this prediction, it would be totally impossible to test it.
So what should we do about this CO2 control-knob theory? Do we say "It's what the science says, so we must accept it since we are scientists.", or do we do some critical thinking and say "It took several false assumptions to make the control knob argument, so there are very likely problems with it."?
[DB] As this iteration of this user account is new, please read the Comments Policy linked near each Comment Box. Pay particular attention to the prohibition against sloganeering and note that assertions made must be accompanied by citations to credible evidence, with the more egregious the claim the higher the Burden Of Proof is upon you, the asserter, to fulfill that burden. Simply saying "ugh-ugh" is insufficient. Please compose future comments to better comport with the Comments Policy.
Sloganeering snipped.
ClimateDemon @1173 ,
Your "CO2 control knob" ideas fall flat, because you have made the critical mistake of looking at climate models only.
If you look at the bigger context, and examine the paleological evidence, then it becomes very evident CO2 has exerted a major "control knob" effect on planetary climate. That is also reinforced by the empirical evidence of modern historical data.
@Dayton 1169, 1170, 1171 and 1172
Thank you for your response. I have spent considerable time studying climate theory and when it comes to predicting future climate change everything I’ve seen is that they are all based upon AOGCM climate simulation models like those evaluated in the IPCC WG1 report you referenced. I am trying to take it to the next level to actually understand and scrutinize the models themselves.
Rather than teaching myself with an open-source model and a text book I am looking to enroll in a university course that will “provide instruction on development of climate models and… the use of climate models for understanding the dynamics of the climate system processes and behavior”. This is the description for METEO 523 at Penn State:
http://www.met.psu.edu/intranet/course-syllabi-repository/2020-spring-syllabi/meteo-523
This is the only course I’ve found on the subject and unfortunately this course is no longer offered. So I am asking if anyone on this board has a recommendation of a similar course that I can enroll in.
Thank you again for your help.