


 Arguments


How reliable are climate models?
What the science says...
| Select a level... |
 Basic
Basic
|
 Intermediate
| |||
|
Models successfully reproduce temperatures since 1900 globally, by land, in the air and the ocean. |
|||||
Climate Myth...
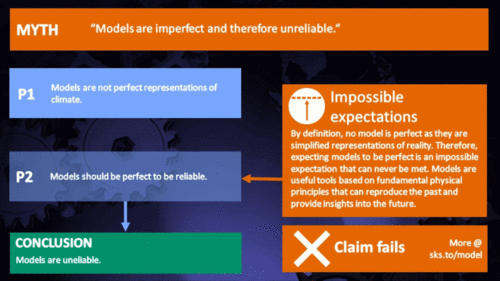
Models are unreliable
"[Models] are full of fudge factors that are fitted to the existing climate, so the models more or less agree with the observed data. But there is no reason to believe that the same fudge factors would give the right behaviour in a world with different chemistry, for example in a world with increased CO2 in the atmosphere." (Freeman Dyson)
At a glance
So, what are computer models? Computer modelling is the simulation and study of complex physical systems using mathematics and computer science. Models can be used to explore the effects of changes to any or all of the system components. Such techniques have a wide range of applications. For example, engineering makes a lot of use of computer models, from aircraft design to dam construction and everything in between. Many aspects of our modern lives depend, one way and another, on computer modelling. If you don't trust computer models but like flying, you might want to think about that.
Computer models can be as simple or as complicated as required. It depends on what part of a system you're looking at and its complexity. A simple model might consist of a few equations on a spreadsheet. Complex models, on the other hand, can run to millions of lines of code. Designing them involves intensive collaboration between multiple specialist scientists, mathematicians and top-end coders working as a team.
Modelling of the planet's climate system dates back to the late 1960s. Climate modelling involves incorporating all the equations that describe the interactions between all the components of our climate system. Climate modelling is especially maths-heavy, requiring phenomenal computer power to run vast numbers of equations at the same time.
Climate models are designed to estimate trends rather than events. For example, a fairly simple climate model can readily tell you it will be colder in winter. However, it can’t tell you what the temperature will be on a specific day – that’s weather forecasting. Weather forecast-models rarely extend to even a fortnight ahead. Big difference. Climate trends deal with things such as temperature or sea-level changes, over multiple decades. Trends are important because they eliminate or 'smooth out' single events that may be extreme but uncommon. In other words, trends tell you which way the system's heading.
All climate models must be tested to find out if they work before they are deployed. That can be done by using the past. We know what happened back then either because we made observations or since evidence is preserved in the geological record. If a model can correctly simulate trends from a starting point somewhere in the past through to the present day, it has passed that test. We can therefore expect it to simulate what might happen in the future. And that's exactly what has happened. From early on, climate models predicted future global warming. Multiple lines of hard physical evidence now confirm the prediction was correct.
Finally, all models, weather or climate, have uncertainties associated with them. This doesn't mean scientists don't know anything - far from it. If you work in science, uncertainty is an everyday word and is to be expected. Sources of uncertainty can be identified, isolated and worked upon. As a consequence, a model's performance improves. In this way, science is a self-correcting process over time. This is quite different from climate science denial, whose practitioners speak confidently and with certainty about something they do not work on day in and day out. They don't need to fully understand the topic, since spreading confusion and doubt is their task.
Climate models are not perfect. Nothing is. But they are phenomenally useful.
Please use this form to provide feedback about this new "At a glance" section. Read a more technical version below or dig deeper via the tabs above!
Further details
Climate models are mathematical representations of the interactions between the atmosphere, oceans, land surface, ice – and the sun. This is clearly a very complex task, so models are built to estimate trends rather than events. For example, a climate model can tell you it will be cold in winter, but it can’t tell you what the temperature will be on a specific day – that’s weather forecasting. Climate trends are weather, averaged out over time - usually 30 years. Trends are important because they eliminate - or "smooth out" - single events that may be extreme, but quite rare.
Climate models have to be tested to find out if they work. We can’t wait for 30 years to see if a model is any good or not; models are tested against the past, against what we know happened. If a model can correctly predict trends from a starting point somewhere in the past, we could expect it to predict with reasonable certainty what might happen in the future.
So all models are first tested in a process called Hindcasting. The models used to predict future global warming can accurately map past climate changes. If they get the past right, there is no reason to think their predictions would be wrong. Testing models against the existing instrumental record suggested CO2 must cause global warming, because the models could not simulate what had already happened unless the extra CO2 was added to the model. All other known forcings are adequate in explaining temperature variations prior to the rise in temperature over the last thirty years, while none of them are capable of explaining the rise in the past thirty years. CO2 does explain that rise, and explains it completely without any need for additional, as yet unknown forcings.
Where models have been running for sufficient time, they have also been shown to make accurate predictions. For example, the eruption of Mt. Pinatubo allowed modellers to test the accuracy of models by feeding in the data about the eruption. The models successfully predicted the climatic response after the eruption. Models also correctly predicted other effects subsequently confirmed by observation, including greater warming in the Arctic and over land, greater warming at night, and stratospheric cooling.
The climate models, far from being melodramatic, may be conservative in the predictions they produce. Sea level rise is a good example (fig. 1).

Fig. 1: Observed sea level rise since 1970 from tide gauge data (red) and satellite measurements (blue) compared to model projections for 1990-2010 from the IPCC Third Assessment Report (grey band). (Source: The Copenhagen Diagnosis, 2009)
Here, the models have understated the problem. In reality, observed sea level is tracking at the upper range of the model projections. There are other examples of models being too conservative, rather than alarmist as some portray them. All models have limits - uncertainties - for they are modelling complex systems. However, all models improve over time, and with increasing sources of real-world information such as satellites, the output of climate models can be constantly refined to increase their power and usefulness.
Climate models have already predicted many of the phenomena for which we now have empirical evidence. A 2019 study led by Zeke Hausfather (Hausfather et al. 2019) evaluated 17 global surface temperature projections from climate models in studies published between 1970 and 2007. The authors found "14 out of the 17 model projections indistinguishable from what actually occurred."
Talking of empirical evidence, you may be surprised to know that huge fossil fuels corporation Exxon's own scientists knew all about climate change, all along. A recent study of their own modelling (Supran et al. 2023 - open access) found it to be just as skillful as that developed within academia (fig. 2). We had a blog-post about this important study around the time of its publication. However, the way the corporate world's PR machine subsequently handled this information left a great deal to be desired, to put it mildly. The paper's damning final paragraph is worthy of part-quotation:
"Here, it has enabled us to conclude with precision that, decades ago, ExxonMobil understood as much about climate change as did academic and government scientists. Our analysis shows that, in private and academic circles since the late 1970s and early 1980s, ExxonMobil scientists:
(i) accurately projected and skillfully modelled global warming due to fossil fuel burning;
(ii) correctly dismissed the possibility of a coming ice age;
(iii) accurately predicted when human-caused global warming would first be detected;
(iv) reasonably estimated how much CO2 would lead to dangerous warming.
Yet, whereas academic and government scientists worked to communicate what they knew to the public, ExxonMobil worked to deny it."
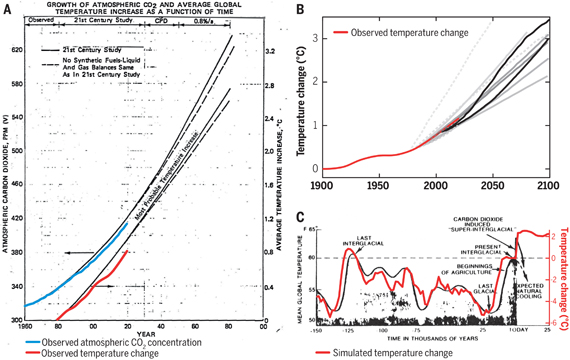
Fig. 2: Historically observed temperature change (red) and atmospheric carbon dioxide concentration (blue) over time, compared against global warming projections reported by ExxonMobil scientists. (A) “Proprietary” 1982 Exxon-modeled projections. (B) Summary of projections in seven internal company memos and five peer-reviewed publications between 1977 and 2003 (gray lines). (C) A 1977 internally reported graph of the global warming “effect of CO2 on an interglacial scale.” (A) and (B) display averaged historical temperature observations, whereas the historical temperature record in (C) is a smoothed Earth system model simulation of the last 150,000 years. From Supran et al. 2023.
Updated 30th May 2024 to include Supran et al extract.
Various global temperature projections by mainstream climate scientists and models, and by climate contrarians, compared to observations by NASA GISS. Created by Dana Nuccitelli.
Last updated on 30 May 2024 by John Mason. View Archives


CommonSense @1099,
I will read your comment less literally than Eclectic @1100.
The instrument temperature records becomes less extensive the further we run back in time, eventually measuring just Western Europe, Eastern US & a record in India. And then they require the invention of thermometers so there are none before the 1700s. But there are proxy measurements that show us (with the few temperature records) that global temperature was cooler in those times.
The proxy data on its own allows us to see that it was warm back a few thousand years ago (the Holocene Thermal Maximum) and warmer still 100,000 years ago (the Eemian Thermal Maximum). Before that, to find it hotter still, you have to go back millions of years to the time when North & South America were joining together and there was no Arctic Sea Ice. But one difficulty in a definitive ruling about how hot these periods were relative to today is calibrating those proxy data with instrument data. The evidence is pointing to today being hotter than the Holocene Maximum but not as hot as the Eemian, athough we soon would be if we allow AGW to run its course. And the present warming is sudden relative to the arrival of those earlier warm periods.
As for the thermal effect of solar panels. The panels must surely absorb more solar energy than the land without the panels. And a portion of that extra heating will replace fossil fuel use. As fossil fuel use results in higher CO2 levels in the atmosphere, that portion of extra heating by the panels results in an annual reduction in warming at least equal to that portion of extra heating. So after 10 years, the CO2 from the fossil fuels would have beeen warming the planet 10x more than the extra heating.
Mother Nature will surely take care of the planet in the long run. But the mass extinction humanity is generating in the meantime will be very destructive, for humanity as well as for the natural world.
CommonSense @ 1099
Yes, we often hear things like e g "this year is the hottest year since 1898". But that does not mean that 1898 was hotter. It usually only means that the data set referred to starts at 1898. So the phrase is shorthand for "this year is the hottest year in the entire data set upto this year. And that data set starts in 1898".
Note to others: And that's a good reason to avoid that ambiguous way of phrasing. Because if you try to interpret it using only your common sense you may get it all wrong.
And where have you 'often' heard, "this year is the hottest year since 1898"?
The pattern "hottest year since VXYZ" is rather usual. As an example we can go to NOAA's web-site for presenting time series for global land and ocean temperature anomalies at https://www.ncdc.noaa.gov/cag/global/time-series/globe/land_ocean/ytd/12/1880-2019. You can see that the particular data set presented there is from 1880 upto now. And in this set there are new annual top records lately set in 2014, 2015 and 2016. Those years it was correct to refer to this data and say "this is the hottest year since 1880". And there are of course other data sets, global and regional, so other years are possible.
I tried to net-search (with Google) for some instances of this pattern. I found:
"hottest year since 1880" 18900 hits
"hottest year since 1895" 59 hits
"hottest year since 1896" 14 hits
"hottest year since 1900" 51 hits
"hottest year since 1901" 97 hits
"hottest year since 1909" 11 hits
"hottest year since 1910" 28 hits
But the point is that if I say "2016 was the hottest year since 1880" that could make someone believe that I mean that 1880 was hotter. I most certainly do not mean that. So I avoid that particular wording.
Ignorant Guy @1104,
You are entirely correct to say that the problem is the use of the phrase "hottest year since X" when what is meant is "hottest year on record" when X is the start-year of that record. Looking at a few of those thousands of Google hits, the phrase usually does not track back to 'responsible' organisations but it seems to be later reporting when journalist-speak for "hottest year on record" & "the record began in X" is edited down to a shorter phrase.
There is ClimateChangeNews who use the headline "Earth on course for hottest year since 1880" yet NOAA put it as the likely "new record for the warmest annual average temperature since records began in 1880." Note this NOAA statement is correct. The ClimateChangeNews headline is not correct -1880 was a lot colder than the year they were reporting about - 2015.
Mind, the press officers attached to the likes of NOAA or NASA are also journalists and not immune to compressing information into a single but inaccurate statement. Although the article does say "Last year was the third consecutive year in which global temperatures were more than 1.8 degrees Fahrenheit (1 degree Celsius) above late nineteenth-century levels," it also promenantly says "Earth’s global surface temperatures in 2017 ranked as the second warmest since 1880, according to an analysis by NASA."
But even so, you'd surely have to be a bit of a foolish pedant to run away with the belief that 1880 was as warm or warmer than today's temperatures, even if you inhabited that contrarian planet Wattsupia.
MA Rodger @ 1105
Yes, I would tend to agree. But I have seen it a lot. And recently.
Actually I strongly suspect that CommonSense @ 1099 is afflicted by precisely that misunderstanding.
Dana's YouTube graphs are spectacular!
I've been looking for such model comarisions that show years 2016, 2017, 2018 because most everthing I find is way out of date and shows the models being too high. I'd love to see those graphs directly on this site, since I'd rather use skepticalscience.com for a reference thanYouTube.
If the models are making predictions of between 1 and 4.5 degrees change per doubling, then they are unreliable. This is a 450% variance. There can only be one answer to how much, if anything, CO2 is contributing to the climate. Why are the models coming up with such different results? Why are they coming up wth multiple answers to the same question?
[PS] Please dont spam multiple threads. Best to discuss one thing on a thread that you think is important and when satisfied, move to another. (And how do calculate 450% - what is your denominator). Meanwhile, this post from people who do the modelling might be helpful. While models have flaws, they remain the best tool we have for predicting the future - far better than say chicken entrails or assuming tomorrow will be same as today.
Just some food for thought... These published studies raise plenty of questions about the validity of the the models being used and the accuracy of the historical data being inserted into them.
The role of historical forcings in simulating the observed Atlantic multidecadal oscillation
Inability of CMIP5 Models to Simulate Recent Strengthening of the Walker Circulation: Implications for Projections
[DB] Please be specific and provide a rationale for each of the studies you linked to and why you feel that they support your claims.
Weaknesses with models is hardly news - ask any modeller. what you are looking at is the processes by which models get better. Numerous studies have shown that basically models suck at regional-level prediction for reasons including difficulties with ocean circulation. They are also hopeless at decadal-level prediction. If the models were better, we would have such a wide range on ECS estimates.
However the models have plenty of skill at many other important variables and are by far the best tools we have for predicting future climate (ie 30-year averages).
How reliable are IPCC 5th Assessment Predictions? Were they smarter than a 5th grader?
First the IPCC--Predictions are based on the assumption that CO2 is a primary driver of earth surface air temperatures. Because it has been extremely easy to to predict CO2 levels going forward from 2006, the baseline year for the IPCC 5th, the predictions would not have significantly changed if 12 years later, the actual CO2 levels were inserted (no assumptions) and the predictions recast. Given that, the average IPCC error from 2007 through 2018 was .14 degrees C.
5th Grader: Let's pick a panel of 5th grader that is smart enough to know that they have no clue as to what next years global earth temperature is going to be. So they decide to guess the prior years temperature. Given that, the average 5th Grader error from 2007 through 2018 was .07 degrees C--twice as accurate as the IPCC Model.
Here is the data.
IPCC 5th Model Errors Avg Abs Errors
Avg Err 0.072 0.145
Temperature Model Errors
Yr NASA IPCC No Idea Model
1970 (0.13)
…
2006 0.48 0.57
2007 0.44 0.58 0.04 0.14
2008 0.38 0.59 0.06 0.21
2009 0.47 0.62 0.08 0.15
2010 0.53 0.64 0.06 0.11
2011 0.45 0.65 0.08 0.20
2012 0.48 0.68 0.03 0.20
2013 0.50 0.74 0.02 0.23
2014 0.59 0.76 0.09 0.16
2015 0.71 0.75 0.12 0.05
2016 0.82 0.79 0.12 0.04
2017 0.72 0.80 0.11 0.09
2018 0.65 0.81 0.07 0.16
2019 0.83
Can it be argued that the 5th graders cheated by reassessing every year. Sure. But two facts do not change.
1) IPCC could have used actual CO2 data and not improved accuracy.
2) If physics is at all understood, any model based on sound physics should be able to beat the static forecast (e.g., a ball being thrown with elevation above ground being predicted).
[DB] "Predictions are based on the assumption that CO2 is a primary driver of earth surface air temperatures"
You clearly didn't read the post. Models are built using physics and observations; predictions coming from them are an outgrowth of that. While imperfect, they are demonstrably reliable. The radiative physics of greenhouse gases like CO2 are well-researched, well-established and accepted by every international science body of note and by the petroleum extraction companies themselves.
Simply making things, as you do, up is unhelpful. Please cite sources for claims, per the Comments Policy.
Inflammatory snipped.
Please limit image widths to 450.
As someone new to this site and still in the early stages of reviewing the issues, I would be greatful if someone could explain in detail where the errors in this talk by Dr J Christy are (if any).
https://www.thegwpf.com/putting-climate-change-claims-to-the-test/
[RH] Activated link.
rupisnark @1112,
A first indication that there will be a great many "errors" is the author of this talk you ask about. John Christy is not known for presenting factual accounts of AGW. And a second indication is the audience. The GWPF is allegedly a UK-based educational charity but they fell foul of the UK Charity Commission and now all the really dodgy stuff is posted, as is this talk, by the 'Forum' rather than the 'Foundation' (although dodgy stuff predominated on both).
I would say that John Cristy's GWPF talk is an untrustworthy account from beginning to end. As it runs to over 7,000 words I will address just the beginning and the end. He parting comments are saying that some doomy predictions from 1970 which proved to be entirely wrong mean that all doomy predictions are wrong. I hope the logical fallacy in such an argument is obvious.
And his first graphic is also shot through with nonsense. Christy tries to make AGW appear insignificant by saying that the effect of CO2 is only 0.5 'units' within a diagram showing energy fluxes measured in very large numbers of 'units'. Yet, even though Christy is simply adapting an IPCC AR5 graphic, he still manages to make some fundamental scientific errors. This is not unusual with John Christy.
Perhaps most profound is his assertion that the energy fluxes balance at the surface which is not true on Planet Earth, as the IPCC graphic makes plain.
Another scientific howler in this first graphic is his annotation "Atmosphere (~750 million units)". He presummably means to say that the atmosphere contains 750 million x 3.4 = 2,550 million joules of thermal energy per square but he is saying watts per square metre which simple jibberish. The atmosphere's thermal energy is roughly something like 2,550 million j/sq m and with the 0.5 'units' from "extra CO2", Christy tries to show the impact of CO2 as being insignificant ("small numbers" as he calls it). But 0.5 'units' would amount to 0.5 x 3.4 x 8766 x 3600 = 54 million j/sq m in a single year. It would take a bit of a fool to dismiss this as "small numbers", but then we are talking about John Christy.
MA Rodger @1113. I am trying to work out for myself the truth and have little time for personal attacks. You may not like Christy's opinions but he was a lead author on one of chapters of one of the previous IPCC reports and has a distinguished academic record. He has doen imprtant work in relation to satellite data and worked to correct errors that he admitted he made. Are lead authors of IPCC reports not to be trusted? He may be wrong, but please stick to evidence not personal attacks.
I will review in detail the criticisms of the points you have made. I would like to understand which of his points you are willing to conceed, where he is exaggerating and where he is downright wrong.
My limited study so far has found distortions of information from both sides. Please help me to ascertain whether the distortions come from both sides equally or 90% from one side.
Rupisnark:
John Christy and his scientific positions were discussed at Skeptical Science in 2011 here. His position has not changed since then.
I note that the globe has warmed sigificantly since 2011 in contradiction to Christy's position.
rupisnark @1114,
You must forgive me my intolerance of those in the scientific & political community that remain imprisoned in climate change denial. Yet you do bring a real humdinger of climate change denial here for comment. Christy makes many many 'points' in that GWPF talk and he is pretty-much wrong it all of it.
I could continue down the many arguments he makes but how long have you got?
Consider the second point (The nonsense of the first point I dealt with up-thread @1113.), the graphic "What's happening at the surface?"
This second graphic shows a very small "Extra CO2" effect. This likely makes sense only if this tiny box represents the imbalance in the surface energy flux which is causing AGW. If it is meant to represent the impact of the AGW-induced warming, the box should be roughly the size of the cooling "Heat Flux" box and also have a cooling box the same size to balance.
The second graphic as-presented is scientific nonsense. But as that is really only repeating the incompetence of the first graphic, perhaps I should consider the third argument set out by Christy.
So graphic number three which makes sense to also consider graphic number four. This bring quite a lot of stuff into the discussion - Christy & McNider (1994) and Christy & McNider (2017) as well as Hansen et al (1998). But without getting too deep into all this, the bottom line is that Christy makes two crazy mistakes. Firstly Christy grossly misprepresents Hansen et al (1988) both in his GWPF talk and in Christy & McNider (1994). Hansen et al did not predict a +0.35ºC/decade temperature trend as Christy states (see this SkS post). Secondly Christy & McNider (2017) attempts to expunge ENSO & volcanic effects from the UAH TLT satellite temperature record but in doing so also manage to expunge much of the warming signal of AGW. Thus a trend of +0.16ºC/decade in UAH v5.6 is converted into +0.095ºC/decade. Exactly how Christy & McNider achieve this would require some detailed analysis. Certainly their use of NINO1+2 and NINO3 as an ENSO signal is one possible cause as these two SST series do contain an AGW signal.
---
Certainly I would concede nothing regarding Christy's work without first checking it out. His work is totally untrustwothy.
And if you wish to check out "distortions of information from both sides", perhaps addressing the apparent distortions on the other non-denialist "side" would be a better appraoch.
MA Rodgers @1113
The substantive criticism you made was relating to the his first graphic. You compare that to the linked graphic. The two appear to me to be saying similar things (but see below), at first glance Christy’s is simpler to read (which would make sense as it was based on a talk to laymen); the use of units puts numbers into percentage terms which makes everything simpler. Since the 750 million units is not mentioned in the text, it seems irrelevant to spend time making conjectures over what you or I think it might mean. I may try to contact Christy or GWPF to understand if it seems important later (not sure if I will get any answers).
Then there are the issues that are worth discussing. The imbalance of 0.6W/m2 (0.18 units?), the statement that at the surface it is in balance, and the claim that 0.5 units is caused by extra CO2 whereas 100 units is caused by H20, clouds and aerosols (and not mentioned but presumably also existing CO2). Have I understood this correctly? What are the errors in what Christy has said?
[RH] Same.
MA Rodgers @ 1116
Using terms like “climate change denial” does not help my understanding of what is going on, instead it undermines my trust in the people who use the term. I started out with the view that the consensus was probably right about global warming happening and being man-made, but that the solutions so far implemented and being proposed were not terribly good and, in my cases, counterproductive. The tone of this website should be to encourage questions and let people work out for themselves whether people like Christy know what they are talking about or not. “I bring a hum-dinger of climate change denial.” Throwing mud at a former IPCC lead author is more likely to bring into question the whole IPCC process than to make people reject arguments without understanding the issues.
“Christy & McNider (2017) attempts to expunge ENSO & volcanic effects from the UAH TLT satellite temperature record but in doing so also manage to expunge much of the warming signal of AGW.”
Does this paper follow the same methods that they used in 1994? Was Christy trying in 1994 to argue that Global Warming was not occurring (or was occurring at a lower rate)? Did the 1994 paper suggest this?
“Certainly their use of NINO1+2 and NINO3 as an ENSOsignal is one possible cause as these two SST series do contain an AGW signal.”
I do not understand this. Please give me the appropriate background reading and I will get up to speed on it.
“I could continue down the many arguments he makes but how long have you got?” I will look at all the arguments you put up.
And if you wish to check out "distortions of information from both sides", perhaps addressing the apparent distortions on the other non-denialist "side" would be a better appraoch.
Your website and many others already do that job.
[RH] I hope you don't mind, I added line breaks between your paragraphs to make them a little easier to read. Thx.
rupisnark @1117/1118,
In reverse order.
1118
♣ "Your website ... already do(es) that job." Firstly, SkS is not my website. Secondly, SkS addresses distortions that are prediminantly of 'denialist' origin, not "non-denialist". The non-denialist distortions would be a more interesting subject, if you know of any.
♣ Whether you have the time to cope with all the nonsense served up by Christy, or not. We haven't got very far with the content of this Christy talk in more than one iteration. And there is the question of whether I (or others) could be fussed to continue untangling the garbage fo you into chunks you will understand.
♣ NINO1+2 & NINO3. Note these Sea Surface temperatures (which C&M 2017 appears to say it uses to subtract ENSO from its TLT record) are not de-trended (as for instance the AMO is) so they do still have an AGW signal. Subtracting the NINO signals will thus also subtract some AGW signal.
♣ Does C&M(1994) repeat the method of C&M(2017)? The implication is that it does (note that I have not access to C&M1994) but one difference is the UAH TLT v5.6 record was not used in 1994 as it didn't exist. The corrections to the UAH data set (mainly not the result of work by the UAH team) would have made significant changes to the 1994 result. So it is strange that C&M(2017) only finds a very small difference.
♣ Christy was one of six lead authors of Chapter 2 of IPOCC WG1 TAR (1990). Note the prmary finding of that chapter "The warming rate since 1976, 0.17°C/decade." This contradicts the primary finding of both C&M(1994) and C&M(2017).
♣ The GWPF are anti-scientific to the point of being bare-faced liars. I will be happy to demonstrate that fact if you are interested. If Christy is happy to give the GWPF the time of day, he will get no respect from me!!!
1117
♣ Have you understood correctly? What we can call Slide 1 of Christy (2019) is saying AGW is trivial to the point of insignificance. That is not borne out by the science. And denying the energy imbalance is pretty unforgiveable. You bat the "~750 Million Units" into the long grass but there is also the "6 trillion" which is part of the talk transcript While the 750M quantity could be considered as the rough total (that's total as in down to absolute zero) heat content of the atmosphere per sq metre of the planet, the 6T quantity would be 80 times more than the equivalent for the oceans (which are usually considered the largest thermal pool the climate has to cope with). So what the 6T quantity is supposed to be, I know not. I assume it is just meant to appear very very big.
♣ Slide 1 of Christy (2019) says it takes the values from AR5 Fig 2.11. It is Christy's comparison, not mine.
MA Rodgers @1119
Re response to @1117
♣ ….You bat the"~750 Million Units" into the long grass but there is also the "6 trillion" which is part of the talk transcript While the 750M quantity could be considered as the rough total (that's total as in down to absolute zero) heat content of the atmosphere per sq metre of the planet, the 6T quantity would be 80 times more than the equivalent for the oceans (which are usually considered the largest thermal pool the climate has to cope with). So what the 6T quantity is supposed to be, I know not. I assume it is just meant to appear very very big.
->6trillion. As a guess, could the heat content of the Earth might be the figure he is referring to? The mass of the earth is more than 4*10^6 times bigger than the mass of the water on earth, so it is within a few orders of magnitude! I have no idea how much heat transfer is going on between the oceans and the rest of the Earth, there would obviously be different speed of change issues compared to atmosphere/ocean and atmosphere/Earth’s surface. Happy to be shot done on this one if my guess is unreasonable.
♣ Slide 1 of Christy (2019) says it takes the values from AR5 Fig 2.11. It is Christy's comparison, not mine.
->I was not sure whether you did or didn’t agree with my previous summary of the point:-
The imbalance of 0.6W/m2 (0.18 units?), the statement that at the surface it is in balance, and the claim that 0.5 units is caused by extra CO2 whereas 100 units is caused by H20, clouds and aerosols (and not mentioned but presumably also existing CO2).
I understand you do disagree with the 6tr figure (and 750 units).
[I may appear to be slowly going through certain points, but I have learned from experience in many different fields, that this is an effective method of reaching a proper understanding, clarifying where difference of opinion lie and exposing falsehoods (which I believe is also one of the aims of this website).]
Re response to @1118
♣ The non-denialist distortions would be a more interesting subject, if you know of any.
->I am making a list of them. I will then contact the people who appear to have distorted matters to enable them to respond (and if I have misunderstood, to enable me to correct my misunderstandings). I want to see who is distorting matters, not to add to the many distortions already floating around.
♣ Whether you have the time to cope with all the nonsense served up by Christy, or not. We haven't got very far with the content of this Christy talk in more than one iteration. And there is the question of whether I (or others) could be fussed to continue untangling the garbage of you into chunks you will understand.
->We have not got far because your initial response only discussed one of the many points raised in the lecture. The more points you can answer the quicker I will understand. I have come to this forum with the aim of checking for myself some claims which have extraordinary consequences and if the claims made by your side of the debate were wrong could reduce GDP in 50 years time by well in excess of current world GDP. If true it could have the widely discussed consequences.
[https://www.theguardian.com/environment/2019/jun/06/cutting-uk-emissions-net-zero-cost-1tn-philip-hammond…. I am taking a 1% reduction in global GDP pa to combat global warming… again estimates vary widely.]
If you do not wish to respond fully, I can understand that; but don’t then complain that the public are not willing to reduce their own and their children’s standard of living for a cause that have less than complete faith in.
♣ Note these Sea Surface temperatures (which C&M 2017 appears to say it uses to subtract ENSO from its TLT record) are not de-trended (as for instance the AMO is) so they do still have an AGW signal. Subtracting the NINO signals will thus also subtract some AGW signal
->I need to read further on this point. References welcome.
♣ Does C&M(1994) repeat the method of C&M(2017)? The implication is that it does (note that I have not access to C&M1994) but one difference is the UAH TLT v5.6 record was not used in 1994 as it didn't exist. The corrections to the UAH data set (mainly not the result of work by the UAH team) would have made significant changes to the 1994 result. So it is strange that C&M(2017) only finds a very small difference
->You seem to have a good point here… I will try to get hold of Christy at some point and challenge him on this and other matters. ( I have no idea if he will respond).
♣ Christy was one of six lead authors of Chapter 2 of IPOCC WG1 TAR (1990). Note the prmary finding of that chapter "The warming rate since 1976, 0.17°C/decade." This contradicts the primary finding of both C&M(1994) and C&M(2017).
->He could agree with that conclusion and his 1994 and 2017 papers could still be valid, given for example that he is adjusting for Volcanic and El Nino effects and there may be other caveats in the paper; so I am not sure that it does contradict those findings.
♣ If Christy is happy to give the GWPF the time of day, he will get no respect from me!!!
->I have no idea what Christy’s views of the GWPF are. I don’t think Christy gets any respect from you anyway, given your previous comments. Again, I would rather that we just discuss issues, adding this type of comment is not helpful.
rupisnark @1120,
We discuss the serious error in John Christy's June 2019 GWPF talk. I could start running through the points @1120 and setting the record straight but as #1120 was the outcome of a previous record-straightening exercise @1119, I don't think a further round of record-straightening would achieve anything more than add to the length of this comment thread.
Perhaps then, rather than demonstrate the utter incomeptence engendered within the grand denialist presentation set out in John Christy's June 2019 GWPF talk (my original idea), perhaps it would be best to describe the nub of his theorising and why it is failing to establish itself. Note that this will be a little more technical than simple identification of gross error within his talk (error which was not of itself fundamental to Chrisity's argument).
Happily, this will be on-topic for this thread as Christy does attempt to refute the reliability of climate models.
Climate models have developed in complexity through the dacades. They all (simple and complex) show the same basic result from AGW. This result is disputed by Christy using a rather narrow argument. Christy first dismisses the performance of these various models at reproducing the global average surface temperature (GAST) increase. He insists "models are often adjusted to broadly match its (GAST's) evolution over time." GAST is thus, according to Christy, not an independent measure and thus should not be used to test the models (McKitrick & Christy 2018).
This argument is repeated by Christy in his June 2019 GWPF talk:-
(The actual abilities through the decades of the various models at projecting GAST is briefly reviewed by CarbonBrief.)
Instead of GAST, Christy uses specifically "the temperature of the atmosphere between 30,000 and 40,000 feet in the tropics, 20oN to 20oS." Given his insistence on not testing on 'Friday' what had been shown on 'Monday', Christy's choice is particulalry poor. His choice coincides with the long contentious "tropical hotspot" which has been argued over for decades. (So Christy is effectively testing on 'Friday' what had been shown on 'Monday'). And the "tropical hotspot" isn't a marker of AGW but of warming generally. I don't think Christy disputes that is happening. And as for measuring it to check whether it is there and to what extent, that introduces yet another layer of great uncertainty. (See this SkS post of 2009. And Christy in not addressing uncertainty plus other failings is considered by this 2016 post at RealClimate.)
So it is true that our present measurements suggest the "tropical hotspot" isn't as vigourous as expected, at its upper altitudes (although present at its lower altitudes).
Christy attempts to use the uncooperative "tropical hotspot" as some sort of essential failing of CMIP5 models and by implication as an essential failing of all models. As set out above, such attempts are poorly contrived and to-date even a corrected argument is far from unconvincing.
MA Rodger @1121 ,
thank you for the link to McKitrick & Christy 2018. The paper suffers from major logical non-sequitur in arguing from the status of the high altitude Upper Troposphere (which he elsewhere misrepresents as the lower troposphere "TLT" ) instead of examining the planetary surface temperature and (even more important) the ocean heat content. Severe cherry-picking . . . as well as poor logic.
Thank you also for the link to Dr Christy's talk at the GWPF (actually given in May 2019, not in June). Much of the earlier part, as well as the middle part, must have been as clear as mud to most of the audience !
The talk contained the same logical fault as the McK & C 2018 paper . . . and then expanded into a great deal of waffle. And then finalized with poor analysis of storms and Californian wildfires . . . and with much irrelevant but emotion-charged rhetoric (including how Christy's Californian land-holder neighbour had dishonestly moved Christy's property-boundary marker peg ~ ??possibly a metaphor for all those dishonest mainstream scientists at the IPCC?? )
Irrelevancies, poor science, and demagogic rhetoric ~ just another ordinary day at the GWPF.
Considering that Dr Christy makes similar misleading presentations at senate/congressional committee hearings . . . it comes as no surprise that he was "uninvited" to return to contributing to the IPCC.
the climate is changing very fast, so these models can not be 100% accurate.
Strange comment. Models predict that climate is changing fast so I dont see how rapid change makes them wrong. However, no climate modellers is claiming that models are 100% accurate. Not even close. They have no skill at decadal level prediction but do at climate (30 year average) level. Climate sensitivity estimates are still too wide for comfort (2-4.5), however, they remain the best tools we have for predicting further climate.
MA Rodgers @1121
Thank you for your post. The second part of which was useful.
On the first part, the reason I keep up questions is to try to pin down the areas of disagreement. From that point it is possible to proceed. The fact that you will not clarify certain points raises to progress the discussion when I expected that you could have put to bed the issue is slightly concerning. Is the heat content of the Earth rather than the ocean relevant?
So if you could please respond to all my points raised in @1120 Re response to @1117, I would be grateful.
♣ We cannot use the surface temperature, because the surface temperature record was used in the development of the model.
->Whatever else Christy says he and McKitrick are right on this point. In numerous fields I have seen models developed based on past data which were no more than data mining. Once inspected the models and they are often nonsense. If this is what the climate models are doing, then they have a long way to go before they can be relied on to make sensible predictions.
The 4 general conditions laid out in McKitrick & Christy in the introduction seem sensible. Would any of the 102 climate models pass them?
♣ (The actual abilities through the decades of the various models at projecting GAST is briefly reviewed by CarbonBrief.)
->This link does not appear to work.
♣ And Christy in not addressing uncertainty plus other failings is considered by this 2016 post at RealClimate.)
->This is an excellent post. Very helpful and can be understood in 5 minutes. The graphs he generates give a very good picture of how wide the potential disagreement would be, (if it weren’t for the other potential issues you have made about Christy's argument).
-> One thing that neither side of the “debate” see is that people on the other side genuinely believe what they are saying is true and do not believe they are being influenced by issues such as their reputation and previous statements/papers, financial incentives (whether big oil money or academic research grants) or peer pressure. As an example, issue (2) is the sort of thing that many people on both sides of this debate might do inadvertently to save time or deliberately to strengthen their arguments. If doing inadvertently and the result went the other way to the way they wanted, they may well notice the issue and correct it.
♣ See this SkS post of 2009.
->This will need a few re-reads as not as well written as the Real Climate post.
♣ And the "tropical hotspot" isn't a marker of AGW but of warming generally.
-> Just to be clear, is it or isn’t it a prediction of the 102 warming models? [Perhaps on the third reading of the SkS 2009 it will be clear to me – Apologies if I missed something obvious but at second reading it appears to be saying that the hotspot is NOT the key marker, but that the models do predict it].
Does the following summarise the position correctly?
1) Tropical hotspots are said to NOT be a signature of AGW (as opposed to global warming generally) BUT they occur in the output of most/all of the climate models.
2) There is some uncertainty as to whether the hotspots exist, although the majority of the evidence suggests they do.
3) If the hotspots do not exist, then climate models will need to be refined, possibly need a greater re-work. (This does not mean their outputs are completely wrong)
♣ His choice coincides with the long contentious "tropical hotspot" which has been argued over for decades.
->Isn’t the period Christy has chosen a little longer than this? [Again, happy to be shown to be wrong]
♣ Christy attempts to use the uncooperative "tropical hotspot" as some sort of essential failing of CMIP5 models and by implication as an essential failing of all models. As set out above, such attempts are poorly contrived and to-date even a corrected argument is far from unconvincing.
->From what I have seen so far (a long way to proper understanding), his argument while not totally convincing is not entirely without merit.