


 Arguments


Does CO2 always correlate with temperature (and if not, why not?)
What the science says...
| Select a level... |
 Basic
Basic
|
 Intermediate
| |||
|
Surface temperature measurements are affected by short-term climate variability, and recent warming of deep oceans |
|||||
Climate Myth...
There's no correlation between CO2 and temperature
"Twentieth century global warming did not start until 1910. By that time CO2 emissions had already risen from the expanded use of coal that had powered the industrial revolution, and emissions only increased slowly from 3.5gigatonnes in 1910 to under 4gigatonnes by the end of the Second World War.
It was the post war industrialization that caused the rapid rise in global CO2 emissions, but by 1945 when this began, the Earth was already in a cooling phase that started around 1942 and continued until 1975. With 32 years of rapidly increasing global temperatures and only a minor increase in global CO2 emissions, followed by 33 years of slowly cooling global temperatures with rapid increases in global CO2 emissions, it was deceitful for the IPCC to make any claim that CO2 emissions were primarily responsible for observed 20th century global warming." (Norm Kalmanovitch).
At a glance
If you happen to be reading something about climate change in the popular media, be sure to keep an eye out for certain words. The one in this case is 'deceitful'. Why? Because it's an emotive word. It's a good sign that the writer is not a scientist but someone with a political axe to grind.
The heat-trapping properties of carbon dioxide, water vapour and other greenhouse gases were identified over 160 years ago. After that, climate research continued unhindered for many decades. However, by the second half of the 20th century the seriousness of the threat of climate change was well-understood. That led in due course to the involvement of bodies such as the United Nations. Treaties such as the Kyoto Protocol of 1997 followed.
In response, the fossil fuels sector and their political and media associates, perceiving threats to profitability, turned climate science into a political football. With climate science thus politicised, the arena within which research and outreach were conducted had changed. This was no longer a quiet backwater.
That's the historical context. Now we can get to the meat of the myth. The quote above this piece dates from September 2009. Apart from anything else, it's 14 years out of date now. Globally, the ten warmest years since 1880 have all occurred since the statement was made. According to NASA’s Goddard Institute for Space Studies, the average global temperature has increased by 1.4° Celsius (2.5° Fahrenheit) since 1880.
However, global temperature does not correlate exactly with CO2 emissions on a year in, year out basis.There are other well-understood factors that can warm or cool the climate over such short-term periods. You may have heard of El Nino and La Nina. These phenomena involve above- or below-average sea surface temperatures respectively, in the central and eastern Pacific Ocean. Their effects are global.
A strong El Nino can produce a massive global temperature-spike. Such very warm years once led to people making the claim of, "no warming since 1998". Briefly sounding plausible for a few years, it soon became self-evidently incorrect.
Instead, the correct way to look at temperature trends is to examine them over multiple decades - 30 years is standard in climate science. So to answer the question, "where are we now?", one would look at the temperature record from 1992-2022. Doing so takes out the noise, the ups and downs due to El Nino, La Nina and other factors. And the trend is most certainly upwards.
To the newcomer to climate science, it can be difficult to spot misinformation. However, opinion-pieces that accuse bodies such as the Intergovernmental Panel on Climate Change (IPCC) of intentions like deceit should instantly ring alarm-bells.
It is important to point out that the motive for such political misinformation is to spread confusion and doubt. The organisations behind it simply seek delaying any meaningful action. In kicking the can down the road, they try to deflect the pressure to get their own houses in order, and to hell with the consequences.
Please use this form to provide feedback about this new "At a glance" section. Read a more technical version below or dig deeper via the tabs above!
Further details
The amount of CO2 in our atmosphere is increasing all the time. On February 26th 2024, according to the monitoring resource Daily CO2, it had exceeded 425 parts per million (ppm). That's up by 3.96 ppm since the same time last year - but more importantly, up from around 280 ppm before the industrial revolution - a 50% plus increase.
Pre-industrial levels of CO2 and other greenhouse gases, like methane and water vapour, were sufficient to keep the Earth’s surface 30°Celsius (54°F) warmer than it would have been without them. Since then, we have added 50% more CO2 - but that doesn't mean the temperature will go up by 50% too.
There are several reasons why. Doubling the amount of CO2 does not double the greenhouse effect. The way the climate reacts is also complex and it can be difficult to separate the effects of natural changes from man-made ones over short periods of time.
As the amount of man-made CO2 goes up, temperatures rise but not at the same rate. Estimates vary - climate sensitivity is a hot topic in climate science, if you’ll forgive the pun. Based on multiple lines of evidence, according to the IPCC Sixth Assessment Report (2021), the "very likely range [for climate sensitivity to doubling of CO2] is 2°C to 5°C".
So far, the average global temperature has gone up by about 1.4 degrees C (2.5 F).
"In 2023, hundreds of millions of people around the world experienced extreme heat, and each month from June through December set a global record for the respective month. July was the hottest month ever recorded. Overall, Earth was about 2.5 degrees Fahrenheit (or about 1.4 degrees Celsius) warmer in 2023 than the late 19th-century average, when modern record-keeping began."
Source: NASA.
The speed of the increase is worth noting too. Unfortunately, as this quote from NASA demonstrates, anthropogenic climate change is happening very quickly compared to changes that occurred in the past (text in bold for emphasis):
"As the Earth moved out of ice ages over the past million years, the global temperature rose a total of 4 to 7 degrees Celsius over about 5,000 years. In the past century alone, the temperature has climbed 0.7 degrees Celsius, roughly ten times faster than the average rate of ice-age-recovery warming."
Source: NASA Earth Observatory.
Small increases in temperature can be hard to measure over short periods, because they can be masked by natural variation. For example, cycles of warming and cooling in the oceans such as the El Niño-Southern Oscillation (ENSO) cause temperature changes that can mask small changes in temperature caused by CO2 emissions that occur at the same time. That's why scientists measure changes over long periods so that the effects of short natural variations can be distinguished from the effects of man-made CO2.
The rate of surface warming varies year by year, yet the physical properties of CO2 and other greenhouse gases do not change. Neither has the amount of energy arriving from the sun changed significantly in recent decades. But if that’s true, where is this heat going?
The answer is into the oceans. Fig. 1 is a graphic showing where the heat is currently going:
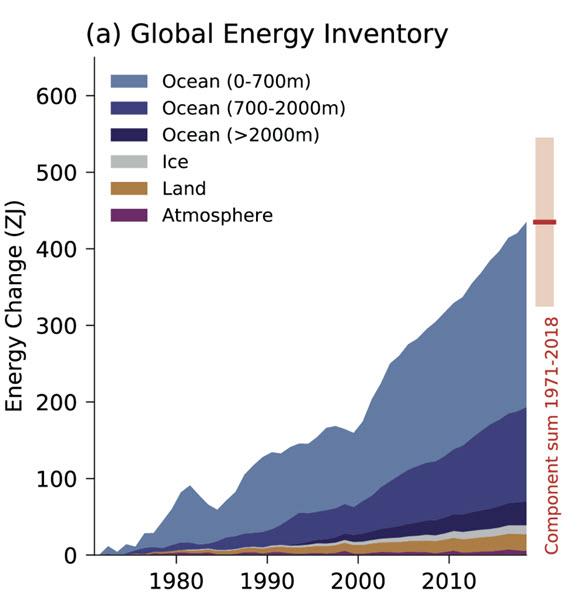
Figure 1: Global Energy Inventory: observed changes in the global energy inventory for 1971–2018 (shaded time series) with component contributions as indicated in the figure legend. Cross-Chapter Box 9.1 Figure 1 (part a) - From IPCC AR6 WGI Chapter 9.
The way heat moves in the deep oceans was poorly understood up until around the turn of the millennium. Since then, vast improvements in measurement techniques, such as the Argo float system, have allowed scientists to far more accurately gauge the amount of energy the oceans are absorbing. Argo floats, numbering several thousands, weigh 20-30 kilograms and are packed with instruments. They typically travel through the oceans around a kilometre below the surface. But they can rise up to the surface or dive down to 2 km. That makes it possible to collect profiles in terms of temperature, salinity and other parameters. So far, over two million such data-profiles have been collected.
Argo data have shown the upper 2,000 metres of the oceans has captured roughly 90% of the anthropogenic change in ocean heat content since the programme started in 1999. Temperatures in the upper 600 metres have been seen to fluctuate with shorter-term climate events like El Niño-Southern Oscillation. In deeper waters, however, there is a more consistent warming trend. In summary, the 700–2,000 metres ocean layer accounts for approximately one-third of the warming of the whole 0–2000 m layer of the World Ocean being mapped by the Argo floats.
So we know that the energy added to the climate system by man-made CO2 is not only apportioned into surface warming, because a large part of the heat goes into the oceans. The rate at which surface temperatures go up is not proportional to the rate of CO2 emissions but to the cumulative total amount of atmospheric CO2. Only by looking at long-term trends - 30 years is the standard period in climate science - can we measure surface temperature increases accurately, and distinguish them from short-term natural variation.
Last updated on 10 March 2024 by John Mason. View Archives


#99 "..but Victor seems to have suggested that he also posts at RealClimate. If he is indeed the same Victor, then over at RealClimate he has a long history of adding links to his posts that do not support what he says. From his short appearance here, I would say that the behaviour here matches. Whether his Morton's Demon prevents him from realizing they do not support his case, or he doesn't care and hopes that nobody will follow the links and therefore providing links will bamboozle people, I can't tell. Either way, if Victor claims that a reference says one thing, it wil almost certainly say something else."
Ad hominem. And by your definition also sloganeering. Please remove. Thank you.
[JH] Since you have reposted the text of the final paragraph of Bob Loblaw's comment, deleting his original text would accomplish little.
Also not ad hominem. That Victor's references rarely support what he claims they say is simply an observation, and pointing it out legitimately "relates to the credibility of statements of fact" that Victor purports to demonstrate. (Follow the WIkipedia link to see the full quote in context.) It serves as a warning to all readers: follow Victor's links and read them carefully before accepting anything he says about them.
In fact, the bulk of my comment does not say "Victor's links are usually wrong, so this one is also wrong" (which would be ad hominem), I specifically stated why that particular link does not show what Victor claims it shows. He has not (yet?) made any attempt to argue that the link does support his original claim, so it seems that he is using the "ad hominem" claim as a means to distract from the substantive issue.
[For some reason, comment #100 seems to be a duplicate of comment #98.]
New model by Poppick et al. using human and natural forcings. Amazing fit to observations. In press, but Variable Variability has a preview.
victorag @100:
1) "many" means "a large number of", and "large", like "big" and "small", is always specified relative to the population under consideration. Thus even while "a large x" is always larger than "a small x", for any given value of x, we cannot infer that a large mouse is larger than a small elephant, and large mountains (such as Everest) fit very comfortably on the surface of small planets (such as Earth). "Great" is a superlative, that amplifies the meaning of the term qualifed. Thus "a great many" is a larger quantity than "many". It follows from this that "a great many leprosy sufferers" will be a much smaller number than "a great many South Americans" and "a great many AGW skeptics" is almost certainly a larger grouping than "all climate scientists"
If we do not want to take this standard view on the use of the English language, we would have to say that a great many people live in Fordwich, even though its population is just 0.004% of that of Greater London, and it is "the smallest community by population in Britain with a town council".
This is just basic English, understood by any native speaker; and understandable by anybody competent in English. Yet you want to maintain your rhetorical point against these basic facts of grammar, even though to do so you point to a list of scientists (the majority of whom are not climate scientists) whose population is about a sixth that of Fordwich, and which represents and about a 12th of the number of "skeptical" climate scientists I indicated to exist based on statistical data.
As I said, this is really basic English. Let us put that aside, however. Based on statistical evidence, there are about 720 "skeptical" climate scientists from among a population of about 30,000. That in itself is strong evidence that those 720 odd "skeptical" climate scientists maintain their position because of non-scientific biases (something of which we have independent evidence), and that the consensus position therefore can reasonably be characterized as the position of climate science.
2) "While many skeptics have very obvious biases, if their arguments are sound, their bias can safely be ignored."
The presumption that their arguments are sound is hardly warranted. Nils Axel-Morner for example (who is on your list) has doctored the photograph of a tree to use as evidence against sea level rise. This, of course, does not mean that all of their arguments are unsound. Each must be judged on its own merits, but you are not entitled to assume the soundness of any of their arguments just from their existence as you have done.
3) "". . . logically, the claim that "GMST did not follow the predicted path given AGW" is also a theory." Again: no, not at all."
Actually, yes. In fact, true by definition of "theory":
You may want to insist that there is a distinction between "theories" in logic, and those in science, but given that science accepts logical implication and requires that their theories not be inconsistent, scientific theories are just a subset of logical theories - specifically, that subset of scientific theories whose proof is established by a certain rigorous empirical process. If, then, that "GMST did not follow the predicted path given AGW" is not also a scientific theory, you need to insist that its truth is not established by scientific empirical methods (in which case it is irrelevant to science). Alternatively you need to assert a very strong observation sentence/theory distinction, which strong claim has been multiply refuted (see the Duhem Quine Thesis)
4) "The passages I quoted are statements regarding basic principles of science that are universally applicable."
I doubt you would get any philosopher of science to agree with that, and you would certainly not get a consensus agreeing with it. For a start we are talking about burden of proof, and "proof" is a very slippery word. Presumably you (and Minhinnick) do not mean logical proof, for if you did not empirical claim can satisfy the burden of proof, and therefore all ontology must be rejected, including the claim that there exists an external world, or indeed any claim that your self exists (unless "self" is taken to mean "a locus of thought"). If we allow it as proof on balance of probabilities, we face similar intractable difficulties because in the end all probabilities are relative, as Popper is at great pains to point out in Logic of Scientific Discovery. Further, if you mean "provide cogent evidence that" then the assymetry between proof of existence and disproof of existence disappears; and with it any justification for the different burdens of proof.
Victor @ #97 . . thank you for your reply - but you are wrong once more.
You referred me to the paper Fyfe, Meehl et al., 2016, in Nature Climate Change ( published online 24th February 2016 ).
The snippet of abstract you quoted, does not support your contentions.
The paper is paywalled (and so it was impractical for me to check it in detail) , but I do notice that one of the editors of the journal [Jeff Tollefson] has stated that:
'Fyfe uses the term "slowdown" rather than "hiatus" and stresses that it does not in any way undermine global warming theory.' [unquote]
Presumably the editor has read the paper - but Victor, it appears that you have either not read the paper, or have failed to understand it.
Victor, your argumentation (sic) seems to be a leg-pull, rather than anything scientifically serious.
#104 Tom, I'm sorry, but this post strikes me as extremely literal minded and even a bit pedantic. With respect to the designation "climate scientist," if you look at this list of "climate scientists" you'll see a great many names not specifically identified as "climate scientists." And if you look again at the list I linked to, you'll see that none of these people are specifically identified as "climate scientists" per se. If you take a look at the Wikipedia article for James Hansen, you'll see that he has degrees in physics, mathematics and astronomy — no degree in "climate science." Nowhere in the article is he identified specifically as a "climate scientist" or "climatologist." Obviously he is, but the writer of this article saw no reason to explicitly identify him as such.
The credentials of most of those in the list I provided include people with backgrounds in fields such as meteorology, physics, astrophysics, earth science, geography, geology, atmospheric science, environmental science, chemistry, etc. We can argue forever as to whether each can "truly" be regarded as a climate scientist or not. I think the point I was making was clear enough, but if you want to insist that this is not a true listing of actual climate scientists I won't argue with you. The larger point is that "climate scientist" vs. "climate skeptic" is not a meaningful opposition. It reflects bias, but clearly you are not willing to recognize your own bias, which is unfortunate.
victorag @100, I have reserved discussion of this quote to a seperate post because it is directly germain to the topic of the OP (ie, what we are supposed to be discussing in this thread), and because it directly demonstrates the strength of your own bias. In the discussion, I will refer to certain results regarding the correlation between CO2 concentration and temperature. I have used the BEST LOTI monthly data for temperature, and the Mauna Loa monthly index converted to an anomaly value for CO2 concentration. By converting to an anomaly value, I eliminate the seasonal cycle from the CO2 data, just as it is eliminated from the temperature data (also an anomaly). As a result, I was also able interpolate missing months as the average anomaly of the all months with observed data within three months of the missing value. This is an effective method with the anomaly data because the seasonal cycle has been eliminated.
Turning to your position:
I take this to be a clear claim that the correlation between temperature and CO2 between Jan 1975 and Dec 1997 is substantially larger than it is between Jan 1998 and July 2016 ("the first period appeared to demonstrate a correlation between CO2 and warming, the second period demonstrated the falsity of that assumption"). I also take it to claim that the correlation between Jan 1975 and July 2016 is less than the correlation between Jan 1975 and Dec 1997 ("why wouldn't that relationship continue even more convincingly into the 21st century?", a quetion that presuposes the relationship has not continued more convincingly).
As it happens, the correlation between Jan 1975 and Dec 1997 is 0.592, while that between Jan 1998 and July 2016 is 0.507. It is less, but not substantially less. More importantly, the correlation between Jan 1975 and July 2016 is 0.832. That is, the correlation over the full period since Jan 1975 is substantially larger than either of its two subparts, and increased greatly relative to the correlation of the first period even though the correlation of the second subperiod was less.
In short, your confident assumptions about what the evidence showed with regard to the correlation of CO2 and temperature are simply false.
There is a reason for that, which should be transparent to anybody truly familiar with AGW theory. Specifically, the short term temperature response (TCR) to a change in CO2 concentration approximates to 2.17 x ln(CO2/CO2o) where CO2 is the CO2 concentration, and CO2o is the original CO2 concentration. Thus, the expected change in temperature from the average annual increase in CO2 concentration over the period Jan 1981-Dec 2010 was 0.01 C, which is negligible compared to the temperature fluctuations induced by ENSO and volcanic activity. Therefore, over subdecadal time spans we expect the influence of CO2 to be indistinguishable from the temperature sequence in the absence of any change in the CO2 forcing. Over a decade, the influence rises to 0.11 C, which is still small relative to ENSO and volcanic fluctuations, but large enough to influence the trend. Over multiple decades, of course, the ENSO and volcanic fluctuations do not accumulate while the influence of CO2 changes does; so that in the long term the influence of CO2 forcing dominates. Therefore, as a direct prediction of AGW, we expect correlations between CO2 and temperature to be small over short intervals, but to increase with longer intervals:
Graphed above are the correlations of a running series of intervals approximately 15, 20, 25, and 30 years long. As can be seen, in general, the longer the interval the higher the correlation, as also the higher the mean correlation and lower the standard deviation of the correlations. That is exactly what we expect from the theory of AGW, given our knowledge of the small difference in year to year change in CO2 forcing.
It also gives some idea how the fake "skeptics" have persuaded people that the data from 1998 on "demonstrated the falsity of that assumption". They show graphs of CO2 vs temperature over just that interval (where due to the short duration, we do not expect a strong correlation) but do not calculate or show the actual correlation values. They exempt themselves from the burden of proof so that they can employ simple rhetorical tricks rather than cogently discussing the issue. When you instead look at the change in correlation from the additional years of data, you plainly see the evidence in favour of CO2s substantial influence on temperature has improved. Or alternatively, when you compare the correlation of the 1998 forwards period with the correlations of past intervals of similar lenght, you see that the correlation is not unusually low for intervals of that length, and therefore not evidence against the theory.
For what it is worth, the correlation over the full available data is 0.855.
Further, and obviously, AGW does not consider CO2 to be the only forcing, and not always the dominant forcing so that restricting the discussion to CO2 itself represents a distortion, or at best an oversimplification of the theory.
#105 Hi Eclectic. The Fyfe paper can be accessed from here. And yes, I've read it. And yes, they specifically refer to the terms "hiatus" and "slowdown" as equivalent. This is an important and also highly contentious paper that deserves more attention than it seems to be getting in both the media and online forums such as this.
Some excerpts:
Tollefson's contention that the paper "does not in any way undermine global warming theory" is accurate in the sense that the authors do not claim that their findings undermine the mainstream global warming view. In fact, like so many others before them, they offer reasons for the slowdown based on the usual invocation of natural forcings, internal variability, etc.:
Regardless of the reasons they suggest for the slowdown, which resemble so many other reasons offered in the past, they provide ample evidence that it is real and that climate scientists need to deal with it rather than simply dismiss it. An unusually candid and honest study, I must say.
[JH] Your spin on reality as expressed in your final paragraph is absurd. Climate scientists have been rigorously investigating and deliberating about the "slowdown" for over a decade now. If you pesist in your false and blatant sloganeering, you will forfeit your privilege of posting comments on this site.
Please note that posting comments here at SkS is a privilege, not a right. This privilege can and will be rescinded if the posting individual continues to treat adherence to the Comments Policy as optional, rather than the mandatory condition of participating in this online forum.
Moderating this site is a tiresome chore, particularly when commentators repeatedly submit offensive, off-topic posts or intentionally misleading comments and graphics or simply make things up. We really appreciate people's cooperation in abiding by the Comments Policy, which is largely responsible for the quality of this site.
Finally, please understand that moderation policies are not open for discussion. If you find yourself incapable of abiding by these common set of rules that everyone else observes, then a change of venues is in the offing.
Please take the time to review the policy and ensure future comments are in full compliance with it. Thanks for your understanding and compliance in this matter, as no further warnings shall be given.
I think to get to the nub of this laborious interchange with Victor Gauer there are some fundamentals Victor has failed to provide.
We have an SkS thread on the topic of why GMST wobbes don't match CO2 wobbles. The OP explains why such a mismatch would be expected under AGW, It provides "the burden of proof" but Victor's position is that this proof is not provided because of apparent "contradictory evidence." As Victor insists @100:-
Victor hold great store by such "contradictory evidence", to the point that he suggests there is no difference evidentially in the existance of AGW than there is in existence of leprechauns!!
There are perhaps two fundamental aspects of Victor's position that remain poorly described. Firstly, while he objects strongly to the OP (& thus the science presented by the IPCC), the size of the gulf between Victor's position & the IPCC's is not truly know. While it appears to be that Victor sees no or very little role for CO2 (along with other AGHGs) as a force in AGW, Victor has failed to set out how much of the science that supports AGW he refutes.
The second fundamental omission is that Victor has failed to set out the extent of his "contradictory evidence." This I will do here. Victor's initial enquiry up-thread was to find a comprehensive attribution of GMST since 1900. Victor refused to accept any of the studies offered as fitting the bill (studies which included IPCC AR5) and it is the absence of such a comprehensive attribution that was the first piece of Victor's "contradictory evidence" presented here. We have also been treated to a description of the alleged 'dodgy' nature of many of these attribution studies, this presented also as evidence, and to the bold assertion that many climatologists support Victor's "skeptical" stance. Further evidence from Victor comprises two of the wobbles in the GMST record that are not immediately matched by wobbles in CO2 levels. These are firstly the warming prior to 1940 bring too big to be forced by the CO2 of the time, and secondly the post-1998 GMST which is too small.
If this is the sum of the "contradictory evidence" Victor has to offer, assertions pretty-much debunked already up-thread, there is (with just the one exception) nothing further to discuss.
That exception is the full paper Fyfe et al (2016) 'Making sense of the early- 2000s warming slowdown' whose abstract Victor has been waving so vigorously recently.
Victor states @108 that Fyfe el al, by "specifically refer to the terms "hiatus" and "slowdown" as equivalent" but this is untrue. Fyfe et al say that some others refer to the 'slowdown' as a hiatus. Perhaps more tellingly, the paper says "A point of agreement we have with Lewandowsky et al. concerns the unfortunate way in which the recent changes have been framed in terms of GMST having "‘stalled’, ‘stopped’, ‘paused’, or entered a ‘hiatus’"."
In Victor-speak, the main message presented by Fyfe et al (2015) is that "A warming slowdown is thus clear in observations" but that they make sure to add "it is also clear that it has been a ‘slowdown’, not a ‘stop’."
Bob Loblaw @99.
The 'victorag@verison.net' here and the 'victor' @Realclimate are indeed the same Victor Grauer. On top of the unmistakable argumentation, he first appeared as a commenter on both sites in October 2014 with word-for-word identical comments. To quote Victor "There is only one Victor Grauer."
[JH] Please note that Victor is no on the cusp of relinquishing his privilege of posting comments on this site. He has been cited multiple times for multiple violations (modertion complaint, sloganeering and excessive repetition) of the SkS Comments Policy. Our patience is not infinite.
Please once again excuse me. The formatting got lost when I posted this last time, so I need to fix that and post again. Note to moderator: please remove my post #111.
#104 Tom Curtis:
1) See my previous post.
2)
Where did I say that? I presumed no such thing. IF their arguments are sound, then bias doesn't matter.
3)
You've provided a definition of theory from the realm of formal logic, which is very different from the logic used in ordinary discourse — or scientific discourse either. Look, I'll make it easy for you. Have you ever submitted a paper for peer review? I have. Many times. Have you ever written a peer review? I have. And would you expect someone reviewing a paper that presents a theory to produce a theory of his own if he sees some problem? A theory by any definition of that word?
You claim that, according to your research, fireflies generate a significant amount of heat, threatening the future of the civilized world. I examine your argument and find a flaw. Fireflies do not generate a significant amount of heat — or any heat at all. Is it necessary then for me to produce an alternative theory explaining why the earth seems to be heating up nonetheless? You tell me.
4.
Yes, if we take this phrase literally you have a point. "Proof" is not expected in science. In math, yes, but not science, because any valid scientific theory can always be disproved or modified over time. So strictly speaking "burden of proof" is a misnomer. But once again as I see it you are being overly literal. What's implied by this phrase is that the one offering a theory has a responsibility to back it up with convincing evidence, while the person critiqueing that theory has no such responsibility and need only find flaws. If for example you offer a math formula to support your theory and I discover an error in that formula, I need not back my observation up with evidence, or a theory of my own, but simply point out the flaw.
Here's another discussion of essentially the same issue that should help you understand what's at stake: The reversed responsibility response
Some excerpts:
Here's the link to the web page cited above, which got lost when I repasted my comment: The reversed responsibility response
victorag @106&111:
1) I excluded the majority of the list of "skeptical" climate scientists as climate scientists not based on their initial discipline, but their singular failure to have written even one peer reviewed paper on climate science, or in a few cases (Rob Carter comes to mind) the fact that their primary discipline and professional activity has been unrelated to climate science and the very few directly related peer reviewed articles they have written have suffered from rooky mistakes. Regardless even if we accept everybody on the list, you have completely ignored the primary thrust of my comment @104, unless your suggestion that "this post strikes me as extremely literal minded and even a bit pedantic" is a tacit acknowledgement that my explanation of the basics of English is correct, and that my orriginal charge that your claim that "a great many skeptics are climate scientists" is therefore literally false on any interpretation, but that you don't want to admit it.
2) Pay attention to the quotation marks. I quoted what you said. The second sentence in your quotation is my comment, and you have not responded to it.
3) Mathematics is a branch of logic (see Russell and Whitehead, Principia Mathematica, and also the Church-Turing thesis). It follows from this that all theories stated in mathematical form are theories by the logical definition. In fact, to not be a theory by the logical definition, a "scientific theory" would have to hold to be false at least some of the logical implications of its axioms/thesis.
I am beginning to note that indeed the "logic" you use in formal discourse is very different from formal logic. Formal logic remains, however, the fundamental principle underlying any rigorous proof; and by underlying probability theory, also any statistical "proof".
4) I don't see any point in going further on this. You are insisting that those "disproving at theory" need not provide any evidence for the positive claims they make in that disproof; and nor need they show that the theory they purport to falsify actually predicts the opposite of their purported falsifying index. Such a claim is nonsense, pure and simple.
In post #106, Victor doubles down on his original list that he claims to support his statement that a "great many skeptics are in fact climate scientists" . In #106, he provides an additional list, this time of simply "climate scientists", and argues that many of those are also not "specifically identified as "climate scientists" per se". He seems to feel that this new list represents the same sort of qualifications as his original list.
What do the two Wikipedia pages say when you read them? Victor's original list starts with:
whereas the new list starts with:
So, Victor's first list doesn't even claim itself that it lists "climate scientists", and his second list only covers "famous or otherwise notable persons who have contributed to climate science". [Note that some of the "skeptic" list names do appear on the second list.]
No wonder that Victor does not want to argue about who can "truly be regarded as a climate scientist". Again, the two links Victor provides do not say what he is implying they say.
The new link also has, near its bottom, a link to a List of Authors of Climate Change 2007: The Physical Science Basis. That Wikipedia entry begins with:
So, just the IPCC report has 620 authors, compared to Victor's original list of 61 (living) skeptics. I think we can safely say that the IPCC report authors can be considered "climate scientists". I think we could also consider the list of authors contained in the references to that IPCC report to be "climate scientists", too, and the number will be far higher than Victor's list of "a great many skeptics".
In fact, we could decide to look at the peer-reviewed scientific literature to find out what "climate scientists" are saying about anthropogenic global warming - but we need not, as this has been done (and published). Skeptical Science has several posts describing such studies:
If Victor wishes to argue against the existence of the overwhelming scientific consensus, as described in any of the above posts, then he should continue this discussion on one of those pages. (After reading the posts, of course.) This is increasingly off-topic on this page.
I have responded to victorag @108 on a more appropriate thread.
MARodger: "Victor states @108 that Fyfe el al, by "specifically refer to the terms "hiatus" and "slowdown" as equivalent" but this is untrue."
See the abstract:
"It has been claimed that the early-2000s global warming slowdown or hiatus, characterized by a reduced rate of global surface warming, . . " etc.
As for the rest, I won't be responding further until I am assured that my comments will not be deleted or censored.
[JH] All commenters on this site are required to abide by the SkS Comments Policy.
victorag - WRT your links to "The reversed responsibility response", i.e. the reversal of the burden of proof - you have it backwards:
The correlation of CO2 to warming (as one of many forcings, both natural and anthropogenic) has been well established over the last 150 years, starting with Tyndall, Fourier, and Arrhenius and basic spectroscopy, and continuing through theory, observations, and simple empirical evidence to today. That evidence has been accumulated and collated, the case regarding AGW has been made. The burden of proof now rests upon those who disagree, such as you, to present evidence sufficient to overturn that 150 years of data and theory. Armwaving and nitpicking, let alone semantic gaming and your presentations of short term trends without statistical significance (such as since 1998) do not suffice.
The strength of that correlation with CO2 was your initial objection to this thread - and quite frankly your objection has not survived examination. Since then you've done little but dance around trying to change the subject. You've been verbose, and your Gish Gallups extensive, but hardly convincing.
#117 When we examine the data, as presented in any number of graphs representing global temperature since ca. 1880, we see only one period in which both tempertures and CO2 emissions are rising at roughly the same rate at the same time: the last 20 years or so of the 20th century. Aside from that, no correlation is evident. That doesn't mean that an underlying correlation might be present that is hidden by other factors. But given the complete lack of long-term correlation in the raw data, it is incumbent on followers of the mainstream view to support the underlying correlation they seek to demonstrate with clear and convincing evidence. Otherwise, skeptics are justified in denying that any such correlation exists.
Once again, I won't waste my time elaborating until I feel sure my comments won't be deleted or censored.
[JH] All commenters on this site are required to abide by the SkS Comments Policy.
victorag @118 wants to look at graphs, apparently because he thinks his eyeball can better detect correlations than maths. For what it is worth, the correlation between CO2 and Temperture from March 1958 to July 2016 (ie, over the full Mauna Loa record) is 0.855 as noted @107 above. Apparently that fact is refuted (in his opinion) by the superior discriminating ability of his eyeball. If that is not enough, using BEST LOTI temperature and the Law Dome CO2 record extended by Cape Grim data, the correlation between CO2 concentration and global mean surface temperature from 1850 to 2013 is 0.903.
Of course, if you are going to insist on eyeballing your correlations, and not use those lying mathematical methods (/sarc), you can always check out a scatterplot of the values:
When compared to a set of sample scatterplots for different correlations, the similarity to that for a correlation of 0.9 is evident:
Perhaps the mathematics isn't lying at all, and there really is a strong correlation between CO2 concentration and temperature.
Given this mathematical, and eyeball evidence, I don't know what to make of victorag's claim that:
Well, no doubt, given that a false statement implies everything. But both the maths and a simple scatter plot show clearly that there is a high correlation between CO2 and temperature over the last 160 odd years.
So the more interesting question is, why given the clear evidence of a long term correlation between CO2 and temperature does Victor persist in insisting that no such correlation exists? How he does it is easy. In a mutual plot of concentration and temperature against time, there are periods in which the correlation is not 1. Indeed, if you do not use smoothed data, there is no period in which the correlation is 1. Victor appears to take this as proving the correlation is not high, but "does not have perfect correlation" does not imply "does not have high correlation". Therefore the inference from "does not match the slope in all intervals" to "is not highly correlated" a garbage inference.
As an aside, Victor also seems to think the ratio of scales of a mutual plot of CO2 concentration and Temperature against time is a given. How else can we make sense of his claim that "we see only one period in which both tempertures and CO2 emissions are rising at roughly the same rate at the same time: the last 20 years or so of the 20th century". In fact, the rate of increase of CO2 will be in ppmv per annum, and that of temperature will be in degrees Centigrade (or Kelvin, etc) per annum; so that at no time will they rise at the same rate. Given that the rates are not commensurate, they can be arbitrarilly varied, and doing so can make any period of approximate linear rise by both graphically coincide. Victor may be assuming the normal convention of standardizing by the standard deviation of both, but where the short term variability of both is very dissimilar (as is the case for CO2 and temperature), this can lead to deceptive results. Using the BEST/Law dome data, for example, it leads to a predicted transient response of 1 C per 100 ppmv increase. On the forcing data derived from the same data set it predicts a Transient Climate Response of 0.59 C/(W/m^2), or 2.2 C per doubling of CO2, which is likely too high.
Victor Gauer @116,
As you truncate your comment for fear thet it will be moderated into oblivion, I have no way of knowing whether your selective response to my comment @116 can be addressed at all. Suffice to say, your repeat waving of the abstract of Fyfe et al (2016) @116 is noted by me and that you should be aware that were Fyfe et al to consider the terms "slowdown" and "hiatus" to be "equivalent," it is mighty odd that for the three times the term "hiatus" is used in that context within the paper, one is saying others use the term "hiatus", a second is within a quote of others who use the term and a third is specifically saying Fyde et al object to use of the term "hiatus". You will note that its use in the well-waved abstract has a description appended just to be sure foolish folk know what they mean by "hiatus" and "global warming slowdown." They make quite clear within the paper that they address a slowdown in surface warming and nothing more. Nowhere do they "specifically refer to the terms "hiatus" and "slowdown" as equivalent" and that includes the abstract.
Victor Gauer @118,
Adding to Tom Curtis @119, I am also concerned that your comment @118 is incorrect.
You tell us:-
This is an important comment as it is the bedrock of all this palaver running down this comment thread. In this regard, your obsession with CO2 forcings is quite extraordinary and poorly explained. So perhaps the paper Lovejoy (2014)would be of interest to you. The paper sets out some reasons for atmospheric CO2 being used as a proxy both for all AGHGs and for the sum of anthropogenic forcings. Lovejoy (2014) additionally considers the time lags between forcing & ΔT as well as the lack of linearity in the relationship.
You may find Loyejoy (2014) also interesting because of its Figure 3a, which provides a "graph(s) representing global temperature since ca. 1880" and one which does show significantly more than "20 years or so ... in which both tempertures and CO2 emissions are rising at roughly the same rate at the same time." In truth it demonstrates a convincing correlation over the whole period under analysis 1880-2004, echoing the analysis presented @119.
Of course, you may wish to present your own "evidence" for your absent-but-for-20-years CO2 v GMST correlation. I appreciate that @97 you tell us "The evidence I presented concerned the lack of a long-term correlation between global warming and CO2 emissions. Since I've been told not to repeat myself, I won't get into that again." But you will see up-thread of #97, your presented "evidence" is restricted to almost nothing, indeed absent-but-for-a-bit-of-hand-waving.
MA Rodger @121, Victor's claim that "he evidence I presented concerned the lack of a long-term correlation between global warming and CO2 emissions" assumes a fundamental misrepresentation of climate science. Specifically, if AGW is correct, we expect a strong correlation between global mean surface temperature and CO2 concentration, but CO2 concentration is not expected to be correlated with CO2 emissions. Rather, it is a near linear function of cumulative emissions. Again, there is no necessary correlation between emissions and cumulative emissions. (There is, no doubt a de facto correlation simply because emissions have grown with time, but there is no reason to suppose it is a particularly strong correlation; and it will be much less than the near perfect correlation with cumulative emissions.)
Tom Curtis @122,
You are entirely correct except that Victor has been so frequently using the phrase "CO2 emissions" down this thread in place of 'increased atmospheric CO2 levels' or 'anthropogenic CO2 forcing' or whatever, that I ignore the true meaning of it and substitute the sensible intended meaning.
MA Rodger @123, given how wrong Victor is regarding CO2 concentration/Temp correlation, I think you are being over generous in your interpretation, unless, and until Victor corrects the record.
victorag has mistakenly posted a response to my post @119 on the incorrect thread. As the comments are off topic on the other thread, I will reply here.
Victor wrote:
First, and most obviously, it is as easy to distort with graphs as it is with statistics. Indeed, in some respects easier. Second, I find the imputation that my statistical analysis, which I fully described, were designed to manipulate the data, still less to "modfied [the data] to produce the desired result". For the full Mauna Loa comparison I used the same Mauna Loa data that was used by Danley Wolf, with the sole exception that I used anomaly data because the temperature data was anomaly data, and I wanted to compare like to like, and that I interpolated missing values. I deliberately used monthly data to avoid artificially smoothing the data. Over the full interval of Mauna Loa data, had I instead used the raw montly values (with interpolation for missing months), ie, used the data essentially as downloaded, it would have increased the calculated correlation from 0.855 to 0.857, a negligible difference. That clearly demonstrates that my high calculated correlation was not an artifact of using anomaly data for CO2 concentration. It should be noted that Mauna Loa, because of its location in the northern hemisphere, experiences a larger seasonal cycle in CO2 concentration than does the global average, so that using the raw data with no seasonal cycle adjustment itself represents an artificial deflation of the correlation.
This is an obvious consequence from the formula for correlation, which is the covarriance divided by the product of the standard deviations. Smoothing reduces the size of the standard deviation and thereby increases the correlation. But, just as it is possible to artificially inflate correlations by reducing the standard deviations of the data, so it is possible to artificially deflate increasing the standard deviation (of which more later).
First, Wolfe did not "directly transcribe" the data. Specifically, with regard to temperature he added the mean annual temperature durring the baseline period to all values in the mistaken belief that he would thereby convert them from anomaly values. Anomaly values are calcultated from monthly means, however, so Wolfe's hybrid data represents neither anomaly values or the actual temperatures experienced.
Second, Wolfe cherry picks his data set. Instead of using the GISS Land Ocean Temperature Index, he used the GISS Land (Meteorological Stations only) data. Because that data represents only a third of the globe, and because it largely excludes oceans, the data is far more variable than the GISS LOTI. Thus by cherry picking the meteorological station data, he takes advantage of the fact that inflating the standard deviation of the data artificially deflates correlations (alluded to above). This by itself deflates the correlation by about 20%, and the R-squared by about 36%.
He gains further advantages from his cherry pick. First, because of the limited geographical area covered by his data, temperature variability is more influenced by local factors, and less influenced by global factors - further decreasing the correlation with CO2. Second, the meteorological station data is distinctly flater after 1998 than is the Land/Ocean data, thereby further deflating the correlation in the so called hiatus period. Wolfe is doing well, in that he got three distortions of the data from just one cherry pick.
In any event, here is a scatterplot of the monthly Mauna Loa data as downloaded except for the interpolation of missing values, against the BEST LOTI. The correlation as previously noted is 0.857 (R^2: 0.734):