Climate Science Glossary

Term Lookup

Enter a term in the search box to find its definition.

Settings

Use the controls in the far right panel to increase or decrease the number of terms automatically displayed (or to completely turn that feature off).

Term Lookup

Settings


All IPCC definitions taken from Climate Change 2007: The Physical Science Basis. Working Group I Contribution to the Fourth Assessment Report of the Intergovernmental Panel on Climate Change, Annex I, Glossary, pp. 941-954. Cambridge University Press.

Home Arguments Software Resources Comments The Consensus Project Translations About Support

Bluesky Facebook LinkedIn Mastodon MeWe

Twitter YouTube RSS Posts RSS Comments Email Subscribe


Climate's changed before
It's the sun
It's not bad
There is no consensus
It's cooling
Models are unreliable
Temp record is unreliable
Animals and plants can adapt
It hasn't warmed since 1998
Antarctica is gaining ice
View All Arguments...


Username
Password
New? Register here
Forgot your password?

Latest Posts

Archives

Do volcanoes emit more CO2 than humans?

What the science says...

Select a level... Basic Intermediate

Humans emit 100 times more CO2 than volcanoes.

Climate Myth...

Volcanoes emit more CO2 than humans

"Human additions of CO2 to the atmosphere must be taken into perspective.

Over the past 250 years, humans have added just one part of CO2 in 10,000 to the atmosphere. One volcanic cough can do this in a day." (Ian Plimer)

At a glance

The false claim that volcanoes emit more CO2 than humans keeps resurfacing every so often. This is despite debunkings from bodies like the United States Geological Survey (USGS). Such claims may be easy to make, but they fall apart once a little scientific scrutiny is applied. So, to settle this once and for all, let's venture out into the fascinating world of geology, plate tectonics and volcanism.

According to the USGS, there are 1,350 active volcanoes on Earth at the moment. An active volcano is one that can erupt, even if it's decades since it last did so. As of June 2023, 48 volcanoes were in continuous eruption, meaning activity occurs every few weeks. Out of those, around 20 will be erupting on any particular day. Several of those will have erupted by the time you have finished reading this.

People are familiar with a typical volcano, an elevated area with one or more craters or fissures from which lava periodically erupts. But there are also the submarine volcanoes such as those along the mid-oceanic ridges. These vast undersea mountain ranges are a key component of Earth's Plate Tectonics system. The basalts they continually erupt solidify into the oceanic crust making up the flooring of the deep oceans. Oceanic crust is constantly moving away from any mid-ocean ridge in the process known as 'sea-floor spreading'.

Oceanic crust is chemically reactive. It reacts with seawater, allowing the formation of huge quantities of minerals including those carrying carbon in the form of carbonate. But oceanic crust is geologically young. That is because it is also being consumed at subduction zones - the deep ocean 'trenches' where it is forced down into Earth's mantle.

When oceanic crust is forced down into the mantle at subduction zones, it heats up and begins to melt into magma. Carbonate minerals in that crust lose their carbon - it is literally cooked out of them. Magmas then transport the CO2 and other gases up through Earth's crust and if they reach the surface, volcanic eruptions occur and the CO2 and other gases leave the magma for the atmosphere.

So here you can see a long-term cycle in which carbon gets trapped in the sea-floor, subducted into the mantle, liberated into new magma and erupted again. It's a key part of Earth's Slow Carbon Cycle.

Volcanoes are also dangerous. That's why we have studied them for centuries. We have hundreds of years of observations of all sorts of eruptions, at Earth's surface and beneath the oceans. Those observations include millions of geochemical analyses of both lavas and gases.

Because of all of that data collected over so many years, we have a very good idea of the amount of CO2 released to the atmosphere by volcanic activity. According to the USGS, it is between 180 and 440 million tons a year.

In 2019, according to the IPCC's Sixth Assessment Report (2022), human CO2 emissions were:

44.25 thousand million tons.

That's at least a hundred times the amount emitted by volcanoes. Case dismissed.

Please use this form to provide feedback about this new "At a glance" section. Read a more technical version below or dig deeper via the tabs above!


Further details

Beneath the surface of the Earth, in the various rocks making up the crust and the mantle, is a huge quantity of carbon, far more than is present in the atmosphere or oceans. As well as fossil fuels (those still left in the ground) and limestones (made of calcium carbonate), there are many other compounds of carbon in combination with other chemical elements, making up a range of minerals. According to the respected mineralogy reference website mindat, there are 258 different valid carbonate minerals alone!

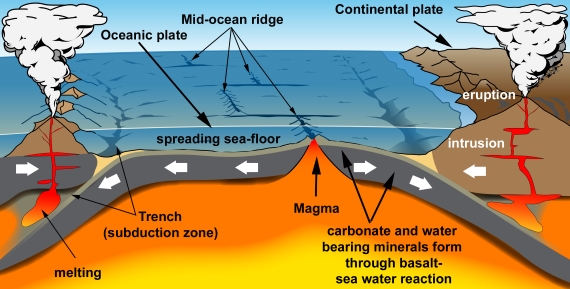
Some of this carbon is released in the form of carbon dioxide, through vents at volcanoes and hot springs. Volcanic emissions are an important part of the global Slow Carbon Cycle, involving the movement of carbon from rocks to the atmosphere and back on geological timescales. In this part of the Slow Carbon Cycle (fig. 1), carbonate minerals such as calcite form through the chemical reaction of sea water with the basalt making up oceanic crust. Almost all oceanic crust ends up getting subducted, whereupon it starts to melt deep in the heat of the mantle. Hydrous minerals lose their water which acts as a flux in the melting process. Carbonates get their carbon driven off by the heating. The result is copious amounts of volatile-rich magma.

Magma is buoyant relative to the dense rocks deep inside the Earth. It rises up into the crust and heads towards the surface. Some magma is trapped underground where it slowly cools and solidifies to form intrusions. Some magma reaches the surface to be erupted from volcanoes. Thus a significant amount of carbon is transferred from ocean water to ocean floor, then to the mantle, then to magma and finally to the atmosphere through volcanic degassing.

 Plate tectonics in cartoon form

Fig. 1: An endless cycle of carbon entrapment and release: plate tectonics in cartoon form. Graphic: jg.

Estimates of the amount of CO2 emitted by volcanic activity vary but are all in the low hundreds of millions of tons per annum. That's a fraction of human emissions (Fischer & Aiuppa 2020 and references therein; open access). There have been counter-claims that volcanoes, especially submarine volcanoes, produce vastly greater amounts of CO2 than these estimates. But they are not supported by any papers published by the scientists who study the subject. The USGS and other organisations have debunked such claims repeatedly, for example here and here. To continue to make the claims is tiresome.

The burning of fossil fuels and changes in land use results in the emission into the atmosphere of approximately 44.25 billion tonnes of carbon dioxide per year worldwide (2019 figures, taken from IPCC AR6, WG III Technical Summary 2022). Human emissions numbers are in the region of two orders of magnitude greater than estimated volcanic CO2 fluxes.

Our knowledge of volcanic CO2 discharges would have to be shown to be very mistaken before volcanic CO2 discharges could be considered anything but a bit player in the current picture. They have done nothing to contribute to the recent changes observed in the concentration of CO2 in the Earth's atmosphere. In the Slow Carbon cycle, volcanic outgassing is only part of the picture. There are also the ways in which CO2 is removed from the atmosphere and oceans. If fossil fuel burning was not happening, the Slow Carbon Cycle would be in balance. Instead we've chucked a great big wrench into its gears.

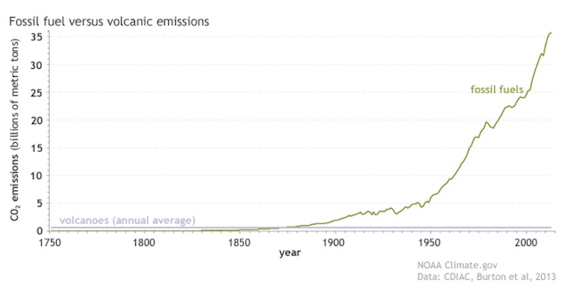
Some people like classic graphs, others prefer alternative ways of illustrating a point. Here's the graph (fig. 2):

Human emissions of CO2 from fossil fuels and cement

Fig. 2: Since the start of the Industrial Revolution, human emissions of carbon dioxide from fossil fuels and cement production (green line) have risen to more than 35 billion metric tons per year, while volcanoes (purple line) produce less than 1 billion metric tons annually. NOAA Climate.gov graph, based on data from the Carbon Dioxide Information Analysis Center (CDIAC) at the DOE's Oak Ridge National Laboratory and Burton et al. (2013).

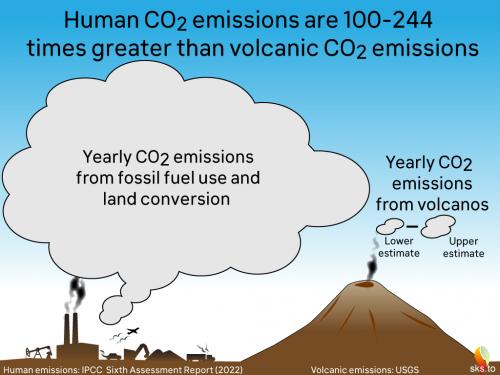
And here's a cartoon version (fig. 3):

 Human and volcanic CO2 emissions

Fig. 3: Another way of expressing the difference between current volcanic and human annual CO2 emissions (as of 2022). Graphic: jg.

Volcanoes can - and do - influence the global climate over time periods of a few years. This is occasionally achieved through the injection of sulfate aerosols into the high reaches of the atmosphere during the very large volcanic eruptions that occur sporadically each century. When such eruptions occur, such as the 1991 example of Mount Pinatubu, a short-lived cooling may be expected and did indeed happen. The aerosols are a cooling agent. So occasional volcanic climate forcing mostly has the opposite sign to global warming.

An exception to this general rule, however, was the cataclysmic January 2022 eruption of the undersea volcano Hunga Tonga–Hunga Ha'apai. The explosion, destroying most of an island, was caused by the sudden interaction of a magma chamber with a vast amount of seawater. It was detected worldwide and the eruption plume shot higher into the atmosphere than any other recorded. The chemistry of the plume was unusual in that water vapour was far more abundant than sulfate. Loading the regional stratosphere with around 150 million tons of water vapour, the eruption is considered to be a rare example of a volcano causing short-term warming, although the amount represents a small addition to the much greater warming caused by human emissions (e.g. Sellitto et al. 2022).

Over geological time, even more intense volcanism has occurred - sometimes on a vast scale compared to anything humans have ever witnessed. Such 'Large Igneous Province' eruptions have even been linked to mass-extinctions, such as that at the end of the Permian period 250 million years ago. So in the absence of humans and their fossil fuel burning, volcanic activity and its carbon emissions have certainly had a hand in driving climate fluctuations on Earth. At times such events have proved disastrous. It's just that today is not one such time. This time, it's mostly down to us.

Last updated on 10 September 2023 by John Mason. View Archives

Printable Version  |  Offline PDF Version  |  Link to this page

Argument Feedback

Please use this form to let us know about suggested updates to this rebuttal.

Related Arguments
Further reading

Tamino has posted two examinations of the "volcanoes emit more CO2 than humans" argument by looking at the impact of the 1991 Pinutabo eruption on CO2 levels and the impact of past super volcanoes on the CO2 record.

The Global Volcanism Program have a list of all "most noteworthy" volcanoes - with for example a Volcanic Explosivity Index (VEI) greater than 5 over the past 10,000 years.

Myth Deconstruction

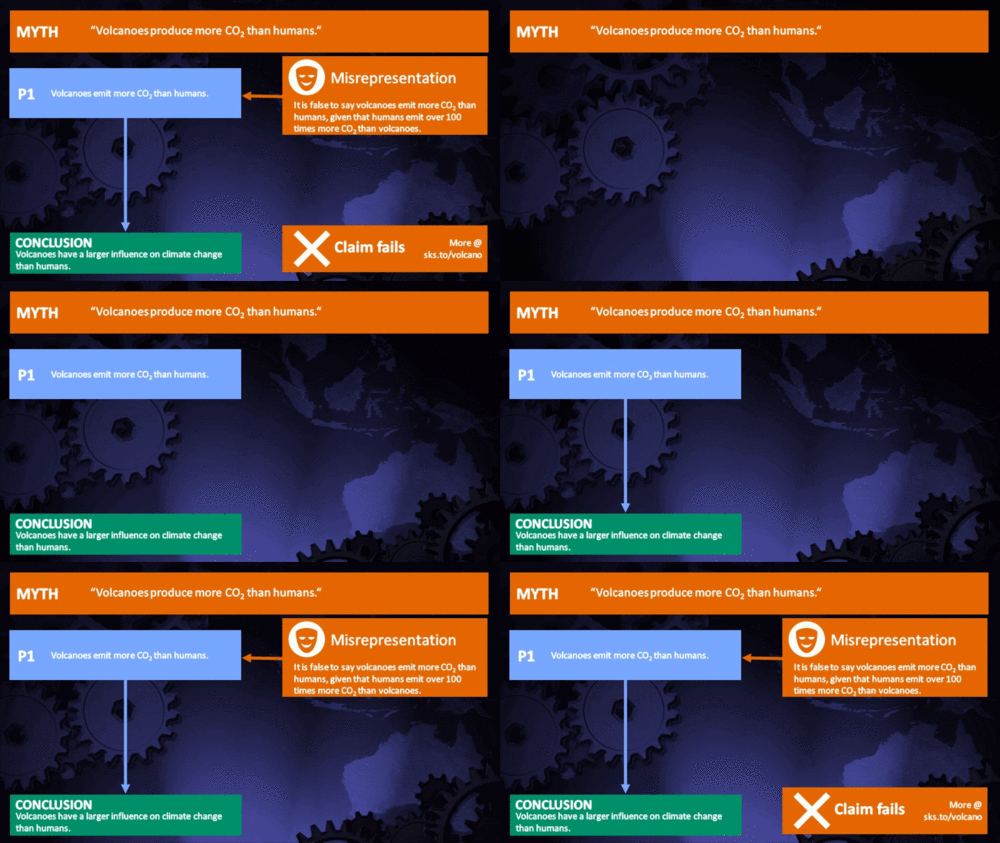
Related resource: Myth Deconstruction as animated GIF

MD Volcano

Please check the related blog post for background information about this graphics resource.

Denial101x video

Here is the relevant lecture-video from Denial101x - Making Sense of Climate Science Denial

Comments

Prev  1  2  3  4  5  6  7  8  9  10  11  12  13  Next

Comments 126 to 150 out of 309:

  1. ps Glaciers in sunny california are GROWING because of the extra moisture off the Pacific. I have posted links to all of these articles that describe what I have said. All of this climate change can easily be explained without super powerful CO2 forcing that historically does not seem to very powerful at all.
  2. Also you might want to read Peter Ward's work on the PT extinction (not the media coverage that assume CO2). While Ward does not recognize the importance of the Antarctic impact, he does cite the Siberian Traps that it created as releasing METHANE and poisionous gas. While the gas may have caused a GH condition, the GHG did not cause the extinction event, which (as he points out in Gorgon and elsewhere) was a two stage extinction. First the oceans died (90% of all ocean species) and was followed by land species (70%). What most forget when reading about the PT extinction is that the Pennsylvanian-Permian Ice Age had just closed and the planet had warmed (naturally) prior to the extinction event, just like right now after 12000 years of interglacial (the average length of an interglacial BTW).
  3. Here's the thing(s) about that: " Eastern Canada and the N.E. U,S, are not the only places on earth that have cooled while population centers warmed and it is from population centers that most data comes from. Why was this cooling ignored? " No, not really. The Arctic has warmed, the oceans have warmed (Aside from other data, sea level has been rising - that has to be mainly a combination of melting or temperature inceases - melting involves some of the heating occuring without temperature changes, of course). "South America, Antarctica and Africa have not experienced the same changes as Europe and PARTS of Asia. " ... " South Atlantic and Antarctic deep water is notably getting colder." The point being, you have to put all those together. It's still global warming, in the sense that there is more heat coming in then going back into space. "Glaciers in sunny california are GROWING because of the extra moisture off the Pacific." And why is that happening? "All of this climate change can easily be explained without super powerful CO2 forcing that historically does not seem to very powerful at all." It could be explained without CO2, but with strain and guessing. Much or most can be explained very very very very very very very very easily with a net forcing that is the sum of contributions from the changes in CO2, somewhat smaller from the rest of GHGs, a sizable likely negative aerosol contribution, rather small contributions from episodic volcanoes and solar radiation, and also, some other effects of ozone depletion (that doesn't explain the general global warming, etc, but it has effects). Etc.
  4. Sea level rise is within the Fairbridge curve; ie. normal or "expected". The Arctic is the obvious problem which is why I did not mention it. But outside of Greenland it won't cause a rise in sealevel because it is expanded (frozen) water that is also displacing sea water at present. Add to that the increased sea and glacial ice in Antarctica despite the small area near S.A. and there is no reason for additional sea level rise. The planet went through a brief warm spell, a large part caused by ocean cycles but some was abnormal. The anomally clearly shows which areas and they are decidely not global. I like the way you calculate out the CO2 forcing but I still agree with Spencer. There is a fundamental flaw somewhere. Be the one to find it.
  5. Regarding the P/T extinction: The concept as I understood it: There was a long ice-house period (with some significant ice, sometimes more (ice ages)) in the late Paleozoic. I've not been clear just when that ended, whether that was part of the P/T extinction or not. If it had ended but only just recently, that might have left species more vulnerable to any further warming. It was a time of continental collision - the formation of Pangea. One version: So then this Siberian trap flood volcanism starts up and persists for ~ a million years (more?), pumping CO2 into the air at a faster than typical rate. (Aerosols too, but those don't accumulate.) Eventually there is a lot more CO2. The Earth warms - maybe 5 degrees C - some extinctions occur (more on land??) The warmth causes CH4 release from the oceans. Sudden burst of warming. A total of 10 deg C more than before the flood volcanism? More extinctions. Oxygen doesn't dissolve as well in the oceans because of higher temperatures. Anaerobic bacteria that produce H2S become more commonplace. H2S in oceans, maybe some in the air. More extinctions.
  6. "the average length of an interglacial BTW" Average, perhaps. Not all. Once every few interglacials, one is longer - although this is too long of a pattern to have been repeated much in the last several hundred thousand years, but there was at least one extra-long interglacial. Based on astronomical forcings, this interglacial could be one of the extra-long ones, perhaps lasting another 20,000, 30,000, or 50,000 years, even without AGW. "t won't cause a rise in sealevel because it is expanded (frozen) water that is also displacing sea water at present. " Yes, of course. Yet, the sea level is rising; Greenland is losing land-based ice (potential point of confusion: the base of the ice is below sea level in many parts, and in Antarctica too (West Antarctica in particular), but the height of the surface of the ice is such that most of the weight of the ice is not supported by the water - it will raise sea level when it melts). Antarctica may also be losing ice in total even though some parts may be gaining ice mass. "Sea level rise is within the Fairbridge curve; ie. normal or "expected"." But if it is expected, what is the expectation based on? (Fairbridge's argument about Solar jerk was based on cycles dominated by Jupiter and Saturn, but the actual forces (tides on the sun) would be dominated by Jupiter and Venus, then Earth and Mercury, before any other gas giants - and I showed earlier these would be exceedingly exceedingly small effects.) I'm really not at all convinced that the Fairbridge curve was/is based on a solid body of evidence. "I like the way you calculate out the CO2 forcing" Thank you - but actually, I only explained how it is calculated, and the physical principles on which it is based, which are as sound as the inverse square law. "but I still agree with Spencer." Spencer doesn't really make a durable point, though.
  7. In that work of Spencer we've discussed, his argument was not abotu CO2 forcing but about climate sensitivity. There is no flaw in the fundamental sense. There is uncertainty. Spencer's argument seemed ill-concieved to me - the logic isn't quite there.
  8. Spencers argument is specifically about sensitivity to CO2. Look under Arguments, the Pacific Decadal Oscillation (at this site). I posted a link to a draft he did that they have refused to publish. I would prefer to be wrong about all this as I much prefer a warmer world but I fear that Spencer may be right. I am sure that Fairbridge was as the last two winters have been showing. The test is 2007 through 2011. Halfway there.
  9. ps This is spencers site. Articles and links to peer reviewed papers. http://www.drroyspencer.com/
  10. Sorry, I missed something that you said. The Fairbridge curve and the Solar Jerk are two different hypotheses. The curve was rejected and is now accepted by the consensus while the solar jerk still has not been accepted. They are unrelated subjects.
  11. The problems I saw in Spencer's approach: 1. he was looking at climate sensitivity based on Temperature and radiative fluxes (top of atmosphere (TOA)) over rather short time periods. This is not an equilibrium climate sensitivity at all. (PS if a period of 5 years is sufficient, then why isn't 40 or 100 years of warming sufficient?) 2. conceivably there could be some net global cloud feedback, as well as the ice-albedo and and water vapor feedbacks and others, to forcing of climate from CO2, etc. Over short time periods (this is part of concern 1, actually), any water vapor feedback and other feedbacks, etc., would be limited by thermal inertia of the oceans. In addition, CO2 would generally only be a feedback over longer time periods. What is the cloud feedback to cloud forcing? 'Internal Radiative Forcing' is a feedback to some other internal effect, and will react to itself... 3. If one of the graphs could be shown in enough detail, one might judge to what extent temperature fluctuations are driving radiative fluctuations and vice-versa - obviously both happen - they must, that's the physics. 4. On that note, there can be some correlation, perhaps with some lag in time or not, between cloud radiative feedback and temperature, or temperature changes, that is not entirely due to a direct forcing of temperature by clouds OR a direct forcing of clouds by temperature. The short term variability may involve fluctuations in cloud type, amount, and distribution, and in temperature and wind, etc, that are of a different nature than that of longer term changes. 5. Spencer's description of how the IPCC, etc, estimate sensitivity is not descriptive enough for me to judge what it means. ------- FROM http://www.drroyspencer.com/research-articles/satellite-and-climate-model-evidence/ "And it appears that the reason why most climate models are instead VERY sensitive is due to the illusion of a sensitive climate system that can arise when one is not careful about the physical interpretation of how clouds operate in terms of cause and effect (forcing and feedback)." This seems to set aside any work that goes into trying to realistically model clouds based on observations of clouds and weather on smaller spatial scales (relative to global) - I think 'they' do that. " The allure of models is strong: they are clean, with well-defined equations and mathematical precision. Observations of the real climate system are dirty, incomplete, and prone to measurement error. " Well, I guess we should trust the models, then, eh Spencer? :) (I just found that particular passage to be very ironic, and not just within the context of this paper.)
  12. 3 and 4 in last comment - What I mean - Spencer refers to striations and spirals. Are those spirals predominantly clockwise or counterclockwise? (And does it vary by the size of the spiral? Etc...) It may be that the method for figuring out climate sensitivity that Spencer is criticizing is actually not a very good method, for perhaps some of the same reasons that Spencer's own method seems lacking. But this is just one piece of the puzzle (which might have been helpful but unnecessary? - There is a lot of other evidence out there). For example, Spencer mentions use of this method on climate models. But the most clear cut way to evaluate climate model sensitivity is to have multiple runs in response to various forcings and compare. ------------ "The curve was rejected and is now accepted by the consensus" Could you show me where it is accepted?
  13. It also occurs to me that Spencer's analysis could be capturing some aspect of the annual cycle.
  14. Patrick Wikipedia Entry Article A quick web search provides many more links.
  15. ps Here is another example from a different scientist. There is an apparent agreement with Fairbridge: Earth's Orbit Creates More Than A Leap Year: Orbital Behaviors Also Drive Climate Changes, Ice Ages ScienceDaily (Feb. 18, 2008) — The Earth's orbital behaviors are responsible for more than just presenting us with a leap year every four years. According to Michael E. Wysession, Ph.D., associate professor of earth and planetary sciences in Arts & Sciences at Washington University in St. Louis, parameters such as planetary gravitational attractions, the Earth's elliptical orbit around the sun and the degree of tilt of our planet's axis with respect to its path around the sun, have implications for climate change and the advent of ice ages.
  16. "Earth's Orbit Creates More Than A Leap Year: Orbital Behaviors Also Drive Climate Changes, Ice Ages ScienceDaily (Feb. 18, 2008)" http://www.sciencedaily.com/releases/2008/02/080213113037.htm That's just the Milankovitch cycles. It's basic grade-school science. Nothing new here. "There is an apparent agreement with Fairbridge" Well, according to "Article" from comment 139, Fairbridge was an early supporter of the Milankovitch cycle-driven climate changes concept. But that doesn't do anything to bolster his other concepts about solar jerk and sizable sudden sea level changes in the later Holocene. Also, "Article" did imply that the Fairbridge curve had been accepted in some way, but I don't buy that in full. Of course I wouldn't be surprised if sea level changes have some irregularity or even smaller cycles in them; there's no rule about having to rise completely monotonically (never reversing) between the peak of the last ice age and the present. But that's different then accepting the Fairbridge curve.
  17. Re: "That's just the Milankovitch cycles." Not Quite. It's a better understanding of various cycles, not just Milankovitch.
  18. Re: "It also occurs to me that Spencer's analysis could be capturing some aspect of the annual cycle." Climate is the average of annual cycles over a given time period. The 30 year limitation currently used skews the results.
  19. Re 143: 1. In the work of Spencer we had been discussing, he was using observations over short time periods - not long term climate trends - to attempt to infer the magnitude of climate sensitivity. Some portion of that short term variation occurs in under a year. Because of asymmetries between the hemispheres and also that fall and spring are not just the averages of winter and summer, etc, there will be some annual cycles in some global averages, which result from external forcing but of course involve feedbacks. Spencer also tried to explain most of recent global average surface temperature trends in terms of the PDO and ENSO, I think (it was a strain to do so - in other words, Occam's razor selects against this explanation). There may be an irony there - what positive feedbacks are available to boost internal variability while leaving external forcing so impotent? Of course, there are different spatial-temporal structures in different feedbacks to different things, etc... 2. The 30 year limitation - what limitation, exactly? The satellite data and some other data may only go back to x, but where it agrees with other data we might gain confidence in other data sets going back further; also we have paleoclimate and paleoclimate forcing records, and physics and modeling to fill in some of the blanks. Re 142: Where in the article did you see something besides Milankovitch cycles?
  20. Patrick "Re 142: Where in the article did you see something besides Milankovitch cycles?" Here: "According to Michael E. Wysession, Ph.D., associate professor of earth and planetary sciences in Arts & Sciences at Washington University in St. Louis, parameters such as planetary gravitational attractions," You see "planetary gravitational attractions" are an addition, referring to what I am talking about and not part of the Milankovitch cycle theory.
  21. Re: "Spencer also tried to explain most of recent global average surface temperature trends in terms of the PDO and ENSO," Yes, but he does not get into the cause of the PDO or ENSO as I have (granted it's only my hypothesis, it does lend support to it).
  22. "You see "planetary gravitational attractions" are an addition, referring to what I am talking about and not part of the Milankovitch cycle theory. " Those gravitational attractions are responsible for the Milanovitch cycles - precession of tilt and perihelion advance, changes in tilt, changes in eccentricity of orbit; also, changes in the plane of the ecliptic, though whether that has any significance climatologically is ... ? - but that's still a 70,000 year cycle. None of these cycles is shorter than ~ 20,000 years. If shorter-term astronomical cycles were meant to be implied to 1. exist (of course some do - but are there more than either of us is familiar with? The Chandler wobble (~over 400 days, no significant climatological consequence), cycles in the moon's orbit (perigee advance? (~between 8 and 9 years), precession of nodes (precession of tilt of the orbital plane relative to Earth's orbital plane) ~ between 18 and 19 years, some other shorter cycle(s) - these and consequent alignments with Earth-sun orbital geometry (including) perhelion/perigee alignment; solar cycles (of course they affect climate, but seem to only account for some fraction of recent warming, not-so-large a fraction especially in more recent decades) ... Of course, the Milankovitch cycles result from tidal torques on the Earth's equatorial bulge (mostly from the moon and sun) and tides acting on the Earth's orbit (the difference in the gravitational acceleration due to other planets acting on the Earth-moon system relative to the sun) - with some relativistic contributions, about which I don't know much. These are cummulative effects, I think, considering that the tidal torque on the equatorial bulge must go through semimonthly (no torque from moon when aligned with equatorial plane, which it crosses roughly twice in a full orbit) and semiannual cycles (no torque due to sun at equinoxes). There are obviously cycles in the alignments of the planets, and modulated by relative positions of perihelions and ascending nodes (the ascending node is where an object's orbit crosses a reference plane from south to north - typically the reference plane for planets is the ecliptic - approx. the plane of the Earth's orbit. One might also use the "invariable plane" of the solar system - the total angular momentum vector of the whole solar system is perpendicular to this plane). Anyway, Milankovitch cycles, I think, result over time as cummulative effects from forces that are also cycled over time over shorter periods. Are there significant cycling displacements in such things as tilt (magnitude and/or direction) and Earth-sun distance that occur in shorter time periods (that don't average to near zero over just a few years but can be set aside over thousands of years leaving the Milankovitch cycles)? If there were, I would have expected to here more about it in an article where "planetary gravitational attractions" were being highlighted. The impression I've gotten is that these short-term pulsations are small relative to the trend over 1000s of years. That is, using snow-depth as an analogy to tilt, eccentricity, etc, the impression I've gotten is that we get to ~ 1000 inches over 1000s of years by many small flurries that occur every month or so, a few bigger than the rest, but without much melt in between - as opposed to massive snowstorms followed by heatwaves.
  23. Patrick Re: 147 Fairbridge and his idea of Jupiter and other planets affecting the Barycenter, effecting solar activity, affecting climate. ps Remeber we discussed water levels before? I found this article (don't know how I missed it). World On Water "Geophysicists Show That Crust Temperature Variation Explains Half Of Elevation Differences In North America" February 1, 2008 — Geophysicists determined that tectonic mountain-building processes are not the only factor that determines elevation in North America. The temperature of the crust affects its density, and lower density crust will rise higher than colder, higher density crust. The heat in question comes from the Earthýs interior and also radioactive decay of various elements in the crust. Broadly, the Rocky Mountain region of the United States has the hottest crust, as well as the highest general elevation. Interesting no?
  24. This is where the volcanos are active in Antarctica Funny coincidence?
  25. http://icecap.us/images/uploads/AntarcticVolcanoes2.jpg Nice map. Are these all active right now? When was the last time they were active? Is the activity unusual for the last 1000+ years? "Geophysicists Show That Crust Temperature Variation Explains Half Of Elevation Differences In North America" Yes, that's interesting. If we were discussing changes over millions of years, it could potentially pertain.

Prev  1  2  3  4  5  6  7  8  9  10  11  12  13  Next

Post a Comment

Political, off-topic or ad hominem comments will be deleted. Comments Policy...

You need to be logged in to post a comment. Login via the left margin or if you're new, register here.

Link to this page


The Consensus Project Website

THE ESCALATOR

(free to republish)


© Copyright 2024 John Cook
Home | Translations | About Us | Privacy | Contact Us