Climate Science Glossary

Term Lookup

Enter a term in the search box to find its definition.

Settings

Use the controls in the far right panel to increase or decrease the number of terms automatically displayed (or to completely turn that feature off).

Term Lookup

Settings


All IPCC definitions taken from Climate Change 2007: The Physical Science Basis. Working Group I Contribution to the Fourth Assessment Report of the Intergovernmental Panel on Climate Change, Annex I, Glossary, pp. 941-954. Cambridge University Press.

Home Arguments Software Resources Comments The Consensus Project Translations About Support

Bluesky Facebook LinkedIn Mastodon MeWe

Twitter YouTube RSS Posts RSS Comments Email Subscribe


Climate's changed before
It's the sun
It's not bad
There is no consensus
It's cooling
Models are unreliable
Temp record is unreliable
Animals and plants can adapt
It hasn't warmed since 1998
Antarctica is gaining ice
View All Arguments...


Username
Password
New? Register here
Forgot your password?

Latest Posts

Archives

Do volcanoes emit more CO2 than humans?

What the science says...

Select a level... Basic Intermediate

Humans emit 100 times more CO2 than volcanoes.

Climate Myth...

Volcanoes emit more CO2 than humans

"Human additions of CO2 to the atmosphere must be taken into perspective.

Over the past 250 years, humans have added just one part of CO2 in 10,000 to the atmosphere. One volcanic cough can do this in a day." (Ian Plimer)

At a glance

The false claim that volcanoes emit more CO2 than humans keeps resurfacing every so often. This is despite debunkings from bodies like the United States Geological Survey (USGS). Such claims may be easy to make, but they fall apart once a little scientific scrutiny is applied. So, to settle this once and for all, let's venture out into the fascinating world of geology, plate tectonics and volcanism.

According to the USGS, there are 1,350 active volcanoes on Earth at the moment. An active volcano is one that can erupt, even if it's decades since it last did so. As of June 2023, 48 volcanoes were in continuous eruption, meaning activity occurs every few weeks. Out of those, around 20 will be erupting on any particular day. Several of those will have erupted by the time you have finished reading this.

People are familiar with a typical volcano, an elevated area with one or more craters or fissures from which lava periodically erupts. But there are also the submarine volcanoes such as those along the mid-oceanic ridges. These vast undersea mountain ranges are a key component of Earth's Plate Tectonics system. The basalts they continually erupt solidify into the oceanic crust making up the flooring of the deep oceans. Oceanic crust is constantly moving away from any mid-ocean ridge in the process known as 'sea-floor spreading'.

Oceanic crust is chemically reactive. It reacts with seawater, allowing the formation of huge quantities of minerals including those carrying carbon in the form of carbonate. But oceanic crust is geologically young. That is because it is also being consumed at subduction zones - the deep ocean 'trenches' where it is forced down into Earth's mantle.

When oceanic crust is forced down into the mantle at subduction zones, it heats up and begins to melt into magma. Carbonate minerals in that crust lose their carbon - it is literally cooked out of them. Magmas then transport the CO2 and other gases up through Earth's crust and if they reach the surface, volcanic eruptions occur and the CO2 and other gases leave the magma for the atmosphere.

So here you can see a long-term cycle in which carbon gets trapped in the sea-floor, subducted into the mantle, liberated into new magma and erupted again. It's a key part of Earth's Slow Carbon Cycle.

Volcanoes are also dangerous. That's why we have studied them for centuries. We have hundreds of years of observations of all sorts of eruptions, at Earth's surface and beneath the oceans. Those observations include millions of geochemical analyses of both lavas and gases.

Because of all of that data collected over so many years, we have a very good idea of the amount of CO2 released to the atmosphere by volcanic activity. According to the USGS, it is between 180 and 440 million tons a year.

In 2019, according to the IPCC's Sixth Assessment Report (2022), human CO2 emissions were:

44.25 thousand million tons.

That's at least a hundred times the amount emitted by volcanoes. Case dismissed.

Please use this form to provide feedback about this new "At a glance" section. Read a more technical version below or dig deeper via the tabs above!


Further details

Beneath the surface of the Earth, in the various rocks making up the crust and the mantle, is a huge quantity of carbon, far more than is present in the atmosphere or oceans. As well as fossil fuels (those still left in the ground) and limestones (made of calcium carbonate), there are many other compounds of carbon in combination with other chemical elements, making up a range of minerals. According to the respected mineralogy reference website mindat, there are 258 different valid carbonate minerals alone!

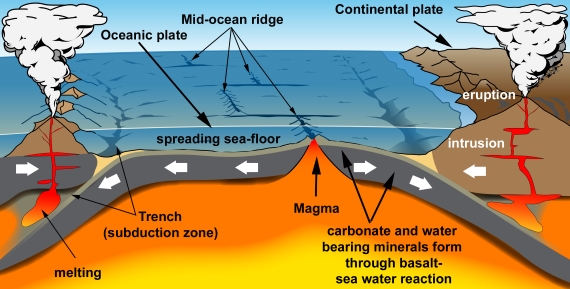
Some of this carbon is released in the form of carbon dioxide, through vents at volcanoes and hot springs. Volcanic emissions are an important part of the global Slow Carbon Cycle, involving the movement of carbon from rocks to the atmosphere and back on geological timescales. In this part of the Slow Carbon Cycle (fig. 1), carbonate minerals such as calcite form through the chemical reaction of sea water with the basalt making up oceanic crust. Almost all oceanic crust ends up getting subducted, whereupon it starts to melt deep in the heat of the mantle. Hydrous minerals lose their water which acts as a flux in the melting process. Carbonates get their carbon driven off by the heating. The result is copious amounts of volatile-rich magma.

Magma is buoyant relative to the dense rocks deep inside the Earth. It rises up into the crust and heads towards the surface. Some magma is trapped underground where it slowly cools and solidifies to form intrusions. Some magma reaches the surface to be erupted from volcanoes. Thus a significant amount of carbon is transferred from ocean water to ocean floor, then to the mantle, then to magma and finally to the atmosphere through volcanic degassing.

 Plate tectonics in cartoon form

Fig. 1: An endless cycle of carbon entrapment and release: plate tectonics in cartoon form. Graphic: jg.

Estimates of the amount of CO2 emitted by volcanic activity vary but are all in the low hundreds of millions of tons per annum. That's a fraction of human emissions (Fischer & Aiuppa 2020 and references therein; open access). There have been counter-claims that volcanoes, especially submarine volcanoes, produce vastly greater amounts of CO2 than these estimates. But they are not supported by any papers published by the scientists who study the subject. The USGS and other organisations have debunked such claims repeatedly, for example here and here. To continue to make the claims is tiresome.

The burning of fossil fuels and changes in land use results in the emission into the atmosphere of approximately 44.25 billion tonnes of carbon dioxide per year worldwide (2019 figures, taken from IPCC AR6, WG III Technical Summary 2022). Human emissions numbers are in the region of two orders of magnitude greater than estimated volcanic CO2 fluxes.

Our knowledge of volcanic CO2 discharges would have to be shown to be very mistaken before volcanic CO2 discharges could be considered anything but a bit player in the current picture. They have done nothing to contribute to the recent changes observed in the concentration of CO2 in the Earth's atmosphere. In the Slow Carbon cycle, volcanic outgassing is only part of the picture. There are also the ways in which CO2 is removed from the atmosphere and oceans. If fossil fuel burning was not happening, the Slow Carbon Cycle would be in balance. Instead we've chucked a great big wrench into its gears.

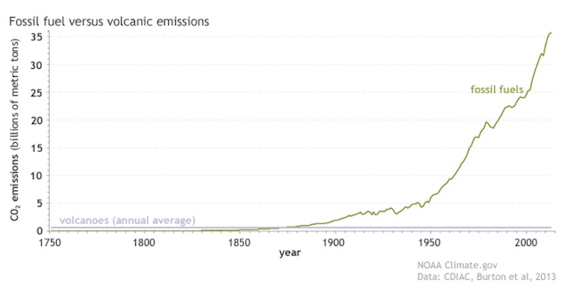
Some people like classic graphs, others prefer alternative ways of illustrating a point. Here's the graph (fig. 2):

Human emissions of CO2 from fossil fuels and cement

Fig. 2: Since the start of the Industrial Revolution, human emissions of carbon dioxide from fossil fuels and cement production (green line) have risen to more than 35 billion metric tons per year, while volcanoes (purple line) produce less than 1 billion metric tons annually. NOAA Climate.gov graph, based on data from the Carbon Dioxide Information Analysis Center (CDIAC) at the DOE's Oak Ridge National Laboratory and Burton et al. (2013).

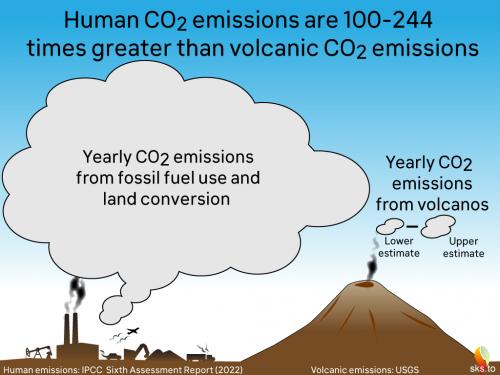
And here's a cartoon version (fig. 3):

 Human and volcanic CO2 emissions

Fig. 3: Another way of expressing the difference between current volcanic and human annual CO2 emissions (as of 2022). Graphic: jg.

Volcanoes can - and do - influence the global climate over time periods of a few years. This is occasionally achieved through the injection of sulfate aerosols into the high reaches of the atmosphere during the very large volcanic eruptions that occur sporadically each century. When such eruptions occur, such as the 1991 example of Mount Pinatubu, a short-lived cooling may be expected and did indeed happen. The aerosols are a cooling agent. So occasional volcanic climate forcing mostly has the opposite sign to global warming.

An exception to this general rule, however, was the cataclysmic January 2022 eruption of the undersea volcano Hunga Tonga–Hunga Ha'apai. The explosion, destroying most of an island, was caused by the sudden interaction of a magma chamber with a vast amount of seawater. It was detected worldwide and the eruption plume shot higher into the atmosphere than any other recorded. The chemistry of the plume was unusual in that water vapour was far more abundant than sulfate. Loading the regional stratosphere with around 150 million tons of water vapour, the eruption is considered to be a rare example of a volcano causing short-term warming, although the amount represents a small addition to the much greater warming caused by human emissions (e.g. Sellitto et al. 2022).

Over geological time, even more intense volcanism has occurred - sometimes on a vast scale compared to anything humans have ever witnessed. Such 'Large Igneous Province' eruptions have even been linked to mass-extinctions, such as that at the end of the Permian period 250 million years ago. So in the absence of humans and their fossil fuel burning, volcanic activity and its carbon emissions have certainly had a hand in driving climate fluctuations on Earth. At times such events have proved disastrous. It's just that today is not one such time. This time, it's mostly down to us.

Last updated on 10 September 2023 by John Mason. View Archives

Printable Version  |  Offline PDF Version  |  Link to this page

Argument Feedback

Please use this form to let us know about suggested updates to this rebuttal.

Related Arguments
Further reading

Tamino has posted two examinations of the "volcanoes emit more CO2 than humans" argument by looking at the impact of the 1991 Pinutabo eruption on CO2 levels and the impact of past super volcanoes on the CO2 record.

The Global Volcanism Program have a list of all "most noteworthy" volcanoes - with for example a Volcanic Explosivity Index (VEI) greater than 5 over the past 10,000 years.

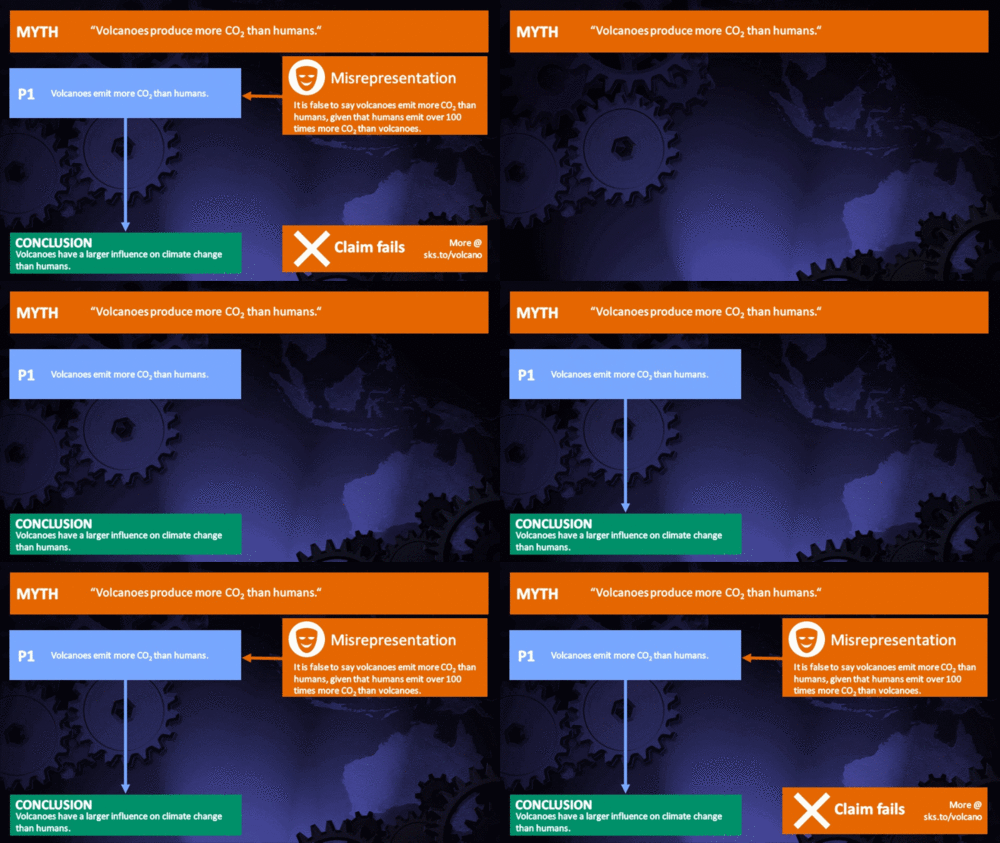
Myth Deconstruction

Related resource: Myth Deconstruction as animated GIF

MD Volcano

Please check the related blog post for background information about this graphics resource.

Denial101x video

Here is the relevant lecture-video from Denial101x - Making Sense of Climate Science Denial

Comments

Prev  1  2  3  4  5  6  7  8  9  10  11  12  13  Next

Comments 201 to 225 out of 309:

  1. ps About your points on correlation. It's how I made a successful livelyhood for 33 years. Troubleshooting and correcting problems for a major manufacturer, ie. I do have a firm grasp on correlations and know how to find the root cause of said symptoms. It's why I have a comfortable retirement.
  2. Re 201 - so you've actually done a statistical study of the raw data for yourself? You've never actually posted any source about submarine volcanism being linked to ENSO. You did post a source about ENSO being connected to volcanos via volcanic aerosol climate forcing - noting that not all El Ninos are caused that way. You've never actually posted any source that links any of that to planetary alignments. You did post a source about a planet that would be heated sufficiently by tidal deformation to be kept habitable whereas it would not otherwise be so. Tidal heating of the Earth is a fraction of geothermal heat release, most of which is slow and steady, related to conduction through the crust, and in total is puny in comparison to just the recent changes in climate radiative forcings.
  3. Pat Re: "statistical study of the raw data for yourself" Yes but in MY field, not in climatology. ie. I understand correletions, nobody understands climate yet. Re: "You did post a source about ENSO being connected to volcanos via volcanic aerosol climate forcing - noting that not all El Ninos are caused that way." No, not "via volcanic aerosol climate forcing", an article of SIGNALING the beginning of a cycle, ie. the volcano erupts and is used as a SYMPTOM. Re: "You've never actually posted any source that links any of that to planetary alignments. You did post a source about a planet that would be heated sufficiently by tidal deformation to be kept habitable whereas it would not otherwise be so. Tidal heating of the Earth is a fraction of geothermal heat release, most of which is slow and steady, related to conduction through the crust, and in total is puny in comparison to just the recent changes in climate radiative forcings." If you refer to the "Thermostat article", you make the assumption of an earth with a constant rate. That constant rate was disproved by the findings in Nepal and Tibet of just how old the Himalyas are (they are MUCH more recent than thought). It was also proven false by further studies in both the Rockies and the Andes. They are much younger than thought. In my hypothesis I make a couple of assumptions (as in any hypothesis). I assume first that Rhodes Fairbridge was correct in the "Solar Jerk" and hypothesize that this same jerk is applicable to the Earth. This explains why plate tectonics occur in "fits and spurts". The second assumption is that the ENSO is related to the South AMerican subduction zone. Unfortunately when I read the hypothesis on the tectonic cause of ENSO I was doing research for my own curiosity and did not note the website (all I remember was it was a dot gov). I had cut and paste the hypothesis to notepad and saved it for my own reference. If I relocate the site I will post it here. In the meantime, expect El Nino soon. Volcano in Chile spews lava and blasts ash 12 miles into sky But there are more signs of current activity: Tongan Inspection Team Heads to Undersea Volcano And more arctic seafloor recycled here: Ash Falls on Anchorage as Volcano Keeps Spewing The third assumption is that clouds cool and lack of clouds allow IR warming, ie. Spencers work on positive vs negetive feedback to GHGs. Sorry, I don't need math here to prove he is right, it's common sense.
  4. ps The links in Posts 5 and 6 (especially the first link in 5. Post 13 has the Tectonic Thermostat link and the links in 83 support me in that they can be rapid. Then "Synchronized Chaos: Mechanisms For Major Climate Shifts" link at 107. and 178 "Magma chockfull of silica is viscous (think warm, gooey taffy) and traps lots of gases." refers to Alaska's eruptions, evidence of the increase in subduction there.
  5. About this: "Synchronized Chaos: Mechanisms For Major Climate Shifts" See Tsonis et al: "A new dynamical mechanism for major 1 climate shifts" http://www.uwm.edu/~kravtsov/downloads/GRL-Tsonis.pdf What they have found, based on their interpretation, is that there are times when some of the leading modes of variability vary together (become synchonized), and when the strength of that synchronization then increases, this destroys the synchronization and causes shifts in temperature and variability patterns (ENSO). However, they did not attribute longer-term average warming to this process. Nor did they attribute these changes in variability to volcanism or tectonics - not that this alone implies it cannot be so, but ... it seems to me that it is more likely their findings are incompatible with your hypothesis then with most of what I've been saying.... (to be continued?)...
  6. ... because they compare the behavior they found in observations to that they find in climate models and find similar behavior. Those climate models produce global warming in response to increased CO2, and do not incorporate submarine volcanism or any particular patterns in volcanism so far as I know, and most definitely do not include tides from other planets. Furthermore, Tsonis et al do not show in this paper why this pattern occurs, nor do they show that changes besides the longer term warming are entirely associated with this particular pattern (some changes in ENSO and other such modes of variability could be due to AGW and other externally-forced changes more directly; some could be a result of the mechanisms of this pattern, but this pattern could be affected by externally-forced climate changes in some way.). They did not mention the AMO, which I think has a similar time scale and has been said to vary between partially masking and adding to anthropogenic global warming. The only statement that raises a conflict with some of the current body of knowledge is that the lull in global warming between 1940 and 1970 may be less due to variations in anthropogenic aerosol cooling than thought and more due to internal variability than thought. I'm not sure how significant an adjustment to current understanding would truly occur if this paper and subsequent work lead to a new understanding of the matter. I did once read, some years ago, that a person had identified a pattern in the paleoclimatic record, which was suggested to fit the pattern in the historical record of changes in the 20th century in global average surface temperature, with warming up to about 1940, cooling to about 1970, and warming after about 1970 - but with a notable difference, that the warming has been greater and the cooling less (in fact there really was not an extended period of cooling in the global average) than would be expected from the paleoclimatic pattern alone - this would be consistent with externally-forced global warming superimposed on some natural 'cycle'. Whether the paleoclimatic pattern is the same phenomenon covered by this paper, or due to AMO, or if the phenomenon in this paper is organized by the AMO - well, that I don't know; who does?
  7. "A new dynamical mechanism for major 1 climate shifts" Should be "A new dynamical mechanism for major climate shifts"
  8. The Climate Change controversy has brought to light a correlation that seems to have been lost in history: temperature change versus solar activity, not only solar irradiance that can account for only a small change in temperature, but activity that includes solar winds and magnetic fields. See todays comment here. It's The Sun But I still feel that the Sun is only part (albeit the major part) of Climate Change.
  9. But the Arctic melt is caused by vulcanism, of that I am comvinced. The same goes for the AWP in Antarctica, ENSO, the PDO and AMO.
  10. "But the Arctic melt is caused by vulcanism, of that I am comvinced. The same goes for the AWP in Antarctica, ENSO, the PDO and AMO." But **what** is it that convinces you so?
  11. Patrick Re: "But **what** is it that convinces you so? " Maps of the Arctic Ocean Floor. The Locations of the trenches. The increased volcanic activity. The seafloor material in the ejecta from Alaskan volcanos. Portions of Oceans cooling while anomalous areas are heating. ALL point to a very active tectonic spreading and subduction in the arctic and a severe change in ocean currents.
  12. It is true that volcanic aerosol forcing has an effect on NAM and SAM. But you've been refering to alternative pathways... Of course there could be seafloor material in Alaskan volcanos - it's associated with subduction of the Pacific plate. A constant rate of subduction would give rise to episodic volcanic eruptions, because it is not in their nature to erupt slowly and continuously. If you take a jar of sand and pour it out at a constant rate to form a sandpile, there will be small avalanches and occasional large avalanches off the side of the sandpile as it grows. That's not to say that all variations in volcanic eruptions must be due to chance or that plate motions are constant. (though they cannot move faster or slower or change directions with any persistence over intermediate time scales.) But look at the graph at the top of this site. What was the climate doing between 1880 and 1940?
  13. Patrick The volcanic aerosol forcing is not what I am pointing out at all. That really does not apply to volcanism along the seafloor ridges at all. My use of terrestrial volcanos is only to show the increase in vulcanism overall. It is the underwater vulcanic activity that I am concerned with. The Earth is mostly covered by water and in that water are many more volcanos than at the surface as they run the length of the ridges that more than encircle the earth.
  14. But what evidence is there that this volcanic activity varies sufficiently on the relevant time scales to have any detectable climatic effect on the relevant time scales.
  15. Patrick That is exactly what I am working to find. The oceans are still largely big unknowns. The benefit of this entire AGW argument is that now scientists in many unrelated fields are looking harder at the evidence and investigating deeper. That government site that posted a hypothesis for the volcanic nature for the root cause for ENSO led me to look into ocean floor research and I find it's all recent research. The nature of volcanic ejecta along subduction zones lends support for the hypothesis IMO. It's recycled seafloor.
  16. Volcanoes don't drive ocean currents. Read up on thermohaline circulation.
  17. re #215 Quietman, your assertion:
    That government site that posted a hypothesis for the volcanic nature for the root cause for ENSO....
    ...is a gross overinterpretation of the relevant scientific evidence! The evidence (see [**, ***, ***] below) indicates that very strong volcanic eruptions of a magnitude that result in significant injection of volcanic aerosols into the stratosphere, can influence ocean circulation through the effects of the stratospheric aerosols on solar radiative forcing. There is no evidence whatsoever that "volcanic nature" is the "root cause" of ENSO. In fact the authors specifically state that this effect (aerosolic effect on radiative forcing) doesn't cause ENSO changes (El Nino's in the winter following the eruption), but enhances their probabilities and amplitudes. I posted abstracts of some of the relevant papers on another thread, but this thread seems most appropriate and I'll repost them here. Note that it's not the volcanic activity per se that is responsible. The heat from tectonics is far too small (the geothermal flux is around 0.1 W/m2 compared to the combined solar-greenhouse surface flux above 150 W/m2). It's the effects of volcanic aerosols on solar radiative forcing at the surface. [*]J. B. Adams et al (2003) Proxy evidence for an El Niño-like response to volcanic forcing. Nature 426, 274-278 Abstract: Past studies have suggested a statistical connection between explosive volcanic eruptions and subsequent El Niño climate events1, 2. This connection, however, has remained controversial3, 4, 5. Here we present support for a response of the El Niño/Southern Oscillation (ENSO) phenomenon6, 7 to forcing from explosive volcanism by using two different palaeoclimate reconstructions of El Niño activity8, 9 and two independent, proxy-based chronologies of explosive volcanic activity5 from ad 1649 to the present. We demonstrate a significant, multi-year, El Niño-like response to explosive tropical volcanic forcing over the past several centuries. The results imply roughly a doubling of the probability of an El Niño event occurring in the winter following a volcanic eruption. Our empirical findings shed light on how the tropical Pacific ocean–atmosphere system may respond to exogenous (both natural and anthropogenic) radiative forcing. [**] Emile-Geay J et al. (2008) Volcanoes and ENSO over the past millennium. J. Climate 21, 3134-3148. abstract: The controversial claim that El Nino events might be partially caused by radiative forcing due to volcanic aerosols is reassessed. Building on the work of Mann et al., estimates of volcanic forcing over the past millennium and a climate model of intermediate complexity are used to draw a diagram of El Nino likelihood as a function of the intensity of volcanic forcing. It is shown that in the context of this model, only eruptions larger than that of Mt. Pinatubo ( 1991, peak dimming of about 3.7Wm(-2)) can shift the likelihood and amplitude of an El Nino event above the level of the model's internal variability. Explosive volcanism cannot be said to trigger El Nino events per se, but it is found to raise their likelihood by 50% on average, also favoring higher amplitudes. This reconciles, on one hand, the demonstration by Adams et al. of a statistical relationship between explosive volcanism and El Nino and, on the other hand, the ability to predict El Nino events of the last 148 yr without knowledge of volcanic forcing. The authors then focus on the strongest eruption of the millennium (A. D. 1258), and show that it is likely to have favored the occurrence of a moderate-to-strong El Nino event in the midst of prevailing La Nina-like conditions induced by increased solar activity during the well-documented Medieval Climate Anomaly. Compiling paleoclimate data from a wide array of sources, a number of important hydroclimatic consequences for neighboring areas is documented. The authors propose, in particular, that the event briefly interrupted a solar-induced megadrought in the southwestern United States. Most of the time, however, volcanic eruptions are found to be too small to significantly affect ENSO statistics. [***]Christiansen B (2008) Volcanic eruptions, large-scale modes in the Northern Hemisphere, and the El Nino-southern oscillation. J. Climate 21, 910-922 . abstract: The author analyzes the impact of 13 major stratospheric aerosol producing volcanic eruptions since 1870 on the large-scale variability modes of sea level pressure in the Northern Hemisphere winter. The paper focuses on the Arctic Oscillation (AO) and the North Atlantic Oscillation (NAO) to address the question about the physical nature of these modes. The hypothesis that the phase of the El Nino-Southern Oscillation (ENSO) may control the geographical extent of the dominant mode in the Northern Hemisphere is also investigated, as well as the related possibility that the impact of the eruptions may be different according to the phase of ENSO. The author finds that both the AO and the NAO are excited in the first winter after the eruptions with statistical significance at the 95% level. Both the signal and the significance are larger for the NAO than for the AO. The excitation of the AO and the NAO is connected with the excitation of a secondary mode, which resembles an augmented Pacific-North American pattern. This mode has opposite polarity in the Atlantic and the Pacific and interferes negatively with the AO in the Pacific and positively in the Atlantic in the first winter after the eruptions, giving the superposition a strong NAO resemblance. Some evidence is found that the correlations between the Atlantic and the Pacific are stronger in the negative ENSO phase than in the positive phase, although this difference is not statistically significant when all data since 1870 are considered. The author does not find any evidence that the impact of the volcanic eruptions is more hemispheric in the negative than in the positive ENSO phase.
  18. ginckgo "The term thermohaline circulation (THC) refers to the part of the large-scale ocean circulation that is driven by global density gradients created by surface heat and freshwater fluxes." This is the wiki definition. It's incomplete, but close. What part do you not understand?
  19. ps Here's the latest in an ever growing string: "The volcanoes in the central African nation could be about to erupt, threatening Goma, which has a population of more than half a million people, scientists said Thursday. They made their observations on visits to the two volcanic peaks of Nyiragongo and Nyamulagira." - MSNBC Science News
  20. Quietman I've tried wading through the 9 pages of comments, and my conclusions so far are: * not a single article you've linked to says what you think it says; none of them certainly support your ideas. * "geologically fast" is still orders of magnitude longer than a human life-span. * You do not understand the magnitude of the global Thermohaline circulation; it will probably overpower the effects of just about all the heat supplied by submarine magmas, and it will certainly smooth out any short term changes in heat supply. * there does not appear to be any evidence that tectonic and volcanic activity are significantly on the rise globally * the significance of planetary alignments on the earth has been falsified conclusively as nothing more than woo; and as soon as someone asserts they understand the fundamental forces of nature better than all the specialists put together, red flags go up anyway The only aspect I don't have an immediate issue with, is that there may be a link between changes in volcanic activity and changes in surface currents (e.g. ENSO).
  21. Re: "The only aspect I don't have an immediate issue with, is that there may be a link between changes in volcanic activity and changes in surface currents (e.g. ENSO)." That was the whole point. But it's not just ENSO. It's the same at every subduction zone where sea floor meets continent. They are all cyclic in nature and the cycles are not uniform. There are at least three major subduction zones in the arctic (there are more but not currently active and therefore not recognized as such but logic dictates their locations by direction of continental movement). And a rifting area at N. E. Greenland. Alaska is currently active. Not from westward movement as the subduction zone is in Asia but along the north continental edge of Alaska. These can be seen on a good quality seafloor floor. It looks like the Canadian Shield is turning clockwise.
  22. ps You don't see the increase because you are not looking hard enough. Everyone admits that it has increased and that is what the articles point out taken collectively. I have not included all because some are just so common place. It's pnly the recently become active (and recently discovered) that make the news.
  23. I didn't make myself clear about the change in volcanic activity: I mean only subaerial emissions (not changes in the subduction regime on this short time scale), and usually only the effect of one or two major eruptions. Even then, I doubt that this is the only driver of ENSO. This is mainly because volcanic emissions can alter the weather patterns, and thus change winds, which in themselves influence ocean surface currents. The heat added to small spots on the sea floor is insignificant next to the power of the winds and the thermohaline currents. FYI there is no active subduction zone in the Arctic, only a divergent one (Gakkel Ridge). Not sure about the relevance of inactive ones. The active part of Alaska is to the south, where the north Pacific plate subducts, which is the cause of the Aleutians. The whole plate North America sits on is rotating counter-clockwise. This is a very large amount of facts you're getting wrong here. I'm not surprised anymore that you misunderstand all the references you've linked to.
  24. Re #219 Shouting insults isn't a substitute for careful and clear discourse Quietman. It's obvious that the articles that explore possible relationships between explosive volcanic eruptions and ENSO (see my post #218), indicate that it is the effect of eruptive aerosols on radiative forcing that can affect the ocean circulation in the subsequent short periods. If you've got references to scientific papers that indicates that geothermal heat from subduction zones influences ocean currents in the manner that you are asserting then why not simply list them here. And can you remind us what "That government site that posted a hypothesis for the volcanic nature for the root cause for ENSO" is? Which specific government site?
  25. As I said chris, When I relocate the article I will post it here. I had not realized just how misunderstood this science was. This explains in part how the ocean drives the atmospheric currents known as Trade Currents. http://www7.nationalacademies.org/opus/elnino.html or http://www7.nationalacademies.org/opus/elnino_PDF.pdf It does not explain the thermocline fully however so I'll try to keep finding something on it's root cause that can be linked to.

Prev  1  2  3  4  5  6  7  8  9  10  11  12  13  Next

Post a Comment

Political, off-topic or ad hominem comments will be deleted. Comments Policy...

You need to be logged in to post a comment. Login via the left margin or if you're new, register here.

Link to this page


The Consensus Project Website

THE ESCALATOR

(free to republish)


© Copyright 2024 John Cook
Home | Translations | About Us | Privacy | Contact Us