


 Arguments
Software
Resources
Comments
The Consensus Project
Translations
About
Support
Arguments
Software
Resources
Comments
The Consensus Project
Translations
About
Support
![]()
![]()
![]()
![]()
![]()
![]()
![]()
![]()
![]()
![]()


![]()


Latest Posts
- Skeptical Science New Research for Week #9 2026
- Fossil fuel pollution’s effect on oceans comes with huge costs
- Fact brief - Do solar panels work in cold or cloudy climates?
- After a major blow to U.S. climate regulations, what comes next?
- 2026 SkS Weekly Climate Change & Global Warming News Roundup #08
- Skeptical Science New Research for Week #8 2026
- Introducing the Climate Brink Dashboard
- Climate Adam - Climate Scientist Reacts to AI Overlords
- Trump just torched the basis for federal climate regulations. Here’s what it means.
- 2026 SkS Weekly Climate Change & Global Warming News Roundup #07
- Skeptical Science New Research for Week #7 2026
- These key strategies could help Americans get rid of their cars
- Fact brief - Can nearby solar farms reduce property values?
- Sea otters are California’s climate heroes
- 2026 SkS Weekly Climate Change & Global Warming News Roundup #06
- Skeptical Science New Research for Week #6 2026
- The future of NCAR remains highly uncertain
- Fact brief - Can solar projects improve biodiversity?
- How the polar vortex and warm ocean intensified a major US winter storm
- 2026 SkS Weekly Climate Change & Global Warming News Roundup #05
- Help needed to get translations prepared for our website relaunch!
- Skeptical Science New Research for Week #5 2026
- Climate Variability Emerges as Both Risk and Opportunity for the Global Energy Transition
- Fact brief - Are solar projects hurting farmers and rural communities?
- Winter 2025-26 (finally) hits the U.S. with a vengeance
- 2026 SkS Weekly Climate Change & Global Warming News Roundup #04
- Skeptical Science New Research for Week #4 2026
- WMO confirms 2025 was one of warmest years on record
- Fact brief - Do solar panels release more emissions than burning fossil fuels?
- Keep it in the ground?
Comment Search Results
Search for ice sheets
Comments matching the search ice sheets:
- Sabin 33 #13 - Is solar energy unreliable?
tder2012 at 01:41 AM on 8 May, 2025I don't read Jacobson. He gets debunked and stops with the scientific debate and then takes it to court and loses that as well. https://retractionwatch.com/2024/02/15/stanford-prof-who-sued-critics-loses-appeal-against-500000-in-legal-fees/ Bryer works closely with Jacobson, so I don't bother with him either. I have read their material over the years, for example, here is one on my blog from 2016 that my friend wrote https://tditpinawa.wordpress.com/2016/09/17/tim-maloneys-analysis-and-critique-of-100-wws-for-usa/. I believe science debates should stick to science debates. There are nine grids today that have achieved <100 grams of CO2 emitted per kilowatt hour, averaged on an annual basis that service at least 5 million people. They are Canadian provinces of British Columbia, Ontario, Quebec and then there is Norway, Finland, Sweden, Switzerland, France and Brazil. They have achieved this with either mostly hydro, mostly nuclear or mostly a combination of the two. "Your post claiming high cost of LFSCOE (made on another thread) is simply fossil fuel propaganda. It has been known for years that the last 10-20% of renewable energy will be the most expensive." You can state your opinions about propaganda all you like, how about showing the evidence in the real world, not just in Jacobson's spreadsheets, about the last 10-20% being the most expensive. Lazard didn't make changes, instead they are open about their limitations, as I quoted in a previous comment. Will Lazard scrap their limitations and instead do a complete study, as opposed to just points in time. I don't care so much about % of renewable energy, I care about CO2 emissions. Once Texas and Spain have achieved <100grams/CO2 emitted per kilowatt-hour, averaged on an annual basis, then we'll talk. Texas is 292 and Spain is close at 112, but they are planning to shut down nuclear so their emissions are likely to rise, just like everywhere else that shuts down nuclear. https://app.electricitymaps.com/zone/DE/12mo/monthly Jacobson is a big proponent of Germany, but 345 for the last 12 months, their energy system is really struggling and due to high prices, their industrial and manufacturing are slowing down. "Let’s dive into one of the most ambitious (and chaotic) energy transitions in the world" Amory Lovins was awarded the German Order of Merit in 2016 for his influence on the German "Energiewende", maybe they jumped the gun a bit with this award.
- On Hens, Eggs, Temperature and CO2
MA Rodger at 19:27 PM on 4 September, 2024rkcannon @16.
Assuming Mark Johnson @18 is correct and you do refer to the graphic posted @6 (which seems entirely sensible), your question has still not been properly addressed.
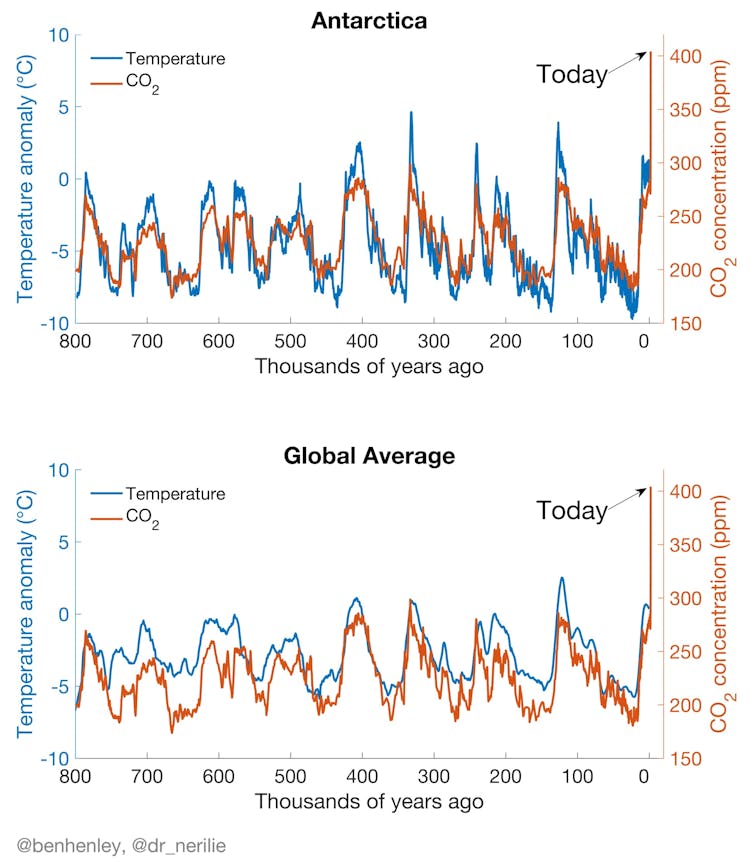
And that presumably is to ask why the CO2 fluctuations through recent ice ages (180ppm to 280ppm) are associated with large temperature fluctuations (10ºC peak-to-peak) but the larger recent anthropogenic CO2 (280ppm to 420ppm) doesn't result in any commensurate temperature increase in the graph.
There are a number of factors to consider.
(1) The forcing from changes in CO2 is logarithmic, so the recent CO2 forcing would be slightly smaller than the ice age forcing (2.2Wm^-2 as opposed to 2.4Wm^-2).
(2) It takes time for the temperature to react to an imposed forcing so only about two-thirds of any CO2-forced increase would have occurred in the decades of man-made warming so far.
(3) The ice age CO2 forcing was not the major forcing through ice ages. The change in albedo due to the shrinking ice sheets and the rising oceans would be double the CO2 forcing. Other factors like methane and dust were also in play. (The orbital forcing that triggers ice ages is very minor.) Increasing CO2 contributed perhaps a third of the ice age forcings.
(4) The temperatures being plotted are from the EPIC ice core data and thus Antarctic temperatures which wobbled tiwce as much as global temperatures through the ice ages. (Note the modern CO2 value has been added, marked with an asterisk. Grafting on the modern EPIC temperature record would be difficult, and would not show much as the instrument record is more wobble than rise.)
So taking (1) to (4) into account, the 10ºC ice age cycle in the graphic @6 would be a little smaller, say 90% (1) then a third off (2) then two-thirds off (3) and finally halved (4). So the global temperature should be very roughly something like [10ºC x 0.9 x 0.67 x 0.33 x 0.5 =] +1ºC which is pretty-much what we see globally today. - Welcome to Skeptical Science
Eclectic at 09:45 AM on 4 April, 2024Cookclimate @118 :-
You are wrong. When the arctic/Greenland ice-sheets melt, that raises the sea level near the equator, and consequently that slows the Earth's rotation. Basic physics. And you are wrong about so very much of the other stuff you posted.
Where do you get all that wrong info from?
- Welcome to Skeptical Science
cookclimate at 09:28 AM on 4 April, 2024CO2 does not cause Earth’s climate change.
It is estimated that it will cost $62 trillion to eliminate fossil fuels, but eliminating fossil fuels will be a complete waste of our tax and corporate dollars, because it will not stop the warming. You can’t stop Mother Nature.
The IPCC (Intergovernmental Panel on Climate Change) frequently shows that temperature correlates with CO2 for the last 1,000 years as proof that CO2 is causing the warming. But if you extend that to the last 800,000 years, the temperature and CO2 lines do not correlate or fit (Figure 14 in Supplemental Data). If the lines don’t fit, then you must acquit CO2. CO2 is not guilty of causing climate change. CO2 does not control Earth’s temperature. The IPCC has not demonstrated any scientific evidence that CO2 controls Earth’s temperature (they only have unproven theories).
The facts:
• Earth is currently warming (it is still below the normal peak temperature).
• CO2 is increasing (it is above the normal CO2 peak).
• Earth’s current warming is being caused by a 1,470-year astronomical cycle.
The 1,470-year astronomical cycle warms the Earth for a couple of hundred years and melts ice sheets primarily in Greenland and the Arctic. It has repeated every 1,470-years for at least the last 50,000 years. It is normal that it would be happening again. It accelerates Earth’s rotation, stopping length of day increases (Figure 9). It warms the Earth. Based on historical data, the current warming should peak near the year 2060 and then it should start to cool.
For more information, see A 1,470-Year Astronomical Cycle and Its Effect on Earth’s Climate,
and Supplemental Data,
www.researchgate.net/publication/379431497_Supplemental_Data_for_A_1470-Year_Astronomical_Cycle_and_Its_Effect_on_Earth's_Climate#fullTextFileContent - A data scientist’s case for ‘cautious optimism’ about climate change
michael sweet at 23:01 PM on 2 April, 2024William,
Once you build the wind and solar generators you don't have to buy fuel to run them every day so they are cheaper than fossil fuels. You continue to only measure the cost of the renewable side. Who cares if it costs L1.4 trl to build out renewables if the cost of fuel is L3 trl? The article I linked included storage for enough power so that there would be no shortages, you just didn't read it. Fossil or nuclear backup are not necessary.
I remember 10 years ago the IPCC report suggested that Global Warming would eventually cause sea level rise that endangered houses near the sea, wildfires and droughts that caused massive relocations of people. I wondered if I would see these damages in my lifetime. I expected to live about 25 years.
We see all these things happening now, only 10 years later. They are no longer future projections. Wildfires are destroying entire towns and massive amounts of forrest. Unprecedented droughts and floods are making it harder for farmers to turn a profit. Millions of climate refugees are already trying to access the Global North because they can no longer make a living due to climate change. The damages we currently see are much, much higher than scientists projected only 10 years ago. 40 years ago they thought the great ice sheets would take thousands of years to melt as much as they have already melted now. No-one thought that all the coral reefs worldwide would be dying off as we see today.
We do not need to wait 40 years to see these problems. You are blind to what is happening before your eyes.
- At a glance - Is the CO2 effect saturated?
Just Dean at 09:44 AM on 11 January, 2024I think this is where data from paleoclimatology can help as well. Three recent studies have looked at the earth's temperature vs CO2 during the Cenozoic period, Rae et al., Honisch et al., and Tierney et al. . Each of those show that the temperature of ancient earth continues to rise as CO2 increases. As I understand it the first two are based solely on proxy data while the Tierney effort includes modeling to try and correlate the data geographically and temporally.
All of these are concerned with earth system sensitivities that include both short term climate responses plus slower feedback processes that can take millenia, e.g. growth and melting of continental ice sheets. Both Rae and Honisch include reference lines for 8 C / doubling of CO2. In both cases, almost all the data lie below those reference lines suggesting that 8 C / doubling is an upper bound or estimate of earth's equilibrium between temperature and CO2. Also notice that there quite is a bit of spread in the data.
In contrast, when Tierney et al. include modeling they get a much better correlation of T and CO2. They find that their data is best correlated with 8.2 C / doubling, r = 0.97. Again, this represents an equilibrium that can take millenia to achieve but does to my way of thinking represent "nature's equilibrium" between T and CO2.
In these comparisons, the researchers define changes in temperature relative to preindustrial conditions, CO2 = 280 ppm. For Tierney's correlation then on geological timescale, the temperature would increase by 8.2 C at 560 ppm. At our present value of 420 ppm there would be 3.7 C of apparent warming potential above our 1.1 C increase already achieved as of 2022, i.e., global warming in the pipeline if you will.
Bottom line, based on paleoclimatological data, there is no apparent saturation level of CO2.
- Skeptical Science New Research for Week #49 2023
nigelj at 04:35 AM on 10 December, 2023MS Sweet. Good information to know.
"I note that Dr. Hansen has long held an Earth System Sensitivity of 6 C. The IPCC consensus has been 3C"
The IPCC number is "equilibrium climate sensitivity", a different thing from earth system sensativity as below. Making it hard to compare the two numbers.
"By definition, equilibrium climate sensitivity does not include feedbacks that take millennia to emerge, such as long-term changes in Earth's albedo because of changes in ice sheets and vegetation. It includes the slow response of the deep oceans' warming, which also takes millennia, and so ECS fails to reflect the actual future warming that would occur if CO2 is stabilized at double pre-industrial values.[38] Earth system sensitivity (ESS) incorporates the effects of these slower feedback loops, such as the change in Earth's albedo from the melting of large continental ice sheets, which covered much of the Northern Hemisphere during the Last Glacial Maximum and still cover Greenland and Antarctica)...."
(Climate sensitivity, wikipedia)
We will probably never know any of these numbers for sure because you can't put the planet in the laboratory. (Although I think paleo studies like the one you posted have a lot of credibility - because they are based on real world conditions). But IMHO that uncertainty is not necessarily a crucial problem. Current rates of warming are bad and are having very visible effects, and huge implicatrion in the short to medium term, and so whatever the level of climate sensitivity using whatever definition, we clearly have a huge problem.
- Greenhouse effect has been falsified
EddieEvans at 23:53 PM on 26 June, 2023Has the greenhouse effect been falsified?
Robotic Reading: Has the greenhouse effect been falsified?
While Earth’s climate has changed throughout its history, the current warming is happening at a rate not seen in the past 10,000 years.
According to the Intergovernmental Panel on Climate Change (IPCC), "Since systematic scientific assessments began in the 1970s, the influence of human activity on the warming of the climate system has evolved from theory to established fact."1
Scientific information taken from natural sources (such as ice cores, rocks, and tree rings) and from modern equipment (like satellites and instruments) all show the signs of a changing climate.
From global temperature rise to melting ice sheets, the evidence of a warming planet abounds.
- Greenhouse effect has been falsified
EddieEvans at 23:50 PM on 26 June, 2023"Has the greenhouse effect been falsified?" with current NASA evidence for anthropogenic greenhouse gas warmoing.
EVIDENCE
How Do We Know Climate Change Is Real?
There is unequivocal evidence that Earth is warming at an unprecedented rate. Human activity is the principal cause.
While Earth’s climate has changed throughout its history, the current warming is happening at a rate not seen in the past 10,000 years.
According to the Intergovernmental Panel on Climate Change (IPCC), "Since systematic scientific assessments began in the 1970s, the influence of human activity on the warming of the climate system has evolved from theory to established fact."1
Scientific information taken from natural sources (such as ice cores, rocks, and tree rings) and from modern equipment (like satellites and instruments) all show the signs of a changing climate.
From global temperature rise to melting ice sheets, the evidence of a warming planet abounds.
- Antarctica is gaining ice
Bart Vreeken at 04:18 AM on 21 May, 2023Hi Rob Honeycutt @567, there is no modification at all on the original graph from NASA itself. You can find the source below:
climate.nasa.gov/vital-signs/ice-sheets/
I only added the exact month of some of the extremes. And as you can see, I made my own calculation of the 'rate of change', with a very different result. Its calculated over 20 full years since February 2003, to avoid seasonal effects. (2280 Gt / 20 = 114 Gt/y). Where the 149 Gt/y published by NASA comes from, I really don't know. In the previous version it was 151 Gt/y.
- CO2 lags temperature
Daniel Bailey at 01:46 AM on 19 May, 2023For a longer view of the correlation between CO2 concentrations and global temperatures, look no further than this reconstruction of the past 540 million years of such from Scotese (Scotese 2021 - Phanerozoic paleotemperatures: The earth’s changing climate during the last 540 million years):

Link to paper
And leaving the last word on the subject to Scotese, a true expert in the field:
"It has been long recognized that the Earth’s climate, in particular the average global temperature, has alternated between ”icehouse” and “hothouse” states. More than 70 years ago, studies recognized that these climatic “modes” varied on short-term, medium-term, and long-term timescales. During the past 20 years, due to much outstanding research, we now stand at the threshold to a deeper, more complete understanding of both the tempo and mode of global temperature change during the Phanerozoic.
The Earth’s long-term temperature change is controlled by multiple tectonic and environmental processes that drive the Earth’s climate from icehouse to hothouse conditions, and vice versa. Many of these factors are interconnected by a complex network of positive and negative feedback loops that can accelerate or decelerate changes in long-term global temperature.
We are currently about halfway through a typical glacial/interglacial cycle. If humans did not inhabit the Earth, about 20,000 years from now, global temperatures would have once again begun to fall and ice sheets would have expanded into the oceans surrounding Antarctica and would have descended from the Arctic to begin a slow and steady march across the northern continents. However, this will not happen. The Earth has entered a “super-interglacial”. The injection of CO2 into the atmosphere as a consequence of the burning of fossil fuels has warmed the Earth more than 1°C and will continue to warm the Earth for another 300 years (~2300 CE).
In conclusion, we are leaving our Ice Age heritage behind. A new, warmer world awaits us. The problem we face is not so much where we are headed, but rather how we will get there."
- EGU2023 - Highlights from the last week of April
John Mason at 22:00 PM on 28 April, 2023My take on Friday so far: Baerbel has already covered sessions where we were both present above.
I particularly enjoyed CL1.1.4: Deep-time climate change: insights from models and proxies. This session provided a wide-ranging series of palaeoclimate studies looking at various parts of and the whole Earth at key points in the past such as the Permo-Triassic transition, the K-T extinction and the early Cenozoic hyperthermals.
Some topics were more familiar than others, for example looking at the selective nature of the K-T extinction interval in the oceans: the post-impact 'winter' actually had a positive effect on e.g. siliceous diatom productivity whereas the Deccan Traps large Igneous Province was mostly negative in that instance. Calcareous planktom however suffered greatly. The most though-provoking presentation, "Resilience and implications of an Antarctic monsoon during the Eocene", was something I had not looked at before. It appeasrs there were local ice-sheets even then, but unlike today the continent's periphery supported dense forest.
It's refreshing to be with so many people to whom the key principles of climate forcings are no longer argued over but instead it's the increaingly minute details of past climates that are under investigation and being presented.
One word on presentations: it's a pity that presentation skills are not taught at final year undergraduate level. I've seen talks varying from absolutely outstanding to hard-to-follow this week. The cause of the difficulty variably includes talking at breakneck speed about highly complex topics, large blocks of text in slides too long to read for their display-time and using too small a font size to even screengrab effectively. Some, by no means all people need to learn how to communicate findings more clearly (the EGU Guidelines are quite specific in this respect) and in addition, every author had a Supplementary Material folder in which to upload a more detailed file. Attention to such points would have made an aleady enjoyable event even more so!
- The Big Picture
Bart Vreeken at 21:31 PM on 22 March, 2023N R N P @168
Shall I have a try in answering your questions? I live in The Netherlands and here we have the same kind of discussions. Excuse me in advance for my English, it seems to be horrible.
A. Changing for the worse?
I hope we do agree that the earth is warming. It's an on going process and we (science) expect that it will go on for a much longer time. So it gives a lot of changes in the climate almost everywhere.
A key point is that the continents and the oceans are warming in a different speed. The oceans are warming much slower. This has consequences. When the atmosphere warms up it can contain more water vapor. But the less warming ocean can't deliver enough water vapour to keep the more warming continents humid enough. As a result there is more risk for drought at many places.
An other thing is that the air whole circulation will change. It means that local climates can change more than the global average. Wet climates can turn to dry climates, but also the other way round. Our agriculture, infrastructure and houses are not (always) prepared for that.
As you know, a warmer climate makes the sea level rise. The warmer water in the ocean expands, the ice sheets and mountain glaciers are melting to a certain extent. This sea level rise will give a lot of problems in many coastal areas. Here in the Netherlands the protection against the sea is very well organized, we can manage the first one or one-and-a-halve meter in this century. When it gets more we have a problem, but we are already try to prepare for that. Other countries, including deltas in Asia and parts of the US are less protected and will have large problems before 2100. By the way, it's not only the sea level rise there. Many of these places have also subsidence of the land, but these two come together and the problems are coming much faster then without sea level rise.
And then there is the unpredictable part. We don't know exactly how the ice sheets will react. Maybe there are mechanisms for a quick decline of parts of the ice sheets. In that case we have less time to prepare for it.
Of course, there can also be places where the climate gets better, or at least in a part of the year. And at least, we will need less fuel for warming the houses. (but more electricity for cooling in the summer.)
An interesting point is the direct effect of the increasing CO2 level to the vegetation and the agriculture. Plants can grow faster with that. Remote sensing shows something like 'global greening'. But it's a mixture of natural response and increasing agriculture. The last thing is tricky when water recourses are limited. And as we have seen, the increasing risk for drought is a cause for concern by itself. Maybe you know the story of the Aral See?
Then your question B) changing because of human activities?
Yes, we can be sure about this. We could calculate the effect of increasing CO2 hundred years ago and it's just what happening. Other possible factors, like changing sun power don't have much effect, these changes are too small. The less known part is how the atmosphere reacts (water vapor, clouds), how the ocean circulation reacts, how ice sheets react in detail.
"C) why this time it is different than the changes that have taken place?"
The changes are going very fast now, and as I said, the houses, the infrastructure, the agriculture and the water supply are not prepared for these changes. And there is the risk for sudden, even faster changes (tipping points). - The Big Picture
MA Rodger at 21:42 PM on 18 March, 2023Bart Vreeken @80,
That is a curious quote about the Greenland contribution to Netherland SLR given the KNMI Report also says on P22:-
The mass loss of the ice sheets of Antarctica and Greenland and glaciers continues unabated. Since 1993, this component has been the largest contributor to sea level rise.
The idea that the melt water from Greenland, part of the largest contribution to SLR, should somehow choose to avoid the seas off the Netherlands is somewhat silly. I think the idea being expressed is that (as explained within the KNMI Report) SLR is not appearing so much off Netherlands due to altered weather in the North Sea and so the 'Greenland melt' is being used in your quote synonymously for SLR.
- The Big Picture
Bart Vreeken at 20:35 PM on 18 March, 2023Bob Loblow @75 you said:
"Another clue for you: losing ice at lower altitudes around the perimeter of the ice sheet, and gaining ice at the higher altitude is Business As Usual for continental ice sheets. There is this thing called "glacial flow" that moves ice from the accumulation zone to the ablation zone"
Well, that's great. Do you really think I would write about Greenland when I didn't know how it works?
My turn then. The mass change of Greenland by year. Cherry-picking? Maybe, but I use all the available data of GRACE. Over a longer period (altimetry data) there is an increase of mass loss. Don't pay too much attention to the trendline, for the data have a lot of noice. But there is a similarity with Antarctica: more snowfall in the last years, caused by less sea ice.

- The Big Picture
Bart Vreeken at 19:48 PM on 18 March, 2023Thank you michael sweet @72 for the map of Greenland, based on altimetry. I didn't know this one, it's different from what I expected. I was too quick with my map of the SMB anomaly of only this year, it turns out to be untypical. Never the less we don't expect so much contribution from Greenland here. From the KNMI-report we discussed before:
"Many factors have been taken into account in the calculation of sea level rise on the Dutch coast, including the expansion of the oceans due to warming, self-gravitation, the changes in salinity, and the mass loss of glaciers and ice sheets in Greenland and Antarctica. Because the melting of the Greenland Ice Sheet hardly contributes to the sea level rise off the Dutch coast, we expect that the increase here will lag slightly behind the world average."
- The Big Picture
michael sweet at 12:36 PM on 18 March, 2023It is a real phenomenom that when the great ice sheets in Greenland and Antarctia melt that means there is less gravity there and the sea flows away. I remember that around Greenland itself that could be tens of meters less water and more around Antarctia. There are papers describing where in the globe there will be less water and where there will be more water (ths article describes the affect). By looking at the pattern of sea level rise (upthread I posted a map of sea level rise) and seeiing where it is higher and where it is lower scientists can get an idea of where the water is coming from.
Bart Vreeken posted a map upthread, it is probably accurate. They suggested that melting in the Antarctic will result in higher sea level rise than the global average but melting in Greenland will result in less sea level rise than the global average in Holland. Different parts of Greenland affect Holland differently.
There are other effects on sea level rise that are not intuative. The Gulf Stream carries water from North America to Europe. Sea level in Europe is about 1 meter (!!!) hgher than off North America. If the Gulf Stream stopped, sea level in Europe would decrease substantially while the East coast of the USA would flood. Who wudda thunk.
- The Big Picture
Bob Loblaw at 11:28 AM on 18 March, 2023Bart @ 62:
In addition to pointing out what Rob said to you at comment 64 about the error in using Surface Mass Balance, I note that you have also given a map of SMB for a single winter season. Do you not bother looking at the ful captions of the figures you pick up? This one does not need translation from Dutch - it is dated March 16, 2023, and states "Accumulated anomaly since Sep 1, 2022".
You're back to the same basic error that you made in your very first post here at SkS on March 9, regarding Antarctic ice. Treating a single year of data as if it represents a long term trend.
At least you honestly say "...how the Greenland Icesheet reshapes at the moment..." Now all you need to figure out is that "the moment" is not enough to make predictions about the future.
Another clue for you: losing ice at lower altitudes around the perimeter of the ice sheet, and gaining ice at the higher altitude is Business As Usual for continental ice sheets. There is this thing called "glacial flow" that moves ice from the accumulation zone to the ablation zone. You should read about it some time.
- Antarctica is gaining ice
Bob Loblaw at 04:15 AM on 10 March, 2023Bart Vreeken @ 537:
Ahh, so you are focussing on the noise, not the signal. The year-to-year variation is large, and one year of adding ice does not a trend make. So, there has been a year where close 400 Gt was added - and there have been four years in the record you show where 300-400 Gt per year was lost (2007, 2010, 2015, 2018).
The "rebound" of 2022 is simply a strong positive departure from the long-term trend after several years where individual years were below the long-term trend. You might benefit from reading about Regression toward the Mean.
In a noisy, short data set, adding or removing one exceptional year will have a strong effect on the average. With only 20 years of record, +400Gt in one year will shift the average by 20 Gt. This is not exactly ground-breaking analysis.
And in continental-scale ice sheets, it takes decades to centuries for mass added in the central areas to reach the perimeter. You are familiar with the phrase "glacially slow", aren't you?
So again, exactly what is your point, other than "this is interesting"? And what, exactly, do you want me to read about in the paper you link to? Refer to a diagram, section of text, or something concrete.
- Antarctica is gaining ice
MA Rodger at 01:05 AM on 10 March, 2023Bart Vreeken @533,
You appear to be plotting out the GRACE/GRACE-FO data as per this NASA web page (which shows data to Oct 2022). This gravity data does not measure Sea Ice which is floating. And for clarity, it is not Surface Mass Balance which you correctly say had an exceptional year last year (as per this NSIDC post of January 2023, snowfall being high enough to "completely offset recent net ice losses from faster ice flow off the ice sheet for this assessment period. Most of the past decade has seen annual net losses of 50 to 150 billion tons."

So a record year for the 2023 Antarctic Sea Ice Extent minimum as well as a record year for the 2022 Antarctic Surface Mass Balance.
Antarctica doesn't get a lot of attention, compared to the Arctic cryosphere. Certainly for Antarctic Sea Ice, the mechanisms driving the variations is a lot less straightforward in the Antarctic.
- Skeptical Science New Research for Week #52 2022
Daniel Bailey at 07:57 AM on 1 January, 2023
Michael Mann has tweeted against the conclusions in this paper (see these whole threads):
https://twitter.com/MichaelEMann/status/1603437412272726017
https://twitter.com/MichaelEMann/status/1603446912073764865
Reading Hansen's piece, I was wondering why he never mentioned literally at least dozen papers (going back to before the AR5) plus the most recent assessment, the AR6 (I had a hard time believing that his entire author team also missed it, too).
This illustrates the need for peer review by non-affiliated experts prior to making things public...and to rely upon primarily the major scientific assessments and the published, peer-reviewed science.
This is the salient portion of the Lunt paper from 2010 that Mann references:
"Our combined modelling and data approach results in a smaller response (ESS/CS∼1.4) than has recently been estimated using palaeo data from the Last Glacial Maximum, 21,000 years ago (ESS/CS∼2). This is probably due to the fact that transitions from glacial to interglacial conditions in the Quaternary involve large changes in the Laurentide and Eurasian ice sheets (see, for example, ref. 36), which result in a significant large-scale albedo feedback in these regions that is irrelevant for climates warmer than present. Furthermore, the main driver of Quaternary climate change is ultimately orbital forcing, which is close to zero in the global mean, and is therefore difficult to reconcile with a traditional climate sensitivity analysis."
Note the expression of the ratio of ESS to CS (Earth System Sensitivity to Climate Sensitivity). If CS=3 C (per doubling), then therefore ESS would be about 4.2 C (and not 10).
- From the eMail bag: A Review of a paper by Ellis and Palmer
Bob Loblaw at 03:43 AM on 9 October, 2022The albedo argument of Ellis and Palmer is an odd one. They explicitly state in their section 3.2 that they think it is incorrect to consider the albedo effect as a global one. In discussing the common approach to albedo feedback amounts, and comparing it to the CO2 feedback, they state:
The strength of the albedo feedback was calculated as being in the same range, or about 3 W/m2 over the full interglacial cycle (Hansen et al., 2012, Fig. 5c and p12). This figure was derived by equating albedo with sea levels, and therefore with ice extent, which spreads the albedo effect out across the entire globe in a similar fashion to the calculation for CO2. But this is likely to be an erroneous procedure.
They go on to argue that their localized "one day, one latitude" calculation of radiative effects is the proper one to use. They conclude one paragraph with:
As Fig. 3 clearly demonstrates, interglacials are only ever triggered by Great Summer insolation increases in the northern hemisphere and never by increases in insolation during the southern Great Summer, so why spread the influence of albedo across the entire globe?
To put it simply, the change in local or regional albedo represents one part of global albedo. To address the question of how much solar radiation the globe absorbs (which is the proper question for looking at global climate), you need to consider all of the globe - each latitude, each day, and each individual surface cover. The contribution of a single location is directly proportional to the area it covers - as a fraction of the total area of the planet.
Global changes in global albedo, caused by large white ice sheets replacing dark forests (or the reverse), is an important feedback. When climate science speaks "albedo feedback", it is this large scale issue that they mean, not Ellis and Palmer's local microclimate one.
The Rapp et al unpublished paper that MA Rodger refers to is an interesting side note. It still focuses on albedo and high-latitude insolation. It at least considers the entire year, not just the summer solstice, but it's efforts at modelling still are extremely simplistic - empirical fits between ice volume and variations in solar input. No actual climate model to provide precipitation inputs or melt processes, or glacier dynamics models to accumulate ice and move it from zones of accumulation to zones of melt.
The Rapp et al paper also seems to be rather confused about CO2 as a feedback vs. CO2 as a forcing. They argue against a straw man: that mainstream climate science thinks that CO2 is supposed to force the glacial/interglacial cycles. (It does not.) CO2 is one feedback. The overall CO2 level influences whether climate will respond to Milankovitch cycles by producing glacial/interglacial cycles, but it does not cause the individual glacial/interglacial periods. A world at 200 ppm CO2, a world at 300 ppm CO2, and a world at 450 ppm CO2 will not respond to orbital changes in solar insolation in exactly the same way.
- From the eMail bag: A Review of a paper by Ellis and Palmer
nigelj at 08:07 AM on 8 October, 2022Something obvious seems to have been missed here. The paper says that increased CO2 leads to more greening of the planet and thus less dust on the ice sheets, and so a cooling effect (parpahrasing). But we have had increased CO2 and increased greening of the planet and a warming effect. Doesn't this failure of their prediction kill their idea dead, all other things being equal?
- No, a cherry-picked analysis doesn’t demonstrate that we’re not in a climate crisis
nigelj at 07:59 AM on 8 October, 2022Sea level rise appears to be following a quadratic (parabolic) curve. Perhaps this is not surprising because steadly increasing and accumulating CO2 levels in the atmophere and known positive feedbacks causing the warming trend, would be consistent with a parabolic function, and not so much a linear or exponential function. But if antarctic ice sheets physically destabilise that could be a local exponential function.
- What’s going on with the Greenland ice sheet?
DK_ID at 12:27 PM on 1 September, 2022I had read of this study. I wish the expected minimum of GL melt were added to the expected SLR from land glaciers and thermal expansion plus an expected contribution from Antarctica. I believe SLR is tracking at or above IPCC maximum expectatons which would give 3-ft by 2100 without much contribution from the big ice sheets. The ARs have started icluded a footnote re the unlikely but feasible collapse of portions of the big ice sheets. But isn't collapsing how the Laurentide sheet left so quickly?
Hansen, et al 2015 showed that melt water from the GIS could slow the overtuning current resulting in more warmth staying in the Southern Ocean at the same depth as the grounding line for Antarctic draining glaciers. DeConto Pollard 2015 modeled collapse mechanisms (structural instabilities) of tall ice cliffs produced by melting and calving of those glaciers.
So I'd think the bad news from GL means bad news for the west and east Antarctic Ice Sheets and expected SLR by 2100 could be closer to 6' in a moderate emissions scenario. The question is, how much of that is already locked in? I understand the compulsion to not be too unconservative, but maybe it's time for a realistic look at what we are really expecting.
- Antarctica is gaining ice
MA Rodger at 02:08 AM on 21 June, 2022Eclectic @525,
I don't think it is correct to say that Swally's Antarctic ice loss hypothesis is "now obsolete." It is glaceologists conundrum which implies a level of ice loss from Antarctic Ice Sheets that are certainly outside the levels calculated by more conventional methods, thus an "outlier." But surely the conundrum has yet to be resolved, thus Zwally et al (2021).
- Antarctica is gaining ice
Andrew LB at 07:26 AM on 20 June, 2022
"Over the last two decades, the Greenland and Antarctic ice sheets have been losing mass, glaciers have continued to shrink almost worldwide, and Arctic sea ice and Northern Hemisphere spring snow cover have continued to decrease in extent (high confidence) (see Figure SPM.3). (4.2-4.7)"
NASA Study in 2015 clearly states Mass Gains of Antarctic ice sheet are greater than losses. I'll quote it.
A new NASA study says that an increase in Antarctic snow accumulation that began 10,000 years ago is currently adding enough ice to the continent to outweigh the increased losses from its thinning glaciers.
The research challenges the conclusions of other studies, including the Intergovernmental Panel on Climate Change’s (IPCC) 2013 report, which says that Antarctica is overall losing land ice.
According to the new analysis of satellite data, the Antarctic ice sheet showed a net gain of 112 billion tons of ice a year from 1992 to 2001. That net gain slowed to 82 billion tons of ice per year between 2003 and 2008. https://www.nasa.gov/feature/goddard/nasa-study-mass-gains-of-antarctic-ice-sheet-greater-than-losses
On a separate personal note, having lived less than a 2 minute walk from the pacific ocean for the past 40 years, i have yet to see any rise in sea level. One of the docks near my home has pole marked to indicate the current tide height and it's been there for at least 30 years, and a zero foot tide is still indicated spot on all these years later.
I think a lot of the people on this site are unaware of their own motivations and almost religious adherence the government mandated narraitive. It's usually a good idea to actually listen to the people in charge of international climate policy and you'll realize it's all a lie. United Nations climate official Ottmar Edenhofer said the following just a couple years ago.
"One has to free oneself from the illusion that international climate policy is environmental policy. This has almost nothing to do with the environmental policy anymore, with problems such as deforestation or the ozone hole,"
And just a few years prior to that he said:
"the next world climate summit in Cancun is actually an economy summit during which the distribution of the world's resources will be negotiated."
And a bit more insight:
"This is the first time in the history of mankind that we are setting ourselves the task of intentionally, within a defined period of time, to change the economic development model that has been reigning for at least 150 years, since the Industrial Revolution,"
"This is probably the most difficult task we have ever given ourselves, which is to intentionally transform the economic development model for the first time in human history."
And my favorite is how they went on to say that in order to make this happen, they must plunge the world economy into a depression in order to force the end of capitolism.
- Antarctica is gaining ice
Shalom Wulich at 22:11 PM on 18 June, 2022Hi Philippe,
So following the fact that measured data wasnt aligend with the CMIP5 model, now there is new explantation - Good for science!
CMIP6 - you are king !
Were Policy makers aware that in 2014 IPCC CMIP5 got it wrong and now there is a correction with new explanation ? Are they being told of all the corrections ? if so where in the SPM ?
Additionally , if the models then were wrong and now fine tuned, how can we be sure that now they are ok ? what new findings might finetune future models ?
So while we rely on these models to drive policy it might be that in the future, due to these model coming out wrong, we might find ourselves regreting actions we took based on wrong predictions ?
If we go back to 2014 AR5 and review the SPM this is what I make of it:
IPCC - the model predicting Antarctic sea ice got it wrong, lets not include it in the report. If we do include it, it might raise concerns on the validity of the other models we used. Why raise this doubt to begin with ?
Policy makers understanding- Ice is decreasing dramatically all over. Measured data is aligend with models, we go to do something, IPCC is totally right !
Attaching the 2 links showing the Arctic and Antarctic trends measured vs. model and the CMIP5.
The approval CMIP5 model got it wrong
The IPCC used models
and again qouting the key section from IPCC AR5 2014 report:
B.3 Cryosphere
"Over the last two decades, the Greenland and Antarctic ice sheets have been losing mass, glaciers have continued to shrink almost worldwide, and Arctic sea ice and Northern Hemisphere spring snow cover have continued to decrease in extent (high confidence) (see Figure SPM.3). (4.2-4.7)"
Where is the other trend ? The Antarctic sea ice ???? Ohhhh. That. It's not relevant now.
- Antarctica is gaining ice
Philippe Chantreau at 06:12 AM on 18 June, 2022Shalom,
You are launching accusations of nefarious intent. However, you are not producing anything even close to evidence that would support such accusations. In fact, the accusations thenselves are about actions that have not taken place and facts that are imaginary.
The treatment of polar regions in the 6th assessment is summarized here. It says: "For Antarctic sea ice, there is no significant trend in satellite-observed sea ice area from 1979 to 2020 in both
winter and summer, due to regionally opposing trends
and large internal variability." The trend is not significant because it is less than the uncertainty. Antarctic sea ice is not ignored or swept under the rug. As usual with IPCC reports, the full treatment of the polar regions is accessible online.
Not only does it not ignore Antarctic sea ice, it provides numerous references for it:
Turner et al., 2017
Kusahara et al., 2018
Meehl et al., 2019
Wang et al., 2019
Before asserting that a trend is being ignored, it would also make sense to ensure that there is really a trend to speak of. Turns out that there isn't: "Total Antarctic sea ice cover exhibits no significant trend over the period of satellite observations (Figure 3.3; 1979–2018) (high confidence) (Ludescher et al., 2018)."
Interestingly, this was compiled before the lowest extend on record, which was in 2022.
Last point, about models. Another quote from same AR6: "Coupled climate models indicate that anthropogenic warming at the surface is delayed by the Southern Ocean circulation, which transports heat downwards into the deep ocean (Armour et al., 2016). This overturning circulation (Cross-Chapter Box 7 in Chapter 3), along with differing cloud and lapse rate feedbacks (Goosse et al., 2018), may explain the weak response of Antarctic sea ice cover to increased atmospheric greenhouse gas concentrations compared to the Arctic (medium confidence). Because Antarctic sea ice extent has remained below climatological values since 2016, there is still potential for longer-term changes to emerge in the Antarctic (Meehl et al., 2019), similar to the Arctic."
- SkS Analogy 1 - Speed Kills: How fast can we slow down?
Evan at 21:42 PM on 20 February, 2022Santalives you ask "... is there a problem here?"
Coming out of the last ice-age cycle temperature rose 5C, causing a sea-level rise of 400'. Temperatures have already risen 1.2C and there is enough carbon in the atmosphere, already, to take us to 1.7C. There is over 200' of sea-level rise locked up in the world's ice.
We know that ice melts when it gets warmer and scientists are witnessind destabilization of the big ice sheets in Antarctica and Greenland.
More carbon -> higher temperatures -> more ice melting -> higher sea-level rise -> problem
This is just one of many problems.
- The new IPCC Report includes – get this, good news
MA Rodger at 19:26 PM on 15 August, 2021anticorncob6 @1,
The CO2 budgets quickly become very complicated and comparing them takes a little spade-work. Here is my simplistic take on it.
That 2013 Carbon Budget you link to is quite a generous one, even though it is for +2ºC AGW. Its 1,000Gt(C) emissions budget or 3,664Gt(CO2) with an Airborne Fraction of 45% would yield [1,000 x 0.45 / 2.13 + 275ppm=] 486ppm atmospheric CO2 by 2090 (followed by negative emissions). Other Carbon Budgets, for instance the IPCC SR1.5 budget from 2018 set a budget at 432ppm for a 66% chance of avoiding +1.5ºC AGW, this with large negative emissions to follow the reaching of zero. (My assessment here using the simplistic Af=45%.) The AR6 SSP1-2.6 with its 2% annual reductions for a +2ºC AGW, again followed by negative emissions post 2075, I'd assess at something like 285Gt(C) post-2020 so 474ppm, not greatly less than that 2013 Budget you linked to @1. Mind the real wake-up numbers come from AR5 which put the 66% +1.5ºC AGW at 417ppm.
You mention the "positive feedbacks" and perhaps nigelj @2 should have added that land ice will continue melting away unless global temperatures are reduced, the worry being that Greenland will melt down (taking millennia) with warming somewhere between +1.0ºC & +2.0ºC AGW and with nothing to stop it once its summit drops down to warmer altitudes. And the stability of the West Antarctic ice is potentially even more sensitive to warming.
Specific to being "positive feedbacks" (which melted ice fields are not unless they entirely disappear & so reduce albedo), the melting tundra is also a process which will continue for centuries without a return to a chillier climate. The size of such the feedback from melting tundra will depend on how hot we make it.
Keeping the ice sheets intact and the tundra frozen is one of the more obvious reasons why limiting AGW to +1.5ºC is a sensible policy.
- The number of lives that clean energy could save, by U.S. state
Jds at 04:50 AM on 21 July, 2021Data graphs... Interesting... Fact sheets, do tell. Article by who? Really. Source links to a group that links it's source information back to itself.
C02 is not a poison until it reaches highly concentrated levels. Rarely happens.
.04% of our atmosphere is c02. .0016% of that .04% is manmade. Multiply the two figures together to get the % of the atmosphere which is manmade c02. That's .000064. If you added .000064% pink panther fiberglass to your outhouse your butt would still be cold in the winter.
Studies reveal!!! What studies? Oh, Yale. University. Must be smart kids there these days. Reading books. Looking at thermometers.
Been researching C02 detectors myself lately. Basic description for the most detailed I shall provide now.
Too housing contains filter mechanism. Bounces Electrons (little buggers) back and forth between electrode plates. Electrolytes (salt water? Potassium? Gatorade?) change c02 to o2 through oxidation (rust) and reduces (evaporates)... get ready far this... oxygen into water. O into H2O. Yup... water into wine as well I suppose. The electrodes are biochemically sensitive to these changes.
I'll have to look this convuluted one up again for further details. It didn't mention any silicone chips nor as usually typical the almighty laser.
Fancy thermometer at best. Get yours free shipping from Walmart for like $30.
You can't even find anyone who wants to admit being the inventor of these snake oil charms nor will you find any original patents. Yet hundreds of mostly fly by night companies sell them for prices up into the thousands.
Shows parts per million.
NASA has these million dollar detectors that shoot lasers from far above to hit the earth surface and I suppose eventually be picked up by some big Gatorade coated hunk of metal which detects out of each of the million parts that exist in the atmosphere... 400 are C02. Further calculations determine that we cased half of this.
Here is an interesting argument. It has been millions of years since the global temperature and C02 levels have been this high and man wasn't even around back then which proves man is the current cause!!! Most unintelligent argument to date. Who caused the high rates back then if we were not around? Wooly mammoth? Hairy hippos? It's like saying your daughter's boyfriend must not have worn a condom the last time they had sex because your great grandmother was pregnant at one time.
Please think before you make pointless arguments.
We humans if all in one spot on a globe shoulder to shoulder would not even be much of a pin point. Combine all of our biggest cities into one megalopolis... a small freckle on the on the face of ma Gaia.
Mother earth has made home for countless creatures... if we were to just add the ones we have yet to discover to the internet... google would overheat and break down from an overload. And yet we still search for even one or to life forms elsewhere.
Mother earth has survived subzero trips to the shore and hot lava baths. She is covered in worm poo and skunk diddle.
And you worry she will die from second hand smoke which has been circulating since the dawn of her birth.
Your numbers are baseless. Your charts disconnected. Your facts biased. Your proofs conjectured. Your projections assumed. Your own researched will lead you down rabbit holes that will have you as well ask questions to determine validity. Give it time and you find... fancy thermometers. People pointing lasers at silicone chips. Digital readings.
There are no valid reputable respectable people in the realm of all of our highest minds who can validate and properly explain the how function of your fancy thermometers. They just assume like you did that the producers knew what they were doing by way of high intelligence and education and not one in the line of them would ever attempt to decide or hoodwink. Nobody dares to question fancy thermometer for fear they will look unintelligent themselves.
And you can take my statements directly to any of our scientists. Then bring those kids to me. I would like to see their heads sink in sullen shame as we review all of the information available in the world about fancy thermometer... and here them admit to it's nonsense.
Nice charts. Splendid graphs.
Pretty fancy thermometers.
Now prove to me that our c02 without one shred of any doubt 100% caused the average number of tsunamis per year to go from 2 to 3.
Show me just one autopsy report stating cause of death was... air pollution.
Show me the beaches where brilliant scientists are dutifully lined up measuring constant instant by instant changing ocean depths and receding shorelines.
Show me that the number of facilities which extract atmospheric data from the air are evenly distributed across the world and not primarily clumped into rural areas. The ratio difference of such facilities between rural and non grows every year in favor of the rural. That in itself makes for apparant temperature anomalies.
Show me where climate summits, committees, activist gatherings and fancy thermometer operators ever saved or even improved the life of even one person. Common sense of a child would tell you if they spent one tenth of the time exploring ways to prepare ourselves for natural disasters that are unavoidable regardless of our activities (you do know such things exist?) they would save many lives. Just one tenth of your focus shifted toward a more fruitful activiy... it is not much to ask.
Show me empirical evidence and precision studies prove that a two degree raise in global temp makes an unstable earth when global temperates rise and fall many multiples of degrees higher and lower within seasons (Siberia holds 100° record differential), months, weeks, days, hours... any increment of time. Regionally two degree shifts happen within seconds... why can you not make a connection to calamity in these instances? Why do you refuse to admit 2° shifts over a century might be a small % normal. bet if I told the right activist that scientists predict an unpredicted ten degree shift in average global temperature within the hour... those activist would fall in panic, run out the back door with their fancy thermometers pass out from the frantic exhaustion of getting their ownselves heated over a common occurrence.
Show me the credentials of each and every root source of every last statistic you have blind faith in. I would like to know if fancy thermometer makers might not be pushing a few numbers. Bet your bank account some are.
Show me how C02 is killing anything currently. Start looking for actual single file individual case examples in the anals of all our history of even one person who passed out from too much carbon dioxide... I'll give you the rest of your life to produce such papers... good luck. Before you can do that I will prove c02 allows for more life to flourish.
Show me a year that has not had both record high and low temperatures. Of course we must remember readings are not evenly dispersed yet and the lasers attached to satellites are yet to be a cover all.
Show me again the ice age many of the scientists from the 70's were warning us about... where is it? Guess that concept was beginning to sell less copies so they had to change the format or big guv who has an interest in people who have a concern the main public is following will stop funding them... seriously I want you to reread that last statement a few times... let it sink in. Think about the implications and how very real they might we'll be.
Show me causation, not correlation. The person did not get a sun tan on a hot day because a coconut dropped on their head that day.
And really a bunch of the information I may come up with is questionable as well. Who knows what's right? They give us estimates, rounded figures, apple orange comparisons. Coming up with pictures of prehistoric creatures bases on fragments of a single jawbone... then tell us approximately how millions of years since jawbone beast roamed earth... somewhere within this multimillion year range... and the temperature at that time was... and their favorite food was... and they squatted when they pooed fluffy spinich like clumps. Really. They know these facts due to the data represented by their Walmart C02 detectors.
Suckers are not born every minute. They develop through passages of time by way of emotional stimulations. They are targeted. Their opinions are advocated, supported and fed so to break down their defenses. Once trust is gained... (after all, fancy thermometer man has my same concerns therefore his concerns are for me personally as well)... they strike.
And you buy... in full... pun intended (aren't most all?).
And I buy as well... in part.
I wish not to find you reGret the weather... the Thunder... the iceBerg. Us grown ups are patiently waiting for your heroes... your people of the year... fan favorites... to grow up yourselves and drop the hatred and blame. Please stop pointing to the minute spinach stains on the teeth of others when immense festering cavities are being ignored.
8% of human c02 production counted is through breathing. So you can't get us to net zero anyway unless you well... kill us. A % of our CO2 production which makes up part of the statistical reports you adhere to... are from farm animals... eating, pooing, breathing... existing. Us meat eaters are trying to be rid of them as well for your satisfaction but only so much can fit on the plate.
Getting to NetZero is impossible. Waste of time anyway.
Proving that the .00005% is the only factor in 2° rise in the last century is harder than proving the chickens furting in a tornado caused more property damage.
Please be useful.
Activism is well intentioned griping. Would you like reward for it? I don't ever think I found any activist of any cause who enriched our environment beyond a sprinkling... especially the griping or as as I like to call the negative activist. Even the great MLK who was a positive activist is predominantly known by his most endearing followers by just four words... "I had a dream" sad how the majority of the world only knows this much of the man. The four words can be attributed to anything. Further research will educate a follower his dream was basically that some day all races will get along... not to insult but many have said same message with less recognition. It was a world wide sprinkling recognized best because of his ability to sell the product of his speech with the decor of his character. Charisma was the salesman. Same for the young swedish girl with face twisting sputtering gripe furiously. If said in a calm sensible tone she would have been ignored. So I see the point of bringing out the personality to sell the product. A 90 yo business owner/salesman friend told me to be successful you must sell the sizzle not the steak...
I will not abide to that when it comes to you and this subject you invested in. Instead I simply ask you...
where's the beef?
- Climate's changed before
MA Rodger at 00:21 AM on 14 July, 2021TVC15 @873,
Your denialist is actually making four bold statements that are patently nonsense with the rather pathetic request that you "Tell us why this Inter-Glacial Period should be different."
"Ice sheets and glaciers always melt during Inter-Glacial Periods." The melting actually happens in the run-up to the "Inter-Glacial Periods" which is what makes them "Inter-Glacial Periods" so in one respect this is entirely straw man territory. If the bold assertion is that glaciers and ice sheets shrink as they do today throughout an inter-glacial, that is false as sea levels of past millennia demonstrate.
"Sea levels are normally 4 meters to 14 meters higher than they are now during Inter-Glacial Periods." This is not supported by the evidence that
suggests only two or three of the eight had higher sea levels. (The graphic is from here but originates from this web engine.)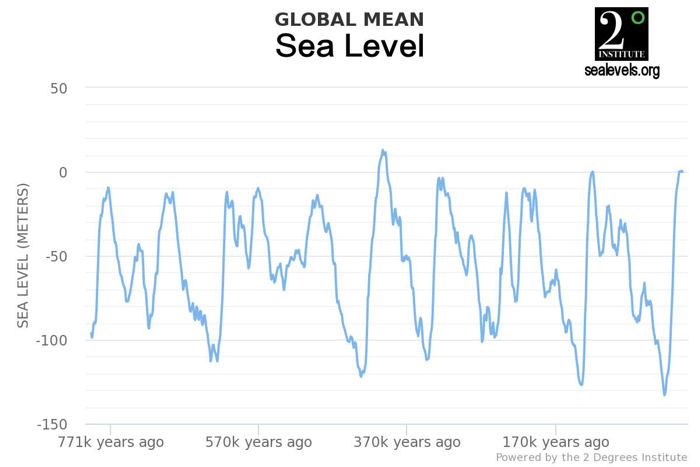
"Global temperatures in the other 8 previous Inter-Glacial Periods were at least 7°F warmer than present." Again not supported by the evidence. A google search provides many graphical representations of 800,000y temperatures and globally the present interglacial has been warmer than all but three of them (although AGW may be on course to change that ranking).
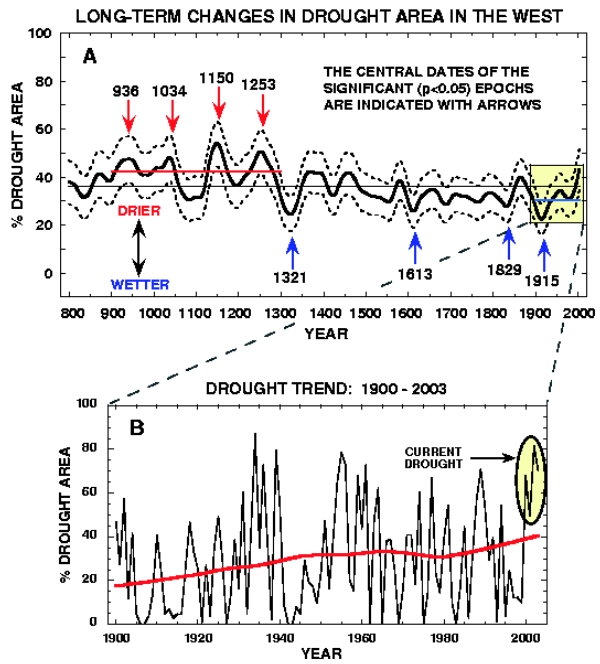
"The West always undergoes a drought during Inter-Glacial Periods." This is a more specialist assertion. That there has been "a drought" in "the West" through the Holocene is potentially correct. It isn't a place with massive rainfall. But more accurately there are periods of drought and periods when the rain is heavier. What we see to make sense of that is a bit of a Hockey Stick situation with drought conditions becoming more wide-spread. The graphic comes from here an account which does address the question "Will anthropogenic climate change cause the West to get drier or wetter?"
- Climate's changed before
TVC15 at 07:46 AM on 13 July, 2021My favoirite hubris spewing climate denier is at it again.
He was smarting of to a person in Colorado who was discussing the current drought in the Westen half of the US.
[What a coincidence.
The same thing happened in the previous Inter-Glacial Period, and the one before that and the one before that and the other 5 before before that.
Are you foolishly blind enough not to see the pattern?
The West always undergoes a drought during Inter-Glacial Periods.
Tell us why this Inter-Glacial Period should be different.
Ice sheets and glaciers always melt during Inter-Glacial Periods.
Tell us why this Inter-Glacial Period should be different.
Sea levels are normally 4 meters to 14 meters higher than they are now during Inter-Glacial Periods.
Tell us why this Inter-Glacial Period should be different.
Tell us why the sea level should not rise at least another 4 meters like it did in the other 8 previous Inter-Glacial Periods.
Global temperatures in the other 8 previous Inter-Glacial Periods were at least 7°F warmer than present.
Tell us why this Inter-Glacial Period should be different.
Tell us why this Inter-Glacial Period should be a statistical anomaly and be colder with lower sea levels and no melting and no drought.
Can you do that?]
This denier is so hostile and over the top smug and arrogant in his replies it's hard to take them seriously.
Is it accurate that the west always undergoes drough during interglacials?
Also I don't think it's correct that Sea levels are normally 4 meters to 14 meters higher than they are now during Inter-Glacial Periods.
How can this denier make this claim? Global temperatures in the other 8 previous Inter-Glacial Periods were at least 7°F warmer than present.
- Tell us why this Inter-Glacial Period should be different.
- Tell us why this Inter-Glacial Period should be a statistical anomaly and be colder with lower sea levels and no melting and no drought.
My response to the above bullets would be that this interglacial is nearning it's end and we should be seeing a global cooling effect, but we are seeing a warming effect due to human activity. Not sure what more I could add to my response to the bulleted statements made by this denier.
- Skeptical Science New Research for Week #25, 2021
Daniel Bailey at 06:51 AM on 26 June, 2021Reading the research paper and the Nature commentary on it, they are pretty much in-line with the recent 2019 SROCC (Chapter 4 is most relevant). Table 4.4 gives these numbers:

Don't take my word on it, though. There's a number of discussions out there already (like here and here) saying pretty much the same thing.
For me, the main thing is that they look at the recent research, both the early research by DeConto and the later stuff, which shows that some of the early concerns about marine ice cliff instability were not as bad as originally feared.
“What we found is that over long timescales, ice behaves like a viscous fluid, sort of like a pancake spreading out in a frying pan. So the ice spreads out and thins faster than it can fail and this can stabilize collapse. But if the ice can’t thin fast enough, that’s when you have the possibility of rapid glacier collapse.
There’s no doubt that sea levels are rising, and that it’s going to continue in the coming decades. But I think this study offers hope that we’re not approaching a complete collapse – that there are measures that can mitigate and stabilize things. And we still can change things by making decisions about things like energy emissions, methane and CO2.”
Does this mean that the land-based ice sheets of Antarctica and Greenland may not hold some SLR surprises in store for us? Of course they might. But without a magic crystal ball or a time machine to know with certainty what emissions pathways society will follow in the future, we have to go with what they physics of ice sheets informs us. This research does not rule out worse results this century than the SROCC delineates.
As scientists Joelle Gergis and Richard Alley told a group of us at a recent AGU meeting, the current models (CMIP3 and CMIP5) treat the land-based ice sheets of Greenland and Antarctica as "like rocks, but painted white". Meaning that they were not coupled or interactive with their surroundings in any climate-related way. The CMIP6 models, however, look to more fully couple those ice sheets with their surrounding ocean regimes.
Society will have an enormous difficulty in dealing with the first meter of SLR, due at some point this century. If it gets a second meter this century (perhaps not globally, but possibly in some regions), that will be catastrophic.

- Skeptical Science New Research for Week #25, 2021
Daniel Bailey at 07:56 AM on 24 June, 2021@citizenschallenge, I've downloaded those and will read them in more depth tomorrow. Surficially, they appear pretty straightforward and anyone using them to deny the understood science of AGW, land-based ice sheet losses and SLR is being disingenuous and misrepresenting those 2 papers. They appear to be good news, in that future losses from the ice sheets will more closely follow existing modeled pathways and not something far more extreme.
- The New Climate War by Michael E. Mann - our reviews
Bob Loblaw at 05:42 AM on 13 June, 2021Oh, Nick. You're repeating yourself, and it does not stand you in good stead.
"The short answer is that Big Oil continued to support the "B.S. factories" because they were effective at trying to protect those corporations against unwarranted attack."
I really hope that you do not consider sound science (even with uncertainties) to be "an unwarranted attack".
If you are referring to non-scientific organizations such as Greenpeace, then I hope that you are not saying that unwarranted attacks justify B.S., simply because it is "effective".
"...most seem to have been happy to accept Greenpeace et al's interpretation of events as gospel..."
A strawman position...
"I refer you again (3rd time) to my quote of Carbonbrief's article and the words of top climate scientist Andrew Dessler of Texas A&M Uni."
Repeating the quote is certainly not necessary. Using phrases such as "top climate scientist" represent an argument from authority. I was already teaching undergraduate and graduate climatology courses when Andrew Dessler was still a grad student. I had and have direct knowledge of the primary peer-reviewed scientific literature from that time.
I hope that you do not think that the 1.5C to 4.5 C sensitivity range is a complete summary of climate science.
I hope that you do not think that there was a huge amount of uncertainty regarding the lower limit back in the 1980s. There was lots of uncertainty of regional effects. Lots of uncertainty about cloud feedback effects (but unlikely to be strongly negative).
From the 1990 IPCC sumamry for policy makers:
There are many uncertainties in our predictions particularly with regard to the timing, magnitude and regional patterns of climate change, due to our incomplete understanding of:
• sources and sinks of greenhouse gases, which affect predictions of future concentrations
• clouds, which strongly influence the magnitude of climate change
• oceans, which influence the timing and patterns of climate change
• polar ice sheets which affect predictions of sea level rise
These processes are already partially understood, and we
are confident that the uncertainties can be reduced by
further research However, the complexity of the system
means that we cannot rule out surprises
THe 1990 IPCC report includes quite a bit of discussion about these uncertainties, and what needs to be done to sort them out.
One of the very few sources of a realistic argument for low sensitivity was Lindzen's "Iris effect". As Lindzhen had a good reputation as a meteorologist, this hypothesis was taken seriously. It did not pan out.
Most of the rest of the "sensitivity is low" arguments were B.S. Many were clearly B.S. in the 1980s - and are still B.S. now, even though they keep getting repeated..
Dessler may feel that the uncertainty was underestimated. Do you have any evidence of an actual number that he would put on it?
Did Exxon choose to push the known uncertainties and realistic scientifically-supportable possibitiies? No. As you admit, they chose the Baffle Them With B.S. option.
You seem to feel that was justified on their part. I do not.
"...the views of sensitivity at the time were just not solid enough to mandate massive corporation change..."
...but they were solid enough to start to invest considerable money (albeit probably peanuts for Big Oil) in the B.S. factories, in an attempt to preserve and maximize corporate profits for as long as possible.
If Big OIl's approach was so honorable, then why did they try to hide the path of the money and keep their name off it?
If you were to argue that Big Oil's corporate responsibility is to maximize shareholder value regardless of ethics, then I would concede the point.
- Increasing CO2 has little to no effect
Eclectic at 05:43 AM on 3 April, 2021Rkcannon, permit me to add a comment, as a non-expert in these matters. Measuring the alterations in outgoing IR radiation from Earth, is a matter of measuring a very small quantity against the background of a very large quantity. Rather like measuring your bodyweight on ordinary bathroom scales ~ with and without wearing your wristwatch. It is hard to get an accurate assessment of the weight of your wristwatch, even though you repeat the measurements daily over many years!
(Nevertheless, basic physics and common sense do combine to tell you that the wristwatch has a real positive weight, not a negative or zero weight.)
Taking a step back and looking at the climate situation :- over many decades, the observed surface temperature is rising, and the observed Ocean Heat Content is rising, and the observed planetary ice-sheets are melting, and the observed sea-evel is rising. And these changes are in accord with our understanding of radiational basic physics, too.
So only a fool (or scoundrel) would assert that Global Warming is not occurring. (Despite the difficulties inherent in a situation of continual variations and distributions of planet-wide cloud types.)
Speaking of which :- the NoTricksZone website has an appalling track record of presenting distorted and/or misleading information. It is clear that "NTZ" has a strong agenda of presenting disinformation via misquotes and misinterpeting of scientific papers. Yes, I am making an ad hominem comment ~ and it is a very well deserved ad hom in the case of NTZ and its chief editor. Whenever you see something "scientific" reported on NTZ website, your own proper skepticism should immediately go to Triple Red Alert overdrive status.
There are several versions of reporting circulating about an initial study (Kramer et al., 2021). NTZ's effort mentions a Zoe Phin, who is IIRC one of these "GreenHouse Effect does not exist" people ~ so again, your skepticism should result in a close examination of what's being put forward. (Unless you wish to dismiss it all as a huge waste of time for you to investigate. Just as you do when faced with a complicated "proof" of Flat Earth . . . or a new Perpetual Motion Machine . . . or a complicated screed of mathematics supplied by AGW-deniers like Christopher Monckton.)
- Skeptical Science New Research for Week #9, 2021
Rob Honeycutt at 06:33 AM on 15 March, 2021SunBurst... It's clearly stated in the movie what's being demonstrated is what would happen if all the ice on the Greenland and Antarctic ice sheets melted. An ice-free planet, which we had the last time CO2 levels were as high as today, would have sea levels that are 70 meters higher than today. These are facts.
- Skeptical Science New Research for Week #7, 2021
Daniel Bailey at 03:39 AM on 20 February, 2021Basically, jamesh's point he wishes to contest (the existence of land-based ice sheets that have since disappeared, like the Laurentide Ice Sheet) is a variant of the skeptic argument, "The Climate Has Changed Before" (so therefore this iteration of climate change is normal).
He needs to take his argument to that link, where I'm sure it will be prompted and thoroughly refuted.
After all, that the climate changed naturally before the impacts of humans became the dominant forcing of climate is uncontentious.
That the impacts of human activities are now the dominant forcing of climate is equally uncontentious, from a scientific basis.

- Skeptical Science New Research for Week #7, 2021
jamesh at 01:08 AM on 20 February, 2021Rob @ Bob Thank you for your comments re ice sheets..Actually the ice sheet that I wanted to talk about is the one that covered New York State, which at max was about 9000ft thick. I joined the Hudson-Mohawk Society of Professional Geologists in 2017 and learned a lot about ice sheets. I think they are all alike, but if you all are interested, I will share what I have learned.
- Skeptical Science New Research for Week #7, 2021
jamesh at 11:02 AM on 19 February, 2021I did read the the complete posting on geoengineering and did not perceve that strataspheric aerosol injection had anything to do with engineering. Engineering always deals with known scientific principals. In any case I wish to move on to the issue of the melting of polar ice sheets. How do I access postings on that subject?
- Climate's changed before
Daniel Bailey at 07:47 AM on 29 October, 2020
"Then the question is how long will it take for all that ice to melt"
Sea level rise from ice sheets continue to track worst-case (High scenario) climate change scenarios (discussion here, source paper here).

Which, charitably, means 2.0 meters SLR by 2100, given that the Greenland Ice Sheet has tipped into a negative mass balance state, Earth having lost 28 trillion tons of ice in the past 23 years and that Greenland is expected to exceed Holocene loss rates by 2100.

Typically, when climate scientists try to understand some of the expected future effects of global warming and climate change, they first look to the past. And in looking to the past, we can use the example of the climate transition from the icy depths of the Last Glacial Maximum into our current Holocene Interglacial to guide us. From about 21,000 years Before Present (BP) to about 11,700 years BP, the Earth warmed about 4 degrees C and the oceans rose (with a slight lag after the onset of the warming) about 85 meters.
However, the sea level response continued to rise another 45 meters, to a total of 130 meters (from its initial level before warming began), reaching its modern level about 3,000 BP.
This means that, even after temperatures reached their maximum and leveled off, the ice sheets continued to melt for another 8,000 years until they reached an equilibrium with temperatures.
Stated another way, the ice sheet response to warming continued for 8,000 years after warming had already leveled off, with the meltwater contribution to global sea levels totaling 45 additional meters of SLR.
Which brings us to our modern era of today: over the past 100 years, global temperatures have risen about 1 degree C…with sea level response to that warming totaling about 150 mm. Recently, accelerations in SLR and in ice sheet mass losses have been detected, which is what you’d expect to happen when the globe warms, based on our understanding of the previous history of the Earth and our understanding of the physics of climate.
Support for above:
https://www.nasa.gov/feature/goddard/2019/study-predicts-more-long-term-sea-level-rise-from-greenland-ice/
https://advances.sciencemag.org/content/5/6/eaav9396
https://climate.nasa.gov/news/2458/why-a-half-degree-temperature-rise-is-a-big-deal/
https://www.nature.com/articles/nclimate2923
https://www.nature.com/articles/ncomms9059
http://www.pnas.org/content/111/43/15296.short
https://www.carbonbrief.org/sea-level-research-says-only-a-brief-window-to-cut-emissions
https://climate.nasa.gov/news/2869/antarcticas-effect-on-sea-level-rise-in-coming-centuries/
https://www.pnas.org/content/110/4/1209
https://science.sciencemag.org/content/364/6444/eaav7908
https://advances.sciencemag.org/content/5/1/eaau3433
https://www.pnas.org/content/116/30/14887 - Climate's changed before
Daniel Bailey at 00:29 AM on 29 October, 2020Since we are discussing sea level rise, recent sea level rise is unprecedented over the past 2,500 years (Kopp et al 2016):

Anthropogenic forcing dominates global mean sea-level rise since 1970 (Slangen et al 2016):
"the anthropogenic forcing (primarily a balance between a positive sea-level contribution from GHGs and a partially offsetting component from anthropogenic aerosols) explains only 15 ± 55% of the observations before 1950, but increases to become the dominant contribution to sea-level rise after 1970 (69 ± 31%), reaching 72 ± 39% in 2000 (37 ± 38% over the period 1900–2005)"
Causes of sea level rise since 1900, from NASA and Frederikse et al 2020:

Takeaways:
1. Glacier-dominated cryospheric mass loss has caused twice as much sea-level rise as thermal expansion since 1900
2. The acceleration since the 1970s is caused by the combination of thermal expansion and increased Greenland mass loss
3. Ocean mass increases from land-based ice losses dominated the early 20th and 21st Century sea level rise record; ocean heating was the dominant component from 1970-2000
4. The closure of the 20th-century sea-level budget derived here implies that no additional unknown processes, such as large-scale deep ocean thermal expansion or additional mass loss from the Antarctic Ice Sheet are required to explain the observed changes of global sea level
Additionally, new research (Miller et al 2020) affirms modern sea level rise is linked to human activities, and not to changes in Earth’s orbit:
"Surprisingly, the Earth had nearly ice-free conditions with carbon dioxide levels not much higher than today and had glacial periods in times previously believed to be ice-free over the last 66 million years, according to a paper published in the journal Science Advances.
“Our team showed that the Earth’s history of glaciation was more complex than previously thought,” said lead author Kenneth G. Miller, a Distinguished Professor in the Department of Earth and Planetary Sciences in the School of Arts and Sciences at Rutgers University-New Brunswick. “Although carbon dioxide levels had an important influence on ice-free periods, minor variations in the Earth’s orbit were the dominant factor in terms of ice volume and sea-level changes — until modern times.”
Sea-level rise, which has accelerated in recent decades, threatens to permanently inundate densely populated coastal cities and communities, other low-lying lands and costly infrastructure by 2100. It also poses a grave threat to many ecosystems and economies.
The paper reconstructed the history of sea levels and glaciation since the age of the dinosaurs ended. Scientists compared estimates of the global average sea level, based on deep-sea geochemistry data, with continental margin records. Continental margins, which include the relatively shallow ocean waters over a continental shelf, can extend hundreds of miles from the coast.
The study showed that periods of nearly ice-free conditions, such as 17 million to 13 million years ago, occurred when the concentration of atmospheric carbon dioxide — a key greenhouse gas driving climate change — was not much higher than today. However, glacial periods occurred when the Earth was previously thought to be ice-free, such as from 48 million to 34 million years ago.
“We demonstrate that although atmospheric carbon dioxide had an important influence on ice-free periods on Earth, ice volume and sea-level changes prior to human influences were linked primarily to minor variations in the Earth’s orbit and distance from the sun,” Miller said.
The largest sea-level decline took place during the last glacial period about 20,000 years ago, when the water level dropped by about 400 feet. That was followed by a foot per decade rise in sea level — a rapid pace that slowed from 10,000 to 2,000 years ago. Sea-level rise was then at a standstill until around 1900, when rates began rising as human activities began influencing the climate.
Future work reconstructing the history of sea-level changes before 48 million years ago is needed to determine the times when the Earth was entirely ice-free, the role of atmospheric carbon dioxide in glaciation and the cause of the natural fall in atmospheric carbon dioxide before humans."
From the source paper, Miller et al 2020:
"High long-term CO2 caused warm climates and high sea levels, with sea-level variability dominated by periodic Milankovitch cycles.
Sea level rose in the Early Pliocene ca. 4.7 Ma, reaching highs that had not been consistently seen since the MCO. From a sea-level perspective, the Pliocene is marked by three intervals with sea level well (~10 to 20 m) above modern: 4.6 to 4.1, 3.9 to 3.3, and 3.3 to 2.85 Ma.
GMSL higher than 12 m above modern requires loss of ice sheets in Greenland, West Antarctica, and sensitive areas of East Antarctica, the Wilkes, and Aurora Basins. This interval is of keen interest, because global temperatures were >2°C warmer than today at times when atmospheric CO2 concentrations were on the order of those in 2020 CE (~400 ppm), and thus, the equilibrium sea-level state is relevant to ice sheet trajectories in coming centuries. The peaks between 3.9 and 3.3 Ma were even higher, reaching a peak of ~30 m during Gi13, and thus requiring some melting of the EAIS.
The development of a permanent EAIS by 12.8 Ma resulted in a change from responding to precession, tilt, and eccentricity to subdued to absent response to eccentricity and precessional forcing that had previously been strong; the 41-ka tilt cycle dominated ice sheet and sea-level response from ca. 12.8 to 1.0 Ma following the development of a permanent EAIS. During the mid-Pleistocene transition, very large, 100-ka paced LIS were amplified by 100-ka changes in CO2 from ~180 (glacial) to 280 ppm (terminations).
During the last deglaciation (ca. 19 to 10 ka), GMSL rise exceeded 40 to 45 mm/year, providing an upper limit on known rates of GMSL rise. Rates before radiocarbon ages are less certain, although the sea-level rises exceeded 10 mm/year during terminations. Sea-level rise progressively slowed during the Holocene until the late 19th to early 20th century when rates began to rise from near 0 to 1.2 mm/year in the early 20th century to a late 20th and 21st century rise of 3.1 ± 0.4 mm/year.
Sea level follows long-term trends of atmospheric CO2, with high sea levels associated with high CO2 and warm climates. CO2 played an important role with high CO2 maintaining warmth in the Eocene (with values >800 to 1000 ppm; associated with largely ice-free conditions and high sea levels. Generally, decreasing CO2 values during Middle Eocene to Oligocene led to cooling and glaciation, although a secondary CO2 increase at ca. 35 to 36 Ma may be associated with the late Late Eocene warming. The cause of the CO2 decrease over the past 50 Ma has been widely discussed and debated but must be due to long-term (107-year) changes in CO2 sources (e.g., higher CO2 associated with inferred higher ocean crust production rates) or more likely the effectiveness of sinks CO2 (e.g., increased weathering associated with uplift of the Himalayas or exposure of basalts in tropical regions).
Our records that suggest nearly ice-free conditions occurred during the MCO and are thus intriguing if this is an equilibrium state for warming levels that will be attained in this century or the next century under sustained greenhouse gas emissions.
Our sea-level history constrains cryospheric evolution over the past 66 Ma, with ice-free conditions during most of the Early Eocene, MECO, latest Eocene, and possibly the MCO, with ice sheets (up to 40-m sea-level equivalent) in the Middle to Late Eocene greenhouse and with continental-scale Antarctic ice sheets beginning in the Oligocene.
From 34 to 13.8 Ma, the EAIS varied from larger than today (sea-level ~35 m below present) to nearly ice-free (~50 m above present) but became permanent during the MMCT ca. 12.8 Ma."
Miller 2020, Figure 4, rotated once:

And the past 40,000 years, from Miller 2020, Figure 4 above:

- Climate's changed before
Hal Kantrud at 12:05 PM on 27 October, 2020Eclectic thanks for pointing that out. I just noted what looked like quite a marked temperature drop during the last 6000 years pre-spike was accompanied by at least a fairly steady rise in ocean levels. So the sea level data is questionable.
Since the Antarctic ice has stayed relatively stable, it looks like the temperature drop and recent rise has has so far involved only the smaller (less than continent-size) ice sheets. This would be expected if the smaller sheets were thinner, partly above the sea, and assisted by human agriculture, deforestation, and industrialization, as these occurred almost exclucively in the N. Hemisphere because of greenhouse gas emissions. Is an estimate of the proportion of these gasses attributed to the three human activities available? I know even a rough estimate would be extremely complicated because plants use CO2 and N, as well as sequester them, plus we might know little about the extent of hydrocarbon extraction during the last 200 years, forest utilization, etc., but I bet it could be done.
I have read that the entire subarctic zone continues to lift upwards after the glacial ice maximum and subsequent melt. Are there studies showing the contrubution of each to ocean depths?
- Climate's changed before
MA Rodger at 19:50 PM on 25 October, 2020Hal Kantrud @845,
There is certainly a timelag between temperature rise and ice loss and with big ice sheets the lag can also be big (but not necessarily). The current level of AGW is put at 1ºC and the sea level rise so far at 20 or 30 cms. Yet the anticipated sea level rise per 1ºC AGW is put at 230cm over a period of a couple of millenia. But additional to that 230cm/1ºC is Greenland which maintains its ice sheet solely becuse its summit is high up surrounded by cold atmosphere. It is anticipated that somewhere between 1ºC and 2ºC of AGW, the summit of Greenland's ice will drop into an unstoppable melt-out as the summit decends into warmer atmospheres, this adding a further 600cm to sea level over perhaps ten millenia. I say "unstoppable" in that it would require a return to ice age conditions to stop the melt and build the summit back up into colder airs.
Regarding the chopping down of woodland, this is globally not New World.
- Climate's changed before
MA Rodger at 22:21 PM on 24 October, 2020Hal Kantrud @842,
To address your three requested points of clarification/confirmation.
(1) The only actual continent-sized ice sheet is Antarctica and that remains unaltered in size through an interglacial and through a glacial maimum. The glacial maximum see the growth of ice sheets across the northern half of N America, Greenland and N Europe. The Greenland ice sheet has survived the present interglacial but was melted out in the previous one.
The impact of small wobbles in global temperature is not significant within this process as the temperature change is small and it doesn't last very long. The ice melt is a slow process. Thus, while global temperatures stopped rising 10,000 years ago, the melt continued strongly for a further 2,500 years and less strongly for another 4,000 years, this shown by the sea level record.

(2) Your timings are a little off. After the Holocene peak temperture (best considered as a plateau 10,000y to 6,000y bp), global temperature has been dropping but only to the equivalent of 11,000y bp. 13,000y bp would have you back in the Younger Dryas event when it was very cold.
(3) The CO2 record from ice cores does show previous interglacials with CO2 (& CH4) levels falling quickly from the peak of the interglacial. This is not the case for the present interglacial when CO2 (& CH4) levels are shown to rise not fall. This has led to some interesting work setting out the idea that the activities of mankind are responsible for this early rise, for CO2 perhaps dating back to 8,000y bp (& 5,000y bp for CH4).
While this work remains speculative, the CO2 (& CH4) levels through this interglacial would act to slow the drop back into a glacial maximum.
The unprecedented CO2 levels likely now top the CO2 levels seen 3 million years ago (this was back when N America was joined S America at Panama and initiated the Arctic ice) and are thus uprecedented in 13 million years, thus back to a time when weathering of the newly-formed Himalayas caused reducing CO2 levels.
....
And addressing your main question which concerns the CO2 levels of the last few centuries rather than those of the late stone age because any increase pre-industrial cannot be the result of fossil fuel use.
According to the Global Carbon Project, the anthropogenic CO2 emissions since pre-industrial amount to some 650Gt(C) of which 450Gt(C) results from fossil fuel use and 200 Gt(C) due to Land Use Change, but note this is mainly cutting trees down not "the conversion of New World grasslands".
- Climate's changed before
Hal Kantrud at 13:23 PM on 24 October, 2020Thanks. So we are in a period of the current Ice Age where continent-size ice sheets cover land at the poles. While waiting for the next Ice Age, we experience cooling periods, (phases) but these are too small to significantly increase the size of the continental ice sheets. Does this imply that the warming periods or phases will not significantly reduce the size of the ice sheets?
Am I correct in reading the graphs that during the Holocene, Earth reached peak temperatures about 8000 YBP and has since cooled down to temperatures reached about 13,000 YBP, but during the last 200 years has spiked to levels far above those observed during the Holocene peak?
Can I also say that atmospheric CO2 levels followed an opposite pattern, slowly increasing during the last 8000 years, only to spike upwards during the last 200 years to unprecedented highs?
My main question concerns the latter. What portion of the recent spike in CO2 can be attricuted to the conversion of New World grasslands to agriculture and pasturage and what portion can be attriubted to the increased use of hydrocarbons worldwide?
- Climate's changed before
Daniel Bailey at 09:20 AM on 22 October, 2020Hal Kantrud, by definition an ice age is any period with continental-scale ice sheets on land (like now). Within an ice age are warmer periods called interglacials and colder periods, called glacial periods (or glacial phases). The Little Ice Age nor any cool episode in the past 13,000 years do not rise to the standard of a glacial phase.

(bigger image here)
As can be seen below, glacial and interglacial periods are self-evident:

(bigger image here)
When it comes to the modern warming forcing from human activities, it's already comparable to the warming which lifted the world out of the last glacial maximum 24,000 years ago to the height of the Holocene Climate Optimum 8,000 years ago:
"About 2.3W/m2 (from CO2), a few tenths more from CH4 and N2O.
Anthropogenic GHG forcing is ~2 W/m2 (CO2) and ~0.5 W/m2 from CH4+N2O+CFCs.
So they are comparable - ice sheets were a bigger term in the deglaciation tho."
(source)
Humans are inducing a phase transition from an interglacial world to a no-glacial world. So we are ending the ice age itself.
- Is Nuclear Energy the Answer?
Preston Urka at 14:02 PM on 4 September, 2020@217 - here are examples of plant costs vs system costs
Feb 2016 - re-dispatch-costs-german-power-grid
Some researchers argue that new north-south connections would never have enough capacity to absorb the growing wind power generation in the north and the decreasing conventional capacity in the south – where many nuclear power plants will go offline in the next seven years.
Question: Why are these costs not allocated to the cost of Wind? Nuclear, as above, does not need these transmission lines. Wind (as a plant) costs less. Wind (as a system) costs more.
Feb 2019 - German grid firms see extra costs to meet renewable power target
Total spending of 70 billion to 79 billion euros over 12 years would be shouldered by consumers via higher grid fees, which account for about a quarter of their electricity bills.
Between a quarter and half of power demand in southern Germany will have to be met by renewable generation in the north, where plants now generate double the north’s needs.
Observation: If Germany were using nuclear in the south, the transmission would not be built (saving the 70-79 billion Euro); and excess wind would not need to be built in the north (i.e. a higher return on assets).
July 2019 - just 35 wind turbines were build with an output of 231 megawatts in 6 months
Hardly any new wind turbines were built in Germany in the first half of the year. Turbine makers call it a “punch in the gut of the green energy transition” and blame environmentalists.
Just 35 wind turbines were build with an output of 231 megawatts. ... "a decline of 82 percent"
But when in 2021 thousands of wind turbines come to the end of the 20-year subsidy period of the Renewable Energy Act, more wind turbines will be demolished on balance than new ones will be added, the wind industry fears.
Observation: Environmentalists don't like wind now and the wind industry needs enormous subsidies or they will take their marbles home (my sparring partners on SkS firmly disapprove of subsidies).
michael sweet/MA Rodger, did not one of you mention how fast, fast, fast the wind industry is and how it is only growing? - I take the decline of 82% wind, not as the fault of wind, and not due to the success of nuclear, but as proof of the value of the incentives governments set up. If the market favors wind, wind will be built. If the market favors nuclear, nuclear will be built. The difference is, at the system level, nuclear has been empirically been shown to reduce carbon emissions. Wind has only been shown to do so at the plant level, and Jacobson and his fellow travellers extrapolate that to the system level.
August 2019 - Grid expansion in is gaining, but not enough for intermittent RE
... the integration of renewable energy is improving. [However, _coal_ (note Preston addition)] power stations in southern Germany, which remain unused during the summer months, are recommissioned in the winter.
The commissioning of the Thüringer Strombrücke ... has helped significantly relieve the pressure ... 190-kilometer-long .... 5 gigawatts (GW) ........ However, this has not done much to reduce the overall costs of the grid interventions.
[TSO] estimate that by 2030, the price tag on grid expansion will clock in at 62.5 billion euros.
But when the last nuclear power plants are taken off the grid in late 2022, the north-south divide in generation capacity and electricity consumption will become even more pronounced than before. The Federal Network Agency estimates that demand for reserve capacity will then reach a record high of 10,647 MW.
... authorities have ... prohibited ... decommissioning of 27 power stations. The operators [want to retire] 110 plants ,,, capacity of 22,000 MW ... because ... operation is no longer financially viable.
Question:
- Why are these costs not allocated to the cost of Wind? Wind drives it (or lack of wind) and
- Do you begin to see the scale of support for Wind?
- 110 assets are useless, but authorities want at least 27 dud assets kept - it is not because Wind is so great!
- Do you see that the operators can't support costs when politicians confuse marginal and average costs?
- Even a 5 GW transmission line (yes, that is a truly big one!) does not reduce costs much.
- Do you see the Germans could avoid a) the cost, and b) the coal if they just kept the nuclear plants open?
- It's only a few degrees
michael sweet at 07:44 AM on 11 July, 2020Jasper,
I am surprised that students in the Netherlands are not concerned about sea level rise. In the last ice age the temperatures were about 5C less than the current temeperatures. The sea level was 125 meters lower than it is today! From "only" 5C temeprature change!!! The current IPCC estimate for 2100 is a little over 1 meter sea level rise. Dutch engineers think they can manage 1 meter sea level rise. The high estimates of sea level rise by 2100 are well over 2 meters. That would overwhelm the Dutch dykes! What do farm boys think of that?
Have the students check the estimates for sea level rise from all 5 IPCC reports. Every report the sea level estimate is increased! Currently the temperature response of the great ice sheets on Greenland and the Antarctic is not well understood. Some sea level experts think that 6 meters of rise by 2100 is possible if the ice sheets respond rapidly. (To my students I emphasize the high end of the IPCC. The IPCC estimates are low compared to other scientific estimates). If you post again I can look for other estimates for you.
I had my students (the same age as yours) write me a report on the Arctic sea ice minimum in September. The NSIDC web site is easy to read (unfortunately in English). The summary of the yearly low in sea ice will be posted about October 7. The retreat of sea ice does not raise sea level. On the other hand, it is right next to Greenland which does raise sea level. My students were invariably shocked at the rate of sea ice loss.
I had my students write another report on global temperature using the NOAA web site. This is also easily read in English. The summary of yearly temperature will be posted about January 15 2021 for the year 2020. There is probably a web site in Dutch (any readers know of a Dutch site?) but I like the NOAA web site a lot.
Post again if we can help you.
- 2020 SkS Weekly Climate Change & Global Warming News Roundup #22
nigelj at 12:26 PM on 2 June, 2020Slarty Bartfast @6
The article never said these floating ice shelves melt and thus cause sea level rise. It said (paraphrasing) the floating ice shelves melt, and as a result the land based glacier ice sheets retreat more quickly thus accelerating sea level rise. Please read the article again.
The ice shelves are not frozen sea water. They are not sea ice. They are just extensions of the land based glacier, so they are frozen fresh water, refer here.
Agree to the extent that most of the melting floating ice shelves wont cause sea level rise because they have already displaced the sea water. Only the part above the ocean surface would contribute to sea level rise.
- 2020 SkS Weekly Climate Change & Global Warming News Roundup #22
CD at 11:01 AM on 2 June, 2020Re: [3] SirCharles
Thank you for your comment. Yes, I read the article.
Re. [5] nigelj - It doesn't matter where the sea ice comes from. The point is it is floating and so it has already elevated the sea level by displacing sea water. If it melts nothing changes. The volume of sea water it displaces when it is ice is the same volume that will be replaced with water when it melts. That is Archimedes' principle. That was my point.
As for your claim that the ice shelves are just extensions of the ice sheets on land; if that were true (a) they wouldn't be flat, and (b) they wouldn't regrow once melted as they frequently do on a seasonal basis. See here https://earthdata.nasa.gov/learn/sensing-our-planet/unexpected-ice
- 2020 SkS Weekly Climate Change & Global Warming News Roundup #22
nigelj at 06:26 AM on 1 June, 2020Slarty Bartfast, another way of looking at it is the floating ice shelves add to sea level rise, because they are frozen fresh water originating from the land based ice sheets. Its not the same as salt water freezing which doesn't change sea level rise.
- 2020 SkS Weekly Climate Change & Global Warming News Roundup #22
SirCharles at 03:22 AM on 1 June, 2020Why don't you go and read the article, Slarty?
"Ice shelves float on the ocean but they are fastened to land and act as stoppers that prevent Antarctic ice sheets that are as big as the U.S. and Mexico combined from sliding into the sea. The shelves are frozen to outcrops on the seafloor, but when they melt away from those anchor points, the flow of ice into the ocean speeds up, accelerating sea level rise."
- 2020 SkS Weekly Climate Change & Global Warming News Roundup #22
CD at 08:50 AM on 31 May, 2020How can melting ice sheets raise sea levels?
- Coronavirus conspiracy theories are dangerous – here’s how to stop them spreading
Jim Hunt at 01:45 AM on 29 April, 2020My own interest at present concerns the rather more subtle activities of the various flavours of mainstream media here in the once Great Britain.
Here's a pot pourri of the messages the Independent, Times and Telegraph are endeavouring to impart in the wake of Boris Johnson's return to Downing Street yesterday:
http://CoV-eHealth.org/2020/04/27/boris-johnson-returns-to-work/
Which version of this Covid-19 “story” do you prefer to believe?
How might one go about inoculating the readers of the once Great British broadsheets against the prejudices of their own particular "echo chamber"? - Ice isn't melting
Daniel Bailey at 06:24 AM on 28 April, 2020Per Velicogna et al 2020 - Continuity of ice sheet mass loss in Greenland and Antarctica from the GRACE and GRACE Follow‐On missions:
Both the Greenland and the Antarctic Ice Sheets continue to lose ice mass from April 2002 through September 2019.
Greenland Ice Sheet average mass loss:
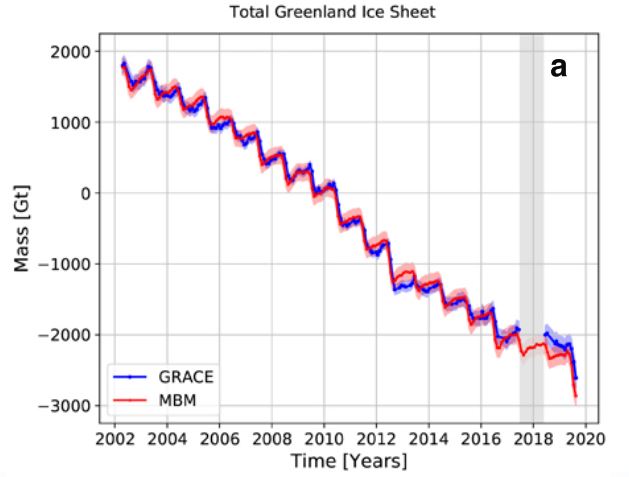
Antarctic Ice Sheet average mass loss:

https://agupubs.onlinelibrary.wiley.com/doi/abs/10.1029/2020GL087291
- We're heading into an ice age
MA Rodger at 23:47 PM on 26 April, 2020Lawrence Tenkman @407,
To clear up the "parting comment", it appears in a 2015 blog-post linked at the last paragraph of #405 above. The denialist flavour of this "parting comment" does explain some of the very odd comment in Ellis & Palmer (2016).
The 'CO2 mechanism' I say is not explained is specific to the glacial maxima. Ellis & Palmer (2016) demonstrate temperature, dust and CO2 are correlated (in their figs 1, 4, 8 & 9). We could also include sea level/ice volume and methane into such correlations. So the question arises - What is driving what?
During the drop into an ice age we can be reasonably confident that reduced northern insolation allows a build-up of northern ice sheets reducing regional albedo which has a global impact on temperature and kicks-off positive feedbacks in albedo, CO2 & methane.
But the glacial maxima appear to have a particular pattern to them, perhaps clearest when sea level is considered. The Ice Ages step up a gear as they dive into the maxima.
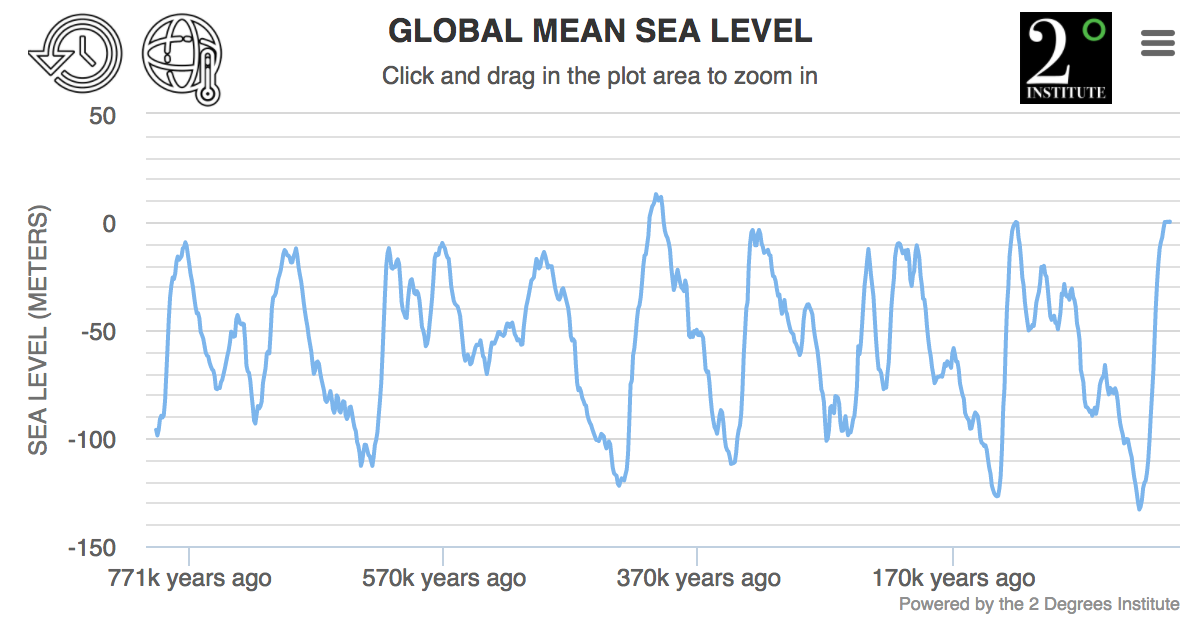
Ellis & Palmer point the finger at the CO2 feedbacks. They would have difficulty using albedo as the dust-levels are building at these points in the Ice Age cycle and Ellis & Palmer dismiss the idea of atmospheric dust-levels being a significant cooling factor.
Given the constraints placed on the workings of Ice Age maxima by Ellis & Palmer, their hypothesis seems to rely on some strong CO2 feedback that comes into play at this point in the Ice Age cycle. So my question - Are the measurements of CO2 showing a big enough reduction? What is causing these large reductions in CO2? And what causes these reductions to quickly reverse when the maxima is over?
And not greatly removed from any discussion of 'CO2 mechanism'....
Regarding the lack of 'threshold' for dust levels to bring Ice Ages out of their maxima, Ellis & Palmer Fig 4 (below) shows great variation in the peak level of dust as well as variation in the duration of high-dust prior to the glacial maxima. This I term a lack of 'threshold'. The general impression is that a generally high level of dust reducing albedo of global ice sheets awaits the increase in nothern insolation caused by the Milankovitch cycle.
But surely this variability means the power of the dust-reduced albedo forcing is not strong enough of itself to be the trigger. It is possible that analysis would show the Milankovitch cycle and the dust-albedo in combination provides a consistent threshold level, or perhaps CO2 levels are also a factor in the mix. But such necessary analysis would require an approach somewhat less simplistic than Ellis & Palmer. (For instance, compare the Ellis & Palmer approach with that of, say, Willeit & Ganopolski (2018).)

I think that covers the issues from #407, hopefully in an understandable form.
- We're heading into an ice age
Lawrence Tenkman at 03:11 AM on 22 April, 2020Ralph Ellis suggests that the warming that ends glaciation is not from CO2 greenhouse effect, but instead dust storms cancelling albedo on northern ice sheets. He proposes that the inertia of natural cycles is towards glaciation: cold orbit forcings eventually start ice sheet formation, which adds albedo, which adds cold & more ice sheets, etc. When it gets cold enough, oceans draw in CO2, and at a critical point (low enough temp & low enough CO2) rapid plant death ensures at certain elevations. This allows for erosion / dust storms, which land on ice sheets to cancel their albedo. Although the dust effect he speaks of would not have as widespread effect throughout the world, it would have a local strong effect on the ice to break the feedback process. Because the critical cold temperature may take several Milankovitch cycles to reach, his theory may explain why not all Milankovitch spike result in glaciation escape. I’m curious what experts think about his theory. (I am not an expert.) To me it seems to make sense and seems like a very disciplined paper. Maybe he uncovered the a key strong variable for escape of glaciation.
In light of his dust-albedo cancellation being a strong effect, Ellis then concludes that CO2 is too weak to threaten overheating us or runaway greenhouse effect, and we shouldn’t worry about it… afterall CO2 of 280 ppm had too weak an effect (about 3.7 W/m2?) to prevent entry into glaciation. Ellis suggested that its almost like we were put here to burn fossil fuels to prevent an ice age.
I hesitate to follow him to all of his conclusions though. For one, why the two must be mutually exclusive? If his strong local “trigger” indeed matters more for glaciation exit, why must CO2, which is cumulative, lasting, global, & rapidly rising not matter at a high enough level in our situation? I’m most concerned that temp is quickly rising despite cooling forces from solar & orbital cycles… and we’ve only begun to make CO2 at a very rapid rate.
In terms of “preventing an ice age”. Many above suggest we’ve already prevented or much delayed it. Also, many above suggest, CO2 is like a gas pedal that recoils slowly once pressed. Future generations could always press the pedal further if determined necessary for ice age avoidance thousands of years in the future. But if we determine that we’ve pressed it too far, and are now in danger… too late. Can’t draw CO2 down rapidly.
I’m no expert though… so I’d much appreciate an expert’s reflection on the significance of Ellis’s paper.
http://science.uwaterloo.ca/~mpalmer/stuff/ellis.pdf
- YouTube's Climate Denial Problem
nigelj at 12:28 PM on 12 April, 2020duncan61 @34, you claim some data supports sea level rise and some data says there is more ice, so presumably no sea level rise. You give no details or examples or sources.
Sea level rise is measured by both tidal gauges and satellite and they both unequivocally show sea leve rise. Satellites are also able to monitor the mass balance of ice sheets and show Greenland is losing ice dramatically and Antarctica is losing ice slightly. Glaciers are also monitored and most are losing ice. If you just bothered to read the appropriate information under secptical myths on the left side of this page you can get some details.
Now the denialist side of the debate typically make claims that glaciers are advancing, but if you read carefully they refer to just a small subset of glaciers, or they say sea ice is increasing somewhere when this doesn't actually affect sea level rise so its not relevant. Or they say Antarctica is not losing ice or much ice, while not mentioning that plenty of other places are. Or sometimes the denialists data is just made up.
None of this is new, in fact its now almost ancient history. I have several times explained these sorts of climate things diplomatically but you dont seem to get it. I cannot make you understand if you can't or won't, and I can't teach you critical thinking skills if you cant or wont.
We have tidal gauges and satellites and historical photos and god knows what all pointing to melting ice and sea level rise and its very hard for me to believe these systems of measurement and observation would all be 100% wrong because so many differerent monitoring systems show the same thing. I equally find it hard to believe its all some conspiracy. But perhaps you are built differently.
Personally I think you are just trolling for attention, and that you will come back with a whole lot of silly data.
- CO2 lags temperature
Philippe Chantreau at 03:44 AM on 3 February, 2020I believe that I had read Map's initial comment correctly and that he is indeed referring to what some call the Mid-Pleistocene transition. This is an area of active research and, although his posts are poorly formulated, I do not see that map deserves scorn for enquiring about it.
The recent regime of 100,000 years interglacial was preceded in the paleo record by a longer period where the 41,000 years cycle dominated. Wikipedia has a good explanation and plenty of links to scientific literature, including some recent ones.
Citing the wiki page:
"There is strong evidence that the Milankovitch cycles affect the occurrence of glacial and interglacial periods within an ice age. The present ice age is the most studied and best understood, particularly the last 400,000 years, since this is the period covered by ice cores that record atmospheric composition and proxies for temperature and ice volume. Within this period, the match of glacial/interglacial frequencies to the Milanković orbital forcing periods is so close that orbital forcing is generally accepted (emphasis mine). The combined effects of the changing distance to the Sun, the precession of the Earth's axis, and the changing tilt of the Earth's axis redistribute the sunlight received by the Earth. Of particular importance are changes in the tilt of the Earth's axis, which affect the intensity of seasons. For example, the amount of solar influx in July at 65 degrees north latitude varies by as much as 22% (from 450 W/m² to 550 W/m²). It is widely believed that ice sheets advance when summers become too cool to melt all of the accumulated snowfall from the previous winter. Some believe that the strength of the orbital forcing is too small to trigger glaciations, but feedback mechanisms like CO2 may explain this mismatch."
Further down: "During the period 3.0–0.8 million years ago, the dominant pattern of glaciation corresponded to the 41,000-year period of changes in Earth's obliquity (tilt of the axis). The reasons for dominance of one frequency versus another are poorly understood and an active area of current research, but the answer probably relates to some form of resonance in the Earth's climate system. Recent work suggests that the 100K year cycle dominates due to increased southern-pole sea-ice increasing total solar reflectivity."
Worth noting:
https://agupubs.onlinelibrary.wiley.com/doi/full/10.1002/2016GL071307
There are plenty of other interesting references in the Wiki.
Map,
To have a productive exchange here, you can not be vague with statements like "I have read somewhere" and such. These are used all the times by people who argue in bad faith and trigger the corresponding response from other posters, for which you can not blame those who respond. Scientific references are a must. Specific inquiries and precise questions are helpful.
It should be noted that the regime in the paleo record has now been completely replaced and that we are in entirely new conditions because of the massive injection of CO2 in the atmosphere from the past 100 years.
- 2019 in climate science: A continued warming trend and 'bleak' research
richieb1234 at 21:10 PM on 13 January, 2020As a relative newcomer to the climate change issue, I find it surprising that our preferred figure of merit is global mean surface temperature (GMST). Is it advisable for the IPCC to state their goals in terms of limiting global warming to a GMST rise of 1.5 degree C, or even a 2.0 degrees? People I talk to are not alarmed by those figures. They see that much change every day of their lives.
Climate deniers find it very easy to raise doubt about whether the temperature measurements are accurate; whether calculating a global aveage is meaningful; whether that small a temperature difference is dangerous; and whether "that small an effect" is just due to natural fluctuations. We end up debating whether models are validated and how much committed heating there is. [Have we already passed 1.5 degrees?]. It sometimes seems like a losing battle.
Moreover, none of the consequences of global warming arise from GMST. They arise from the addition of heat to the oceans, the ice sheets, the soil and the atmosphere.
Wouldn't Earth's Energy Imbalance (EEI) or ocean heat content (OHC) be more compelling figures of merit? These numbers are enormous; the equivalent of detonating a nuclear weapon every few seconds. They are more easily attibutable to fossil fuel. They have direct impact on consequences such as sea rise, ice melting and drought. And future projections are less dependent on models.
I would be vey interested in hearing other opinions on this question.
Very Respectfully, --Richieb1234
- The never-ending RCP8.5 debate
nigelj at 14:45 PM on 31 December, 2019Evan @24, and I dont want to nitpick either, but meltwater pulse 1a happened during a period with vast ice sheets over much of the planet so its not directly comparible with todays conditions. Two metres makes more sense to me.
- The never-ending RCP8.5 debate
Daniel Bailey at 10:42 AM on 31 December, 2019I spoke with Alley at the AGU this year. He indicated as much because of coming research showing that the ongoing melting of the ice sheets and thinning of the glacial tongues in Antarctica is causing the surrounding ocean to have a freshwater lens on the top.
Why this matters is becuase the upwelling warm water at depth can no longer reach the surface and instead is being redirected like a "blowtorch" at the base of the adjacent ice sheets.
Because the models treat the ice sheet like a "white painted rock" (the models do not feature coupled, dynamic interconnections between the ice, atmosphere and the sea) they therefore miss a great deal of the interplay driving the acceleration of ice mass losses there.
- Video: Is CO2 actually dangerous?
One Planet Only Forever at 02:15 AM on 8 December, 2019nigelj,
Trying to be brief, clear, attention getting, and unable to be misinterpreted is very hard.
Even warning about the end of the world "as we know it" does not say what needs to be said.
If "all of the SDGs, but especially the Climate Action Goals, are not achieved by 2030 and improved on after that time", humanity will have a much tougher time developing a sustainable future that can be improved by new sustainable developments.
The world humanity developed in is already irreversibly negatively affected in many ways. And lack of action towards achieving all of the SDGs by 2030, and improving on them all, makes it worse.
We are already seeing extinctions of life forms as a result of the harmful unsustainable ways of living that the current fatally flawed developed socioeconomic-political systems encourage because popularity and profitability are claimed to be "Irrefutable Proof of Good and Deserving". And the climate change tipping point of one of the Antarctic Ice Sheets has already been passed.
The robust diversity of life for a robust diversity of humanity to sustainably be a part of is being irreversibly damaged. And a very slow changing physical planet has also been irreversibly impacted by sped up changes.
The Harm of CO2 from fossil fuels is a by-product of the harm of human competition for perceptions of superiority relative to others. The developed systems, especially ones that measure merit by popularity and profitability but do not effectively limit what is allowed in the competition, are "the world as we know it" that actually needs to be ended by 2030, the sooner the better.
Actions that are likely to be sustainable should be the only actions allowed to compete. And if new learning identifies that an action is not as sustainable as originally thought, a good system would rapdly shut it down, not caring about how popular or profitable it was, and not caring to 'protect the perceptions of wealth that had been developed'. That was done with MTBE (google it). But it is essential for the system to care to make sure everyone is helped to rapidly transition to a sustainable way of living as the developed unsustainable action is very rapidly terminated.
Correcting the massively incorrect system and its current day developments means a lot of people who perceive themselves as winners actually have to admit they are 'less deserving' and need to change how they live and be more helpful to others as they give up personal benefits.
Try to say that briefly. It is what the SDGs and the GND are all about. But it cannot be 'stated briefly'. And more careful communication of climate science will not do it.
- Sea level rise is exaggerated
Daniel Bailey at 09:28 AM on 1 December, 2019Not sure what your definition of "uniformly even" is. Did you expect them to be so?
Firstly, global sea level rise is a global average and the surface of the oceans are anything but level (the surface of the oceans follow the gravitic shape of the Earth and are also subject to solar, lunar, sloshing and siphoning effects and oceanic oscillations, etc, all of which need to be controlled for).
From the NCA4, global average sea level has risen by about 7–8 inches since 1900, with almost half (about 3 inches) of that rise occurring since 1993:

From NOAA STAR NESDIS:

"Only altimetry measurements between 66°S and 66°N have been processed. An inverted barometer has been applied to the time series. The estimates of sea level rise do not include glacial isostatic adjustment effects on the geoid, which are modeled to be +0.2 to +0.5 mm/year when globally averaged."
Regional SLR graphics are also available from NOAA STAR NESDIS, here.
This is a screenshot of NOAA's tide gauge map for the Western Pacific (NOAA color-codes the relative changes in sea levels to make it easier to internalize):

Clicking on the Funafuti, Tuvalu tide gauge station we see that sea levels are rising by 3.74 mm/yr (above the global average) there, with a time series starting around 1978 and ending about 2011:

However, the time series used by your BOM link for Funafuti (1993-2019) is shorter and the BOM also does not apply a linear trend line to it like NOAA does:

Feel free to make further comparisons, but comparing a set of graphics with no trend lines vs those with trend lines is no comparison at all.
From the recent IPCC Special Report 2019 - Ocean and Cryosphere in a Changing Climate - Summary for Policy Makers, September 25, 2019 release (SROCC 2019), the portions on sea level rise:Observed Physical Changes
A3. Global mean sea level (GMSL) is rising, with acceleration in recent decades due to increasing rates of ice loss from the Greenland and Antarctic ice sheets (very high confidence), as well as continued glacier mass loss and ocean thermal expansion. Increases in tropical cyclone winds and rainfall, and increases in extreme waves, combined with relative sea level rise, exacerbate extreme sea level events and coastal hazards (high confidence).A3.1 Total GMSL rise for 1902–2015 is 0.16 m (likely range 0.12–0.21 m). The rate of GMSL rise for 2006–2015 of 3.6 mm yr–1 (3.1–4.1 mm yr–1, very likely range), is unprecedented over the last century (high confidence), and about 2.5 times the rate for 1901–1990 of 1.4 mm yr–1 (0.8– 2.0 mm yr–1, very likely range). The sum of ice sheet and glacier contributions over the period 2006–2015 is the dominant source of sea level rise (1.8 mm yr–1, very likely range 1.7–1.9 mm yr–1), exceeding the effect of thermal expansion of ocean water (1.4 mm yr–1, very likely range 1.1–1.7 mm yr–1) (very high confidence). The dominant cause of global mean sea level rise since 1970 is anthropogenic forcing (high confidence).
A3.2 Sea-level rise has accelerated (extremely likely) due to the combined increased ice loss from the Greenland and Antarctic ice sheets (very high confidence). Mass loss from the Antarctic ice sheet over the period 2007–2016 tripled relative to 1997–2006. For Greenland, mass loss doubled over the same period (likely, medium confidence).
A3.3 Acceleration of ice flow and retreat in Antarctica, which has the potential to lead to sea-level rise of several metres within a few centuries, is observed in the Amundsen Sea Embayment of West Antarctica and in Wilkes Land, East Antarctica (very high confidence). These changes may be the onset of an irreversible (recovery time scale is hundreds to thousands of years) ice sheet instability. Uncertainty related to the onset of ice sheet instability arises from limited observations, inadequate model representation of ice sheet processes, and limited understanding of the complex interactions between the atmosphere, ocean and the ice sheet.
A3.4 Sea-level rise is not globally uniform and varies regionally. Regional differences, within ±30% of the global mean sea-level rise, result from land ice loss and variations in ocean warming and circulation. Differences from the global mean can be greater in areas of rapid vertical land movement including from local human activities (e.g. extraction of groundwater). (high confidence)
A3.5 Extreme wave heights, which contribute to extreme sea level events, coastal erosion and flooding, have increased in the Southern and North Atlantic Oceans by around 1.0 cm yr–1 and 0.8 cm yr–1 over the period 1985–2018 (medium confidence). Sea ice loss in the Arctic has also increased wave heights over the period 1992–2014 (medium confidence).
A3.6 Anthropogenic climate change has increased observed precipitation (medium confidence), winds (low confidence), and extreme sea level events (high confidence) associated with some tropical cyclones, which has increased intensity of multiple extreme events and associated cascading impacts (high confidence). Anthropogenic climate change may have contributed to a poleward migration of maximum tropical cyclone intensity in the western North Pacific in recent decades related to anthropogenically-forced tropical expansion (low confidence). There is emerging evidence for an increase in annual global proportion of Category 4 or 5 tropical cyclones in recent decades (low confidence).
B3. Sea level continues to rise at an increasing rate. Extreme sea level events that are historically rare (once per century in the recent past) are projected to occur frequently (at least once per year) at many locations by 2050 in all RCP scenarios, especially in tropical regions (high confidence). The increasing frequency of high water levels can have severe impacts in many locations depending on exposure (high confidence). Sea level rise is projected to continue beyond 2100 in all RCP scenarios. For a high emissions scenario (RCP8.5), projections of global sea level rise by 2100 are greater than in AR5 due to a larger contribution from the Antarctic Ice Sheet (medium confidence). In coming centuries under RCP8.5, sea level rise is projected to exceed rates of several centimetres per year resulting in multi-metre rise (medium confidence), while for RCP2.6 sea level rise is projected to be limited to around 1m in 2300 (low confidence). Extreme sea levels and coastal hazards will be exacerbated by projected increases in tropical cyclone intensity and precipitation (high confidence). Projected changes in waves and tides vary locally in whether they amplify or ameliorate these hazards (medium confidence).
B3.1 The global mean sea level (GMSL) rise under RCP2.6 is projected to be 0.39 m (0.26–0.53 m, likely range) for the period 2081–2100, and 0.43 m (0.29–0.59 m, likely range) in 2100 with respect to 1986–2005. For RCP8.5, the corresponding GMSL rise is 0.71 m (0.51–0.92 m, likely range) for 2081–2100 and 0.84 m (0.61–1.10 m, likely range) in 2100. Mean sea level rise projections are higher by 0.1 m compared to AR5 under RCP8.5 in 2100, and the likely range extends beyond 1 m in 2100 due to a larger projected ice loss from the Antarctic Ice Sheet (medium confidence). The uncertainty at the end of the century is mainly determined by the ice sheets, especially in Antarctica.
B3.2 Sea level projections show regional differences around GMSL. Processes not driven by recent climate change, such as local subsidence caused by natural processes and human activities, are important to relative sea level changes at the coast (high confidence). While the relative importance of climate-driven sea level rise is projected to increase over time, local processes need to be considered for projections and impacts of sea level (high confidence).
Projected Changes and Risks
B3.3 The rate of global mean sea level rise is projected to reach 15 mm yr–1 (10–20 mm yr–1, likely range) under RCP8.5 in 2100, and to exceed several centimetres per year in the 22nd century. Under RCP2.6, the rate is projected to reach 4 mm yr-1 (2–6 mm yr–1, likely range) in 2100. Model studies indicate multi-meter rise in sea level by 2300 (2.3–5.4 m for RCP8.5 and 0.6–1.07 m under RCP2.6) (low confidence), indicating the importance of reduced emissions for limiting sea level rise. Processes controlling the timing of future ice-shelf loss and the extent of ice sheet instabilities could increase Antarctica’s contribution to sea level rise to values substantially higher than the likely range on century and longer time-scales (low confidence). Considering the consequences of sea level rise that a collapse of parts of the Antarctic Ice Sheet entails, this high impact risk merits attention.B3.4 Global mean sea level rise will cause the frequency of extreme sea level events at most locations to increase. Local sea levels that historically occurred once per century (historical centennial events) are projected to occur at least annually at most locations by 2100 under all RCP scenarios (high confidence). Many low-lying megacities and small islands (including SIDS) are projected to experience historical centennial events at least annually by 2050 under RCP2.6, RCP4.5 and RCP8.5. The year when the historical centennial event becomes an annual event in the mid-latitudes occurs soonest in RCP8.5, next in RCP4.5 and latest in RCP2.6. The increasing frequency of high water levels can have severe impacts in many locations depending on the level of exposure (high confidence).
B3.5 Significant wave heights (the average height from trough to crest of the highest one-third of waves) are projected to increase across the Southern Ocean and tropical eastern Pacific (high confidence) and Baltic Sea (medium confidence) and decrease over the North Atlantic and Mediterranean Sea under RCP8.5 (high confidence). Coastal tidal amplitudes and patterns are projected to change due to sea level rise and coastal adaptation measures (very likely). Projected changes in waves arising from changes in weather patterns, and changes in tides due to sea level rise, can locally enhance or ameliorate coastal hazards (medium confidence).
B3.6 The average intensity of tropical cyclones, the proportion of Category 4 and 5 tropical cyclones and the associated average precipitation rates are projected to increase for a 2°C global temperature rise above any baseline period (medium confidence). Rising mean sea levels will contribute to higher extreme sea levels associated with tropical cyclones (very high confidence). Coastal hazards will be exacerbated by an increase in the average intensity, magnitude of storm surge and precipitation rates of tropical cyclones. There are greater increases projected under RCP8.5 than under RCP2.6 from around mid-century to 2100 (medium confidence). There is low confidence in changes in the future frequency of tropical cyclones at the global scale.
Challenges
C3. Coastal communities face challenging choices in crafting context-specific and integrated responses to sea level rise that balance costs, benefits and trade-offs of available options and that can be adjusted over time (high confidence). All types of options, including protection, accommodation, ecosystem-based adaptation, coastal advance and retreat, wherever possible, can play important roles in such integrated responses (high confidence).C3.1. The higher the sea levels rise, the more challenging is coastal protection, mainly due to economic, financial and social barriers rather than due to technical limits (high confidence). In the coming decades, reducing local drivers of exposure and vulnerability such as coastal urbanization and human-induced subsidence constitute effective responses (high confidence). Where space is limited, and the value of exposed assets is high (e.g., in cities), hard protection (e.g., dikes) is likely to be a cost-efficient response option during the 21st century taking into account the specifics of the context (high confidence), but resource-limited areas may not be able to afford such investments. Where space is available, ecosystem-based adaptation can reduce coastal risk and provide multiple other benefits such as carbon storage, improved water quality, biodiversity conservation and livelihood support (medium confidence).
C3.2 Some coastal accommodation measures, such as early warning systems and flood-proofing of buildings, are often both low cost and highly cost-efficient under current sea levels (high confidence). Under projected sea level rise and increase in coastal hazards some of these measures become less effective unless combined with other measures (high confidence). All types of options, including protection, accommodation, ecosystem-based adaptation, coastal advance and planned relocation, if alternative localities are available, can play important roles in such integrated responses (high confidence). Where the community affected is small, or in the aftermath of a disaster, reducing risk by coastal planned relocations is worth considering if safe alternative localities are available. Such planned relocation can be socially, culturally, financially and politically constrained (very high confidence).
C3.3 Responses to sea-level rise and associated risk reduction present society with profound governance challenges, resulting from the uncertainty about the magnitude and rate of future sea level rise, vexing trade-offs between societal goals (e.g., safety, conservation, economic development, intra- and inter-generational equity), limited resources, and conflicting interests and values among diverse stakeholders (high confidence). These challenges can be eased using locally appropriate combinations of decision analysis, land-use planning, public participation, diverse knowledge systems and conflict resolution approaches that are adjusted over time as circumstances change (high confidence).
C3.4 Despite the large uncertainties about the magnitude and rate of post 2050 sea level rise, many coastal decisions with time horizons of decades to over a century are being made now (e.g., critical infrastructure, coastal protection works, city planning) and can be improved by taking relative sea-level rise into account, favouring flexible responses (i.e., those that can be adapted over time) supported by monitoring systems for early warning signals, periodically adjusting decisions (i.e., adaptive decision making), using robust decision-making approaches, expert judgement, scenario-building, and multiple knowledge systems (high confidence). The sea level rise range that needs to be considered for planning and implementing coastal responses depends on the risk tolerance of stakeholders. Stakeholders with higher risk tolerance (e.g., those planning for investments that can be very easily adapted to unforeseen conditions) often prefer to use the likely range of projections, while stakeholders with a lower risk tolerance (e.g., those deciding on critical infrastructure) also consider global and local mean sea level above the upper end of the likely range (globally 1.1 m under RCP8.5 by 2100) and from methods characterised by lower confidence such as from expert elicitation.
To sum:
1. Global sea levels continue to rise, with the rise itself accelerating (due to an acceleration in land-based ice sheet mass losses). This will continue, for beyond the lifespans of any now alive.
2. Beware of the eyecrometer. It will deceive you, if you allow it to.

SLR Components, from Cazenave et al 2018
- Search For 'Missing Heat' Confirms More Global Warming 'In The Pipeline'
michael sweet at 22:15 PM on 29 November, 2019Ritchie,
Good luck pinning down warming in the pipeline. This is a much discussed topic.
One problem is different scientists use different definitions of the term. Make sure you are comparing apples and apples.
Hansen has estimated a long term Whole Earth Equilibrium. That used to be double other estimates but it may have been changed. As the ice sheets melt (over hundreds of years) albedo goes down, causing more warming. Sea ice melt has started this change already. Do you care about the pipeline for the next 50 years or the final temperature in 1000 years?
Sea level rise is the same. Recent estimates of 600 million refugees by 2100 (for a moderate rise estimate) do not discuss equilibrium sea level rise (the last time CO2 was over 400 ppm sea level was 23 meters higher!!!).
You did not mention the delay caused by deep ocean warming. The ocean is a gigantic heat sink that will take hundreds of years to come to equilibrium. Sometimes 40 years is used for just the upper layers to warm.
- CO2 was higher in the past
nyood at 07:02 AM on 7 November, 2019I want to subsequently deliver a source that confirms what i said with: "Snow will not accumulate ice sheets on the sea" and therefore is crucial to my theory:
To not falsify anything with my own translation, i google translated this middle part:
"Ice ages seem to occur only when there is a larger land mass at least at one geographic pole. Snow has to lie on the continents and not fall into the water, so that a snowpack can form in relatively high latitudes and ice can form over time. Once this is the case, positive ice-albedo feedback occurs due to the high positive albedo values of snow and ice, and further cooling occurs."
- CO2 was higher in the past
nyood at 04:18 AM on 7 November, 2019@MA Rodger
(1a) "To present a value for CO2 forcing without providing evidential support is not axiomatic,
either in the sense of it being self-evident or (probably in the sense you intend) unquestioningly-evident.
The evidence can be presented should you so wish and, uncontroversially beyond-question, it is correct.You yourself present @92 an unsupported evaluation of CO2 forcing, providing a maximum value which appears novel and controversial in the extreme.
You fail to present any evidential support which in the circumstance is turning this discussion into a pantomime.
Perhaps you could correct the untenable postion you create for yourself by providing that missing evidence."(1a) The evidence that i imagine you would provide, will all result in the question: What is missing? This is manifested in the fact that you will get no exact value for CO2 sensitivity, despite known elemental spectral laws regarding infrared absorption. In other words: We are still estimating with 1,5°C - 4,5°C per doubling (?).
The theory that CO2 reaches a "saturation" already, is just the most likely aproach to me. However the forcings of HHE/LPC could be even that strong
that they shrink down all other factors making them neglectable, not "needing" any other explanation to temperature.The major evidence i can deliver here is the fact that the so called saturation for each GHG is one of the known unkwons and that there are countless debates
on this issue, underlining how unsolved this whole matter is."(1b) Your confused statements regarding HHE/LPC appear to contrdict the geographical situation as commonly understood,
in that the "Land mass" Gondwawa sits static over the "Polar Circle" throughtout this period.
You need to consider how it is your LPC appears then disappears within this period when the contition you say causes LPC remains unchanging?"(1b) I see no contradiction, in my former post i gave you the 2 links with the continental distribution, matching my theory.(Ordovizium, Silur)
I see what you are getting at though wih Schwanck slide 11: The pictures with the "paleo glacial reconstruction". They use a static continental distribution here. It is more likely that the continents were merging towards the hirnation. In a larger perspective the continents definetly move towards the pole, documented by the ordovician with the silurian as a whole. The ice needs to build up and the Boda event interrupted the glaciation process by reducing ice albedo.
"(2) Your cut-&-paste from the Schwark & Bauersachs slides appears particularly inept as support for your assertion "in fact it doubts CO2 as a driver."
If you, for instance, examine Slide 11 you will see your assertion is fundamentally contradicted."What is contradicted here? Slide 11 shows the Boda event and its CO2 emissions, the CO2 does not matter to me, regarding temperature, the factors that matter are albedo reducing ashes and dust.
If you are refering to this sentence on page 11: "atmospheric emission of large amounts of CO2 and subsequent climate warming, and.."
Then i can only tell you that Schwarck et.al are using the neglectable CO2 sensitivity axiomata here. The reason why the Katian doubts ´CO2 as a driver´ is because it marks, with all other epoches preceeding the LPC event, the time where CO2 fails to work as assumed. Where should it show its significant forcing if not here?
"(3) Here you really do dip into uncomprehensibility. Do note that the Schwark & Bauersachs slides do not ever say CO2
dropped to present atmospheric levels 400-odd million years ago.
The statement you misread from Slide 23 says purely that CO2 varied "between 8-16 x PAL and near PAL."
The value 1500ppm can be taken from their Slide 11."(3) Well, it does not matter to me, if you want it can be 1500ppm, i would not consider that close to PAL though. PAL would just makes sense to me since the ordovician
is compareable to all other LPC events.
Near Pal makes sense to me because it would reach common glacial CO2 levels. I have not enough knowledge of solubility.
Near Pal is enough for me to support the theory when it comes to: All equilibrium events and the transitions inbetween happen in the same fashion, despite varying CO levels.
"(4) If it is not land at the polar circle that creates your LPC condition; if it is ice-covered land,
you do then reqire to explain the forcing that allows the growth/shrinkage of that ice.
And in doing so, your theory now lacking the tectonic element, do consider that you are now describing a climate feedback not a climate forcing."The factor that you are missing here is indeed a fundamental one. It is the fact that snow will not accumulate ice sheets on the sea.
The double proof for this is the arctic sea, with Greenland within the polar circle.In fact with your misunderstanding here it makes me wonder if continental drift as a time dependet factor is included in the prognostications and not only be representd by the, in itself correctly implemented, ice albedo.
In other words:Fundamently excluding a long term factor of warming.
- Antarctica is gaining ice
Cedders at 18:28 PM on 15 October, 2019Comment 475 and its references are very helpful. Comment 452 is undoubtedly spam!
Zwally (2015) is still doing the rounds on social media, although there seems to have been much research reconciling it since. I also found the Scambos & Shuman comment, Martin‐Español et al (2017) (press release here), IMBIE (2018) highlighting the possible range of East Antarctica loss or gain, and then a couple for 2019 not directly linked in these comments so far:
- Shepherd, Gilbert, Muir, Konrad, McMillan, Slater, Briggs, Sundal, Hogg, Engdahl: Trends in Antarctic Ice Sheet Elevation and Mass, Geophysical Research Letters, 2019, DOI: 10.1029/2019GL082182
- data and animation here
- Eurekalert press
- Rignot, Mouginot, Scheuchl, van den Broeke, van Wessem, Morlighem: Four decades of Antarctic Ice Sheet mass balance from 1979–2017, PNAS 2019 116 (4) 1095-1103. DOI: 10.1073/pnas.1812883116
The Scientific American article "What to Believe in Antarctica’s Great Ice Debate" by Shannon Hall says 'Most scientists agree that East Antarctica—unlike its western counterpart—is gaining mass in the form of snowfall or ice'. I notice that Shepherd et al agrees with that (East Antarctica subtracting 1.1 ± 0.4mm sea level rise since 1992), but Rignot at al says E Antarctica has contributed 4.4 ± 0.9 mm in the same period. All the above agree that Antarctica as a whole is losing mass (mostly from glacier flow into the sea), but one study says three times more than the other.
- The upcoming ice age has been postponed indefinitely
Daniel Bailey at 08:53 AM on 14 October, 2019In response to your question about the timing of the next potential glacial phase inception, here's what the AR5, WG1, Chapter 5 has to say about that:
"It is virtually certain that orbital forcing will be unable to trigger widespread glaciation during the next 1000 years. Paleoclimate records indicate that, for orbital configurations close to the present one, glacial inceptions only occurred for atmospheric CO2 concentrations significantly lower than pre-industrial levels. Climate models simulate no glacial inception during the next 50,000 years if CO2 concentrations remain above 300 ppm. {5.8.3, Box 6.2}"
Further:
"Even in the absence of human perturbations no substantial build-up of ice sheets would occur within the next several thousand years and that the current interglacial would probably last for another 50,000 years. However, moderate anthropogenic cumulative CO2 emissions of 1,000 to 1,500 gigatonnes of carbon will postpone the next glacial inception by at least 100,000 years....under natural conditions alone the Earth system would be expected to remain in the present delicately balanced interglacial climate state, steering clear of both large-scale glaciation of the Northern Hemisphere and its complete deglaciation, for an unusually long time"
Looking beyond that, research has found that the ability to offset the next 5 glacial phase inceptions lies within the purview of humans:
"Our research shows why atmospheric CO2 will not return to pre-industrial levels after we stop burning fossil fuels. It shows that it if we use up all known fossil fuels it doesn't matter at what rate we burn them.
The result would be the same if we burned them at present rates or at more moderate rates; we would still get the same eventual ice-age-prevention result."
And
"Burning all recoverable fossil fuels could lead to avoidance of the next five ice ages."
- Climate's changed before
Eclectic at 23:31 PM on 7 October, 2019Estoma @790 ,
I am not sure whether you are comparing arctic-localized (e.g. Greenland ice-core temperature proxies) changes with worldwide changes of smaller degree.
There were also steep rises in Greenhouse gasses (especially methane) and giant meltwater pulses affecting sea-level & the oceanic heat transfer from the tropics. All producing rapid fluctuation (see the Younger Dryas ). Still, one needs to ask: what caused the melting of land ice-sheets ~ if it wasn't caused by cumulative effect of gradually increasing Greenhouse effect? (That is a question that the "skeptics" don't wish to ask.)
The present-day rapid worldwide warming is not part of a transient up-and-down fluctuation, but is a strong & steady rise with a clear ongoing causation by CO2. World temperature has (compared with the gentle & slight variations of the past 10,000 years of the Holocene) now abruptly risen higher than the Holocene Maximum and is still rising steeply. And has occurred at a time (of roughly 5,000 years' duration) where the natural background tendency is toward ongoing global cooling.
Altogether, the two cases (of B-A events versus nowadays) are so very different in their long-term importance, that it is perfectly fair to say that current-day gobal warming is unprecedented in its character ( and in its human causation !! )
I think your "skeptic" is indulging in some Motivated Reasoning, and playing with words, in order to conceal the plain physical truth of what is happening globally.
- We're heading into an ice age
AlexDeBastiat at 11:36 AM on 25 September, 2019Thanks for your posts. I'm starting to see your points on this.
In the past, the orbital cycle must've had enough effect to start a feedback loop to begin the glaciation cycle. As the ice sheets grew, it reflected more and more solar energy. At the same time, carbon based life increasingly died off due to the temperature change, trapping CO2 on earth. When the orbital cycle reversed, all of this CO2 was released back into the atmosphere again through its own feedback loop (life begetting more and more CO2). This warming feedback loop is also proof that CO2 plays a very large role in warming as there is no other reason to explain how the temperature could spike so much during the interglaciations.
Now in the last 150 yrs or so...Humans have created a new mechanism which allows for a substantial amount of pre holocene CO2 (which was trapped deep under the ground) to be emitted back into the atmosphere....and this likely has altered the normal feedback loops we have seen in the data for the holocene.
Since there is so much CO2 in the atmosphere now, these cycles may now likely be broken and meaningless as our CO2 concentration are out of the norm for the holocene. This makes sense to me given that we are using CO2 from periods(jurassic, etc.) where temperatures were much hotter then the holocene.
- Climate's changed before
MA Rodger at 18:31 PM on 24 September, 2019TVC15 @776,
The denialist asks about the features of two different times and asks what is different today.
20,000 years ago was the maximum glaciation of the last ice age, this the result of reduced solar radiation for the high-latitude Northern summers which 100,000 years ago triggered an increase in the amount of ice-covered land/ocean in high Northern latitudes. The level of ice was amplified by the increased albedo of the ice reflecting away greater levels of solar radiation and by the reduced GHGs (CO2 & methane) caused by the cooling global climate having a net draw-down of such gases. Thus we find the Laurentide & Cordilleran ice sheets covering mainly Canada and beyond, extending to cover the sites of today's Great Lakes. (The map below ignores changing coast lines.) It thus requires the Laurentide Ice Sheet to melt considerably before the Great Lakes can exist, their formation reportedly beginning 14,000 years ago.
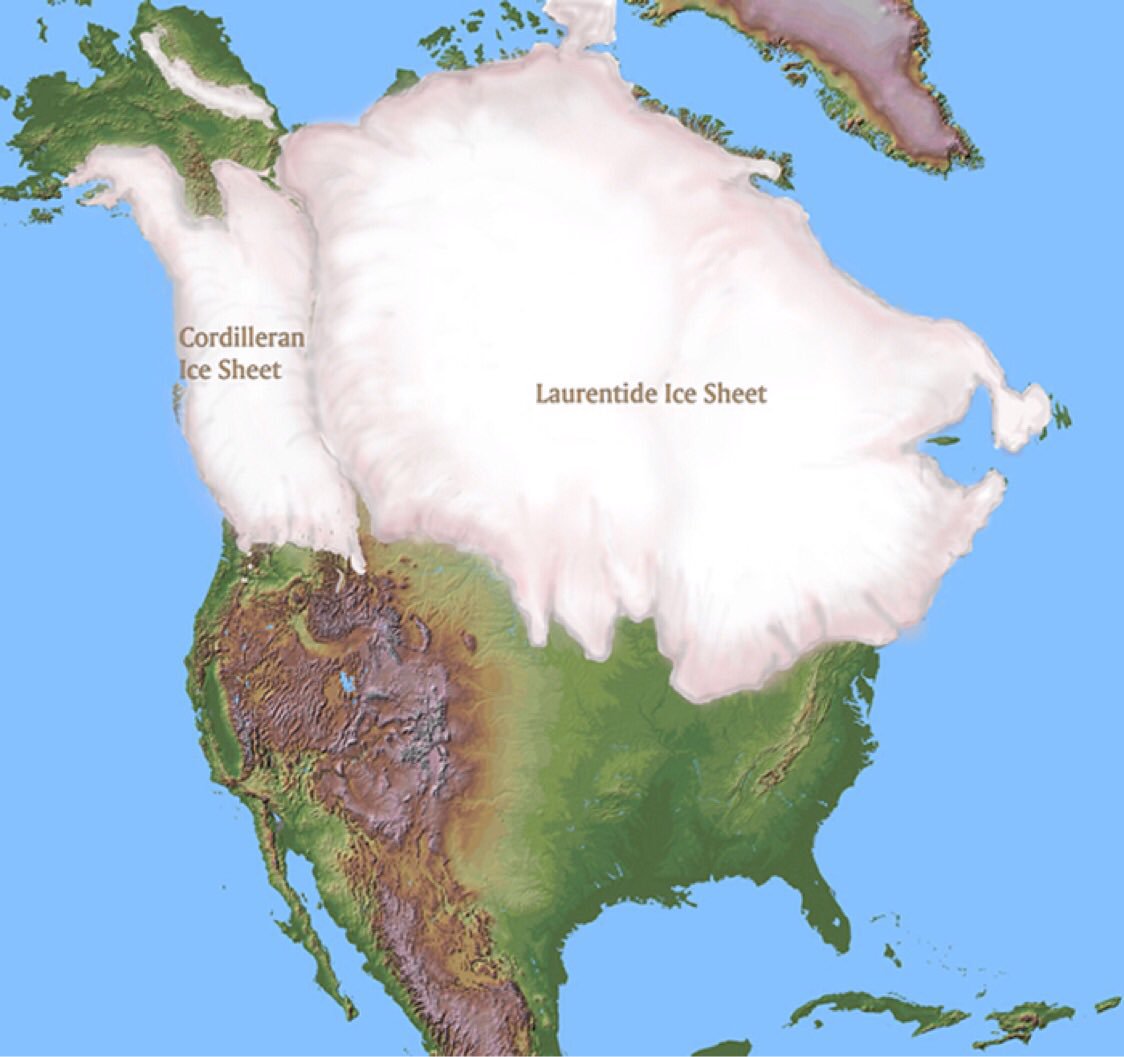
We now leap forward to a time when the Cordilleran ice sheet has long gone. Over recent times the dynamics of glaciers is not always determined by local temperature. A sea-terminating glacier will likely spend most of its days slowing advancing and then, becoming unstable, undergo a short period of rapid retreat. And reduced/increased snowfall can cause a glacier to shrink/expand.
So is there evidence that "Alaskan Glaciers started receding big time around 1750 to 1900"? Solomina et al (2016) who, in an analysis of global glaciers over the last two millenia, examine land-terminated glaciers in Alaska and see no sign of it. Their Fig 2 shows a GEI index indicating a fluctuation in local glacier size which peaked at about 1880AD. This would explain a "receding big time around ... 1900" but not the earlier 1750 date. Other research may give differing timings but it seems unlikely that there is any proper support for a 1750 to 1900 date. Can the denialist provide support for this bold assertion of his?
And "why is now any different"? The unprecidented global rise in temperatures will impact glaciers globally, including Alaska.
- What will Earth look like in 2100?
michael sweet at 22:32 PM on 15 September, 2019Curtain eater,
In general it is better to ask one question in one post and make another post to ask another question. Use the search function in the upper left to find posts that address your questions. Often existing posts answer your question. OP's usually have more information than comments.
The ocean is so big that if all the ice sheets melt the ocean will still be the same salinity as it is today. The question is how long it might be before it gets cold enough for the sheets to reform. That may be 100,000 years or longer. Climate changes today are essentially permanent for future people.
There is too much pollution to launch it into space. There are people who think carbon dioxide can be injected into the Earth to get rid of it. Other pollutants would need to be dealt with differently. The job of injecting carbon dioxide into the Earth is so large that many people feel it is impossible. It would at least be very expensive.
The quesion of "no return" depends on how you ask it. If you want to return to the climate of 1900 than it may be too late to do anything in your lifetime. It may be possible to return to 1900 in a few hundred years at great expense. Who will pay for it? If you want to return to the climate of 2015 that would be cheaper (although very expensive).
The bottom line for me is what climate is best. In general, the best climate is the one you are used to. Rapid change in climate is bad because you are not used to it. For example, farmers grow crops that require certain temperatures and rain patterns. If the climate shifts than farmers have to grow different foods and will not have the right equipment for the new crops.
If it gets hot enough many tropical areas will be too hot to live in. Where will all the people who live there move? We may have passed the point where hundreds of millions of people have to move to survive. One million people moving from Syria caused huge problems in Europe. How much would people like seeing 100 million people moving?
- Sea level rise is exaggerated
Daniel Bailey at 00:43 AM on 10 September, 2019As MA sagely notes, Chen 2014 is dated and newer studies with later data show an acceleration in SLR and with the mass component also increasing.
Per Yi et al 2017 - Acceleration in the Global Mean Sea Level Rise: 2005–2015:
"Global mean sea level rise has been accelerating for more than 100 years, and the acceleration in the last two decades seems to further increase"
And
"Our results show that the acceleration during the last decade (0.27 ± 0.17 mm/yr2 ) is about 3 times faster than its value during 1993–2014. The acceleration comes from three factors, that is, 0.04 ± 0.01 mm/yr2 (~15%) by land ice melting, 0.12 ± 0.06 mm/yr2 (~44%) by thermal expansion of the seawater, and 0.11 ± 0.02 mm/yr2 (~41%) by declining land water storage."
And
"we demonstrate that current advances in satellite gravimetry, and marine in situ measurements enable us to detect the acceleration in global sea level rise from 2005 to 2015, 11 years in total"
Other studies:
Cazenave et al 2018 - Global Sea Level Budget 1993–Present
"Ocean thermal expansion, glaciers, Greenland and Antarctica contribute by 42%, 21%, 15% and 8% to the global mean sea level over the 1993-present. We also study the sea level budget over 2005-present, using GRACE-based ocean mass estimates instead of sum of individual mass components. Results show closure of the sea level budget within 0.3 mm/yr. Substantial uncertainty remains for the land water storage component, as shown in examining individual mass contributions to sea level."
"Most recent studies (e.g., Dieng et al., 2017a, Ablain and Jugier, 2017b, Chen et al., 2017a, Chen et al., 2017b, Nerem et al., 2018b, WCRP, 2018) show that the GMSL is accelerating, and that this acceleration mostly arises from accelerated Greenland and Antarctica ice mass loss."
SLR Components, p. 1645, Figure 3:
Other salient studies:
- Dieng et al 2017 - New estimate of the current rate of sea level rise from a sea level budget approach
- Ablain and Jugier 2017
- Chen et al 2017a - The increasing rate of global mean sea-level rise during 1993–2014
- Chen et al 2017b - Groundwater Storage Changes: Present Status from GRACE Observations
On 2018 sea level rise acceleration:
"Global sea level rise is not cruising along at a steady 3 mm per year, it's accelerating a little every year, like a driver merging onto a highway, according to a powerful new assessment led by CIRES Fellow Steve Nerem. He and his colleagues harnessed 25 years of satellite data to calculate that the rate is increasing by about 0.08 mm/year every year—which could mean an annual rate of sea level rise of 10 mm/year, or even more, by 2100.
"This acceleration, driven mainly by accelerated melting in Greenland and Antarctica, has the potential to double the total sea level rise by 2100 as compared to projections that assume a constant rate—to more than 60 cm instead of about 30." said Nerem, who is also a professor of Aerospace Engineering Sciences at the University of Colorado Boulder. "And this is almost certainly a conservative estimate," he added. "Our extrapolation assumes that sea level continues to change in the future as it has over the last 25 years. Given the large changes we are seeing in the ice sheets today, that's not likely."
Also per Nerem et al 2018:
"the observed acceleration will more than double the amount of sea-level rise by 2100 compared with the current rate of sea-level rise continuing unchanged. This projection of future sea-level rise is based only on the satellite-observed changes over the last 25 y, assuming that sea level changes similarly in the future. If sea level begins changing more rapidly, for example due to rapid changes in ice sheet dynamics, then this simple extrapolation will likely represent a conservative lower bound on future sea-level change."

- The North Atlantic ocean current, which warms northern Europe, may be slowing
MA Rodger at 19:40 PM on 29 August, 2019Human 2932547 @11,
You are mistaken by the authorship you attribute to your citation which appears to be the same article that you linked-to @6 - 'Climate mythology:The Gulf Stream, European climate and Abrupt Change' This has no multiple authorship, just Richard Seager of the Lamont-Doherty Earth Observatory, Columbia University. nigelj @7 rightly describes it as a "one person's view."
Note the link on the webpage to a presentation by Seager which gives a better understanding of his argument and the modelling it is based on. (Both this presentation & the article appear to be over a decade old.) The presentation sets out the following conclusion:-"Conclusion: The climate system is so rich, complex, and still not well understood that the current emphasis on the limited impacts of the Gulf Stream and North Atlantic Ocean circulation is a serious distraction of effort and resources when many regions of theworld face a truly worrying future, even in the near-term." [original emboldening]
Your comment @9 (& repeated @11) concerning the article linked by nigelj @7 is perhaps overhasty. You brand the article as irrelevant because we are concerned with interglacial condiditons and the article concerened glacial conditions which could be fundamentally different. But do note the final lines of that article which runs with an 'on the other hand' rider, the ending:-
But [Jerry] McManus [of Columbia University] says that studies looking deeper into the ice ages have found that the 1500-year climate oscillations tend not to be nearly as strong during interglacial periods. “It would suggest that this kind of thing isn’t so likely to happen today,” he says. On the other hand, he adds, “In most interglacials, Greenland didn’t melt … and Greenland is currently melting.”
The only work Seager has had published directly** concerning the AMOC appears to be Delworth et al (2008) 'The Potential for Abrupt Change in the Atlantic Meridional Overturning Circulation'. Interestingly this skates over the warmth brought to northern latitudes by the AMOC.
Delworth et al (2008) does concur that there is measurable cooling resulting from a weaker AMOC but that the reduced strength of the AMOC will be small enough through the 21st century that this cooling will probably do no more than reduce the rate of AGW warming. "Even with the projected moderate AMOC weakening, it is still very likely that on multidecadal to century time scales a warming trend will occur over most of the European region downstream of the North Atlantic Current in response to increasing greenhouse gases, as well as over North America."
So it is a little strange that later in considering the impact of a collapsed AMOC, they write:-"Although our current understanding suggests it is very unlikely that the AMOC will collapse in the 21st century, the potential consequences of such an event could be severe. These would likely include sea level rise around the North Atlantic of up to 80 centimeters (in addition to what would be expected from broad-scale warming of the global ocean and changes in land-based ice sheets due to rising CO2), changes in atmospheric circulation conditions that influence hurricane activity, a southward shift of tropical rainfall belts with resulting agricultural impacts, and disruptions to marine ecosystems."
So not one mention of temperature effects, or importantly, no mention of there being minimal temperature effects.
** Seager & Battist (2007) considers abrupt climate change and its causes which includes the AMOC. - IPCC is alarmist
prove we are smart at 20:01 PM on 27 August, 2019I believe the IPCC reports are probably the most used information to help set climate policy around the globe. However after reading this,
http://climateextremes.org.au/wp-content/uploads/2018/08/What-Lies-Beneath-V3-LR-Blank5b15d.pdf
and part of their summary :
" Climate policymaking and the public narrative are significantly informed by the important work of the IPCC. However, IPCC reports also tend toward reticence and caution, erring on the side of “least drama”, and downplaying the more extreme and more damaging outcomes. Whilst this has been understandable historically, given the pressure exerted upon the IPCC by political and vested interests, it is now becoming dangerously misleading with the acceleration of climate impacts globally. What were lower-probability, higher-impact events are now becoming more likely. This is a particular concern with potential climatic tipping points — passing critical thresholds which result in step changes in the climate system — such as the polar ice sheets (and hence sea levels), and permafrost and other carbon stores, where the impacts of global warming are non-linear and difficult to model with current scientific knowledge.However the extreme risks to humanity, which these tipping points represent, justify strong precautionary management. Under-reporting on these issues is irresponsible, contributing to the failure of imagination that is occurring today in our understanding of, and response to, climate change. If climate policymaking is to be soundly based, a reframing of scientific research within an existential risk-management framework is now urgently required. This must be taken up not just in the work of the IPCC, but also in the UNFCCC negotiations if we are to address the real climate challenge. Current processes will not deliver either the speed or the scale of change required."
So, i was wondering just how correct is this need to modify the scope of the IPCC reports.
" What Lies Beneath" put into words my feelings on our current Aussie state - pretend we care but open more coal mines and do nothing..
This video was also enlightening , a new documentary series , pt 1.
https://www.breakthroughonline.org.au/#!
- Millions of times later, 97 percent climate consensus still faces denial
Doug_C at 05:09 AM on 21 August, 2019MA Rodger @31
There's clearly an unscientific bias being applied by climate change deniers. Despite the vast amount of objective evidence going back centuries that the Earth is in fact much warmer than it should be if just basic thermodynics were at work and it is almost certainly the presense of persistent carbon dioxide that is mostly responsible for this warming effect, their entire position is based on denying this.
Deniers simply do not weight their position based on the varying confidence in the data. They are 100% certain that by vastly increasing carbon dioxide in the atmosphere there will be no major warming event. And in fact whenever possible they default to a global cooling scenario to frighten people into believing in the threat of rapidly advancing ice sheets from the next ice age.
As for the catastrophic impacts of global warming and climate change, when exactly do we declare it an emergency. The entire biosphere is now in a state of risk, we are now in the position where it isn't individual species that are at threat but the entire biological systems of the planet.
Most life on Earth is in the oceans and they are in rapid transition to often a much more hostile state to the life there. About 25% of marine life spends part or all its life on coral reefs. As we saw with the recent coral bleaching over a massive area in the Great Barrier reef system this transition to what is effect a dead state can happen very rapidly. It took two years for half of one of the most extensive and diverse ecosystems on Earth to die.
We are not going to see a rapidly recovery of any coral reef system on Earth, almost all are going to be lost in the coming years as an incredible amount of heat is added to the Earth - mostly the oceans - constantly. Skeptical Science has a meter to display just that. The loss of marine coral reef systems globally can be considered a significant extinction event on it own. That will include most of the 1 to 9 million species that depend on coral reefs.
But it is just one such factor. As I said we also have to look at the rapid and virtually uncontrolled removal of many marine species at clearly unsustainable rates. How will the oceans even function with such rapid and destructive changes. The source of most free molecular oxygen on Earth.
Terrestrially we are looking at about 40% of insect species in rapid decline and the overall biomass of insects decreasing at about 2.3% a year. The basis of much of the food chain and biological communities on land is in rapid decline.
About 40% of avian species are also in decline.
I don't believe in unsupported alarmism, I do think that if the evidence is as stark as it seems then we are looking at a rapidly approaching point where the overall integrity of ecosystems on a global scale will start to fail.
At which point there will simply be nothing we can do except watch a very rapid and almost certain cascade effect into a world that will not support much of the life now on Earth. And certainly not a species as large as ours with such high metabolic requirements.
The oxygen question alone is stark. Not only are the oceans in a decline to a very unstable situation, but we are rapidly removing the secondary centers of oxygen production the rain forests. Under the current government in Brazil deforestation has doubled in pace. The rain forests of the SE Pacific region are being logged and in many cases converted to palm oil and other plantations on a vast scale.
All these factors stress the entire biosphere and global climate change ties it all together into a formula for catastrophic failure that the data indicates has already begun.
- There is no consensus
Rob Honeycutt at 09:21 AM on 10 August, 2019cstrouss...
"That the AGW hypothesis is true and it will have increasing implications on global weather patterns? Or that there it is a catastrophic situation and human must immediately and completely restructure our social and economic systems if the species is to survive?
Why is this an either/or question? Can they not both be true?
Think of climate change impacts as a sliding scale that vary based on our total emissions. Within a reasonable range of uncertainty, probably the best understood elements of AGW are the basics of radiative forcing and the response in global mean temperature. The concensus is that we'll likely see about 2.8°C of warming for each doubling of CO2 over preindustrial levels. I think almost every scientist working in the field would agree with that statement.
We also know for certain, the more we push the system, the more damage we're ultimately going to see. Again, that's not a controversial statement for scientists.
What you're doing, though, is running off into hyperbole. I don't think many scientists would agree that we must "...immediately and completely restructure our social and economic systems if the species is to survive." Our species is likely to survive whatever happens. We're extraordinarily adaptable. But, most of the natural world that we rely on to sustain 7+ billion people on the planet is not nearly as adaptable as we are.
Therein lay the problem. Yes, if we continue to burn everything we can get dig out of the earth, most scientists will likely agree that would probably mean a total collapse of modern civilization. Lots of death, destruction and suffering.
Can we avoid that? Yes, of course. We are going to see significant challenges and costs due to our emissions so far. We are already seeing very good signs of progress with the cost of wind and solar continuing to fall. But there are so many more challenges we're going to see.
Nothing I'm saying here is controversial, and I believe this would all fall within the definition of the "scientific consensus on AGW."
Here's what should give you the most concern about all this: thermal inertia.
I hope you agree that we are now seeing many of the impacts of climate change starting to emerge. Melting ice sheets, extreme weather events, heat waves, etc. Now, consider that there is a 30 year lag in the climate system since most of the heat goes into the world's oceans. That heat takes time to come into equilibrium with the land, ice and atmosphere. Thus the impacts we're seeing today are the result of where CO2 levels were some 30 years ago.
If we were to stop all carbon emissions tomorrow the planet would continue to warm through the middle of this century. If we're seeing impacts already you can bet your bottom dollar they're going to start getting a lot worse over the coming three decades. Best case scenario says we'll be able to bring emissions to zero by ~2050. That means continued warming through 2080 at a minimum.
Also consider that, in the past at 450ppmv CO2 levels, there were no ice sheets on this planet. The planet was too warm to sustain them. It'll take another 1000 years to melt them entirely, but we're talking about sea levels rising to up to 70m over the coming centuries. That's a completely different planet than we currently live on. No Florida at all. It's gone. LA, SF, NYC, Tokyo, and 100's of other cities. All under water.
It's not the end of our species but replacing entire cities ain't gonna be cheap. The better investment is to reduce our carbon emissions as quickly as we can and keep CO2 levels as low as we possibly can. That's an enormous task. It's one that needs to happen fast.
Again, none of this is controversial. Gore, DiCaprio and Thunberg are not scientists but they are doing their level best to help convey to the world what is overwhelmingly agreed in the scientific community.
- Water vapor is the most powerful greenhouse gas
michael sweet at 04:53 AM on 3 August, 2019Jiminy Cricket,
You have interesting questions.
Doubling the concentration of Carbon dioxide in the atmosphere would by itself raise global temperatures by about 1C. Additional feedbacks, of which water vapor is one of the biggest, would then kick in to cause about 2C more increase in temperature. The exact amount of the total feedbacks are not well known and the accepted range is a total of 2C-4.5 C (including the 1C from carbon dioxide ). There is a long tail of possiblle larger increases but the 2-4.5C range is reasonably solid. I will call it 3C for this discussion. We all hope it is not more than 3C per doubling.
After the 3C increase per doubling the temperature stabilizes. Scientists agree that the feedbacks will not continue forever in a runaway temperature increase. Some feedbacks, like melting of ice sheets, take a long time to reach equilibrium. On the other hand, the climate changes we see with just 1C of temperature increase, like last weeks heat wave in Europe and California fires, are greater than expected. Scientists agree that we should keep warming as low as possible.
Industrial extraction of water from the atmmosphere is really not pratical. So much water evaporates from the ocean and the land every day that it would be impossible to extract enough water vapor to affect the atmospheric concentration significantly. Work is being done on ways to extract CO2 which is a gigantic task but smaller than extracting water.
Your reference talks about extracting water from the atmosphere for drinking in areas where water is very short like in the Sahel in Africa. This water extraction would be too small to affect the concentration of water in the atmosphere but very valuable to people who live in areas with little drinking water.
- Antarctica is gaining ice
John Hartz at 02:15 AM on 22 July, 2019Recommended supplemental reading:
‘Extraordinary thinning’ of ice sheets revealed deep inside Antarctica by Damian Carrington, Environment, Guardian, May 16, 2019
Antarctic instability 'is spreading' by Jonathan Amos, Science & Environment, BBC News, May 16, 2019
Precipitous' fall in Antarctic sea ice since 2014 revealed by Damian Carrington, Environment, Guardian, July 1, 2019
Glacial melting in Antarctica may become irreversible by Adam Morton, Environment, Guardian, July 9, 2019
- Is Nuclear Energy the Answer?
barry17781 at 04:35 AM on 16 June, 2019Jut thought that I would include some real references,
Here we have the plans for a 2 reactor power station and the area can be scales from the map, or by comparisom with the British OS maps (sheet 114)
https://www.ordnancesurvey.co.uk/ about 4 km^2 now Abbotts figure was 20 km^2 per reactor. This real case is at a tenth of that.
If you notice the village Cemaes goes right up to the boundrary
- Climate's changed before
MA Rodger at 21:15 PM on 13 June, 2019jesscars @739,
The variation of CO2 levels in very ancient times generally resulted from a balance between the amount of carbon being drawn down into the geology by rock-forming and the amount of carbon being ejected by volcanoes. Periods of mountain-building have an impact on that balance, as do periods of extreme volcanism. The results of modelling of very ancient CO2 levels (using GEOCARB III) have been pretty-much supported by the geological evidence.
The mechanisms that are at work at a more detailed level can be much more complex. Thus the last de-glaciation saw a rise in CO2 levels but that was the product of many different mechanisms, many of which didn't actually work to increase CO2 levels. Thus warming oceans increase CO2 levels but the significant increase in ocean volume as the ice melts into the oceans decreases it. Peat exposed to clmate change releases CO2 while increased bio-activity buries it. (See Ganopolski & Brovkin (2017) for a study of these mechanisms.)
You also ask specifically about the ice-age cycles. These have been the major feature of global climate for the last 3 million years and until about 1 million years ago they occurred every 40,000 years but now occur every 100,000 years. It is probably best to see ice-ages as being caused by the unstable nature of the full glacial climate. When triggered by the Milankovitch cycles heating the high northern latitudes, an interglacial will result from northern ice sheets melting out. Thus today, if the melt on Greenland were to become enough to drop the summit significantly (a likely event if AGW reached +1.5ºC for a few centuries), the lowered icy-cold top would warm enough to allow more melting and lower it further. Building it back up with new snowfall is a far slower process, so without the return of an ice-age, once ice sheets like the Greenland one begin to go, they go all the way.
The reason for the change from 40ky to 100ky ice-age timing is not truly understood. The trigger is the Milancovitch cycle, the 40ky from the tilt in axis & the 100ky from a component of the eccentricity variation. One theory is that dust (which increases the sunlight absorbed by ice) was greater in past 40yr ice-ages but now the soils that created that level of dust have been scoured away leaving un-dusty bedrock.
- Climate's changed before
MA Rodger at 20:02 PM on 13 June, 2019TVC15 @740,
If it is Jim Hansen, we can track down where he stands on this runaway matter. He said in his book 'Storms of My Grandchildren':-
“After the ice has gone, would the Earth proceed to the Venus syndrome, a runaway greenhouse effect that would destroy all life on the planet, perhaps permanently? While that is difficult to say based on present information, I’ve come to conclude that if we burn all reserves of oil, gas, and coal, there is a substantial chance we will initiate the runaway greenhouse. If we also burn the tar sands and tar shale, I believe the Venus syndrome is a dead certainty”
This paragraph (I see from Google Books) is a bit of a throw-away at the end of Chapter 10 following a discussion of a boost to AGW from methane hydrates:-
"If we burn all the fossil fuels, the ice sheets almost surely will melt entirely, ... Methane hydrates are likely to be more extensive and vulnerable now than they were in the early Cenozoic. It is difficult to imagine how the methane hydrates could survive, once the ocean has ahd time to warm. In that event a PTEM-like warming could be added on top of the fossil fuel warming."And later, in a Columbia Uni blog page, Hansen explains that he is talking of two things - ☻ The Venus Syndrome runaway (as per the top quote) and ☻ A "mini-runaway" or hyperthermal (as per the lower quote).The mini-runaway he decribes as occuring on a millennial scale and which, if we were foolish enough to initiate such an event, could be countered by sequestrating the GHG releases, although there would be a lot to sequester.The Venus Syndrome runaway he describes as possibly following on from an un-countered mini-runaway but he ends saying that "Venus-like conditions in the sense of 90 bar surface pressure and surface temperature of several hundred degrees are only plausible on billion-year time scales."So this leads to an answer to the question posed by your denialist trolls - Why would 1,200ppm CO2 (Hansen talks of 1,000ppm to 2,000ppm) lead to the Venus Syndrome when in the past it did not?Hansen is saying that the 'early Cenozoic' (so before 20 million yr bp) had less methane hydrate which could potentially boost temperatures enough to overwhelm the tropopause and thus allow the leakage of the planet's hydrogen into space, a road that would lead to a Venus-style climate. But importantly, this is on top of AGW. Back in the PETM (44my bp) the fossil fuels were safely tucked away within the geology greatly limiting the potential warming.As for previous CO2 levels, there was periods in the past when the fossil fuels of today were still yet to be buried out of harms way & thus CO2 was far higher than 1,200ppm. But that was a long time ago when the sun was a lot fainter and the combined forcing (see this SkS page) would thus be lower than potentially from a mini-runaway today. - Climate's changed before
MA Rodger at 23:27 PM on 10 June, 2019TVC15 @730,
I wrote @729 "climate can change rapidly without humans emitting CO2" but added that this "does require millions of cubic kilometres of strategically-placed ice that would be difficult to miss". I was thinking a little more broadly than suggested by Eclectic @731. In very simple terms, rapid bits of climate change results from obvious causes.
A big volcano (like Mt Toba c73ky bp) or an asteroid strike fall into that category but the climate quickly reverts back afterwards. Big ice sheets can cause rapid change which lasts far longer. I had in mind two different ice-induced phenomenon, a big one and a rapid one although properly I was only thinking of the "rapid" one.
By the "big" one, I mean the ice-age cycle itself which swings global average temperatures by perhaps 6ºC but takes millennia to achieve this (not very rapid) as it requires the melting of millions of cubic kilometres of ice (43 million in the last deglaciation). The major factor in the swing is the change in albedo due to the growing/shrinking ice sheets. CO2 as a factor is smaller, and the result of what Ganopolski1 & Brovki (2017) [PDF] call a complex "stew" of many mechanisms which don't all work to increase the ice-age effect.
So for ice-age cycles to happen, we do require tens-of-milions of cu kms of ice to melt/freeze on top of the correct bits of land.Significant & "rapid" climate change (at least on a regional scale) can be seen in the Younger Dryas and in Dansgaard–Oeschger events. While there is some remaining cotroversy with the Younger Dryas (so let's not go there), it appears reasonably uncontested that the Dansgaard–Oeschger events result from the AMOC suddenly switching back on having been previously slowly strangled by big unstable ice sheets melting/discharging icebergs. The AMOC-forced-by the ice melt/discharge switching on & off messes up regional climate and produce the big and rapid changes in regional temperature, Greenland ice cores recording a number of regional swings of +5°C in less than half a century. (Note that wIth polar amplification, you'd expect "humans emitting CO2" under BAU to manage a similar-sized swing.) But when the ice-age melts away & "without humans emitting CO2", there is little ice to mess with the AMOC during the less-dramatic Bond events which have little impact on even local temperature.
- Deep sea carbon reservoirs once superheated the Earth – could it happen again?
william5331 at 06:30 AM on 23 May, 2019There is an additional possibility. As mentioned, both Carbon dioxide and Methane form clathrates and their formation depends on both temperature and pressure. For instance, a methane clathrate can form up to about 25 degrees C with sufficient pressure and a liter of fully saturated methane clathrate can hold over 150 liters of methane (measured at STP).
Picture a one to three mile thick contenental ice sheet forming over land that contains deeper deposits of shale, coal and liquid hydrocarbons. The weight of the ice deforms the crust of the earth and probably opens up cracks with the uneven loading as the ice sheet begins to flow into new areas. Even without such loading, many such deposits vent some CH4 and CO2 all the time.
At the bottom of deep ice sheets the temperature is around zero degrees C and there is liquid H2O. As methane and/or CO2 vents into this water at the pressures at the bottom of a one to 3km ice sheet it would form Clathrates. Without an ice sheet, these gasses would be absorbed into the biosphere but now they are stored up until the ice sheet melts and the pressure released at which time they will suddenly come out into the atmosphere, accelerating the warming of the atmosphere and hence melting more ice, releasing more gas.
We need a close look at what is at the bottom of our remaining ice sheets on Greenland and Antarctica. This could be the sleeping giant.
- Greenland is gaining ice
Daniel Bailey at 02:35 AM on 26 March, 2019Just because you cherry-pick different dates to suit your purpose does not invalidate the statement:
"Data from NASA's GRACE satellites show that the land ice sheets in both Antarctica (upper chart) and Greenland (lower) have been losing mass since 2002. Both ice sheets have seen an acceleration of ice mass loss since 2009."
- CO2 lags temperature
Postkey at 20:10 PM on 20 March, 2019“Tectonics in the tropics trigger Earth’s ice ages, study finds
Major tectonic collisions near the equator have caused three ice ages in the last 540 million years. . . .
Over the last 540 million years, the Earth has weathered three major ice ages — periods during which global temperatures plummeted, producing extensive ice sheets and glaciers that have stretched beyond the polar caps.
Now scientists at MIT, the University of California at Santa Barbara, and the University of California at Berkeley have identified the likely trigger for these ice ages.
In a study published today in Science, the team reports that each of the last three major ice ages were preceded by tropical “arc-continent collisions” — tectonic pileups that occurred near the Earth’s equator, in which oceanic plates rode up over continental plates, exposing tens of thousands of kilometers of oceanic rock to a tropical environment.”
http://news.mit.edu/2019/tectonics-tropics-trigger-ice-ages-0314 - Greenland is gaining ice
Daniel Bailey at 09:56 AM on 14 March, 2019Surface melt and snowfall mass balance are not the sum of the total mass balance equation by far. Because calving and discharge from the margins are not factored into that.
Per ther DMI:
And
Which brings it into good agreement with NASA:
"Data from NASA's GRACE satellites show that the land ice sheets in both Antarctica (upper chart) and Greenland (lower) have been losing mass since 2002. Both ice sheets have seen an acceleration of ice mass loss since 2009. (Source: GRACE satellite data)
Please note that the most recent data are from June 2017, when the GRACE mission concluded science operations. Users can expect new data from GRACE’s successor mission, GRACE Follow-On, in the summer of 2019."

- Studies shed new light on Antarctica’s future contribution to sea level rise
Riduna at 10:53 AM on 20 February, 2019A problem facing climate scientists is that they do not know the speed with which the polar ice sheets are likely to respond to environment changes, particularly changes in temperature.
What they can do is look at paleoclimate evidence which shows that mean global temperature is now within a few tenths of a degree of the Eemian maximum, when sea level was 6-9 meters higher than at present.
What they can do is look at ice core evidence which shows that present atmospheric levels of CO2 (407 ppm) and CH4 (1870 ppb) are 40% and 270% above those which prevailed during the Eemian maximum.
They can bear in mind other observed factors such as the effects of soot deposited on the Greenland ice sheet, accelerating loss of ice mass from polar and other glaciers and ongoing rise in energy absorbed by the oceans.
Having done so, can they confidently predict that sea level rise during the 21st century will be measured in centimetres?
- The Methane 'Time Bomb': How big a concern?
Doug_C at 06:29 AM on 31 January, 2019Evan @7
Unfortunatley we are now in a position of triage having to decide what we can save and what resources we have to do so.
The loss of coral reef systems alone is going to have a profound effect on how life in the oceans behave. One quarter of marine species are dependent on coral reefs for some or all of their lifecycle. The oceans are the main lungs of the planet and home to most life here.
The loss of glaciers is going to also have major impacts on us and the ecosystems around us in many places. I'm from British Columbia and have been familiar with glaciers all my life and the rivers and lakes they feed. It's really sobering to think of a BC... and many other places... with little or no glaciers.
As a kid in the early 1970s I remember a family trip through Glacier national park on the Canada-US border and the many glaciers that gave the park its name. Most are now gone in a pattern repeated globally.
The polar ice sheets have already lost their stability and are losing ice at an incredible rate, far faster than models that treat them as solid blocks melting from the outside predicted.
And it goes on an on, we have upset a fundamental balance that determines one of the most important factors on Earth, how warm it is on the planet's surface. And it is still treated as a relatively minor issue by far too many people, many of them in positions that need to take responsible action, not keep promoting the same activities that have brought us here.
I also have family who work in the oil industry in Alberta and I get how important it is to people there. But it is incredibly frustrating to try to explain to people how what they are doing right now to meet their immediate needs is going to make it very difficult to impossible for them and their kids to meet those needs in just a few decades. With major emergencies along the way like the record flooding in southern Alberta in 2013 and the massive wildfires that burned down Fort McMurray in 2016.
There are real actions and solutions to this growing catastrophe but they require a willingness to change. Sadly something that is still lakcing in many people, who are somehow able to ignore the fact that the Earth is already changing now for the worst.
Real change to a low carbon sustainable energy and economic model has so many benefits that it no longer makes any sense at all to talk about fossil fuels as anything else but a disaster on a scale that makes CFCs, DDT and many other human created ecological and social problems minor in comparison.
- Sea level is not rising
Daniel Bailey at 09:30 AM on 13 January, 2019"I find it difficult to imagine that any amount of erosion is causing a displacement effect"
You are indeed correct in that skepticism, as the contribution of river sediment delivered to the oceans is about 20 billion tons / year. This sums to about 6 km^3 / yr or ~0.017 mm / yr of sea level rise equivalent (which is about ~1/200 of the current rise rate).
So if the oceans are not rising significantly due to these natural displacement factors, why is it rising? What then are the actual measured major contributors to sea level rise?
Let’s look first at what current SLR levels are: 3.2 mm/year.
Let’s think about what that 3.2 mm/year actually represents, in terms of water volume: 1,184 cubic kilometers per year!
This means that every 5 years, the oceans are rising by the equivalent volume of twelve Lake Erie’s (484 cubic kilometers)! And over a 10-year period, the oceans will rise by a volume almost equivalent to that of Lake Superior! Wow! And that’s just at current rates of SLR!
So where are the various contributions to measured SLR coming from? Let’s look at that.
"Ocean thermal expansion, glaciers, Greenland and Antarctica contribute by 42%, 21%, 15% and 8% to the global mean sea level over the 1993-present. We also study the sea level budget over 2005-present, using GRACE-based ocean mass estimates instead of sum of individual mass components. Results show closure of the sea level budget within 0.3 mm/yr. Substantial uncertainty remains for the land water storage component, as shown in examining individual mass contributions to sea level."
https://www.earth-syst-sci-data-discuss.net/essd-2018-53/
https://www.nature.com/articles/s41586-018-0179-y
https://www.the-cryosphere.net/12/521/2018/
http://iopscience.iop.org/article/10.1088/1748-9326/aac2f0/meta
https://agupubs.onlinelibrary.wiley.com/doi/abs/10.1002/2017GL074070
http://www.pnas.org/content/114/23/5946.abstract
https://www.the-cryosphere.net/11/1111/2017/
https://link.springer.com/chapter/10.1007/978-3-319-56490-6_5
http://advances.sciencemag.org/content/2/9/e1600931.short
https://agupubs.onlinelibrary.wiley.com/doi/10.1002/2015JF003550Unfortunately, due to the measured increases in ice sheet mass losses coming from Antarctica (which have tripled since 2012 alone), the rates of SLR are themselves accelerating:
"Global sea level rise is not cruising along at a steady 3 mm per year, it's accelerating a little every year, like a driver merging onto a highway, according to a powerful new assessment led by CIRES Fellow Steve Nerem. He and his colleagues harnessed 25 years of satellite data to calculate that the rate is increasing by about 0.08 mm/year every year—which could mean an annual rate of sea level rise of 10 mm/year, or even more, by 2100."
"This acceleration, driven mainly by accelerated melting in Greenland and Antarctica, has the potential to double the total sea level rise by 2100 as compared to projections that assume a constant rate—to more than 60 cm instead of about 30." said Nerem, who is also a professor of Aerospace Engineering Sciences at the University of Colorado Boulder. "And this is almost certainly a conservative estimate," he added. "Our extrapolation assumes that sea level continues to change in the future as it has over the last 25 years. Given the large changes we are seeing in the ice sheets today, that's not likely."
Per Nerem et al 2018:
"the observed acceleration will more than double the amount of sea-level rise by 2100 compared with the current rate of sea-level rise continuing unchanged. This projection of future sea-level rise is based only on the satellite-observed changes over the last 25 y, assuming that sea level changes similarly in the future. If sea level begins changing more rapidly, for example due to rapid changes in ice sheet dynamics, then this simple extrapolation will likely represent a conservative lower bound on future sea-level change."
http://www.pnas.org/content/early/2018/02/06/1717312115
Sea level rise components, from Cazenave et al 2018:


- 2019 SkS Weekly Climate Change & Global Warming News Roundup #1
nigelj at 17:53 PM on 11 January, 2019Riduna, I think multi metre sea level rise this century is possible, but somewhat unlikely, because it would require more than just melting ice, it would require physical destabilisation and destruction of ice sheets which requires strong local warming right around the antarctic and greenland oceans, considerably more than presently, and all over the next couple of decades surely. How would that happen? Seems unlikely to me by 2100, but very possible by 2200 as warming accelerates, if we do nothing.
I'm not minimising the problem, just thinking how would it happen? It is pretty much just as bad if its by 2200 anyway. Hell, 1 metre is very serious. I think its important to talk about dangerous but realistic, evidence based defensible scenarios or the public will dismiss climate science as inflated scaremongering.
- 2019 SkS Weekly Climate Change & Global Warming News Roundup #1
Riduna at 15:34 PM on 11 January, 2019It is wishful thinking to assume that multi metre sea level rise will not occur this century and equally unrealistic to believe that if only 10% of a city is inundated by sea level rise (SLR), the rest of it will remain habitable. Further, the only thing which can be inferred from Pulse 1A is that SLR of ~5m/y can be sustained for centuries by rapid melting of an ice sheet.
There is growing evidence that ocean surface (0 – 6,000m) heat absorption has been significantly underestimated. The most likely effects of ocean temperature rise are thermal expansion of seawater and more rapid degradation of Antarctic and Greenlandcvoastal ice reasting on the seabe. Both will result in more rapid SLR and increased instability of the ice sheets, potentially leading to further SLR acceleration.
If the inundated 10% of a city (why only 10%?) contains major infrastructure (port facilities) and industrial facilities (factories) the other 90% may be habitable but offer little or no employment to the inhabitants. Moreover, adjacent coastal flooding may destroy transport infrastructure making it impossible to produce goods and services or support inhabitants with goods produced elsewhere.
Even with SLR of only 2m., it should be expected that an effective SLR of >4m. could be created by storm surges – and it should be expected that with rising sea surface temperature and atmospheric moisture, the severity and incidence of storms will increase significantly, as will the destruction they cause. It is also likely that flooding of coastal lands this century is no longer avoidable.
Retreat may be possible. Clinging on is not.
- 2019 SkS Weekly Climate Change & Global Warming News Roundup #1
nigelj at 04:47 AM on 11 January, 2019Lachlan @16, you are possibly right about the title. But the first half of the article dealt with the findings that the terrifying prediction was unlikely this century, and we only found out it was merely postponed half way down the article. Many people only read titles or the first couple of paragraphs of articles. A summary would have helped.
Evan @17
I think there is something in your theory of a pulse and a long tail. It looks like it could happen. If we knew that the period of multi metre sea level rise was confined to for example 2200 - 2500 we could plan for this and build behind the danger zone. Then adapting to a long tail at perhaps 1 metre per century would be feasible, although ugly. The trouble is can we be sure rapid sea level rise would be confined to a specific time period? Im not sure enough is known about how ice sheets will respond. Nevertheless, if a pulse was to eventuate we would be very motivated to find out.
- 2019 SkS Weekly Climate Change & Global Warming News Roundup #1
nigelj at 05:02 AM on 7 January, 2019Evan @5, as far as I can figure out The IPCC currently predict 1 metre of sea level rise per century (worst case scenario) spread out over many centuries and based on medium to high climate sensitivity. If we burn all fossil fuels we are talking 30 metres plus of sea level rise but over a lengthy period.
But some of us think they are being too conservative and that it could be more than 1 metre per century at least for a period of time. Maybe not by 2100 but soon after this
Anyway I would think 2 metres per century for maybe 5 centuries for example 'would' fall into the categorisation of a quick pulse! And it would be devastating for infrastructure.
I was simply trying to get a handle on what has happened in the past known with some certainty, and that is 2 metres per century as far as I can tell.
However I would definitely agree we cannot rule out more than 2 metres. J Hansen has written a paper somewhere finding that 5 metres per century is possible based on physics and modelling, but many worst case factors have to coincide for this to happen.
I do not know nearly enough physics really, but I know warming is looking like a quadratic curve, so you would expect melting of ice and expansion of sea water to follow this, and this suggests about 1 metre of sea level rise per century over many centuries. However the wild card is ice sheet destabilisation, where glaciers speed up, or the face of ice sheets starts to collapse. This looks like it would cause a step change in a quadratic curve. Glaciers would however come up against limiting facor of friction. The article suggests the face of ice sheets could collapse rapidly from undercutting and the possibility of 4 metres per century for a couple of centuries at least perhaps until things reach a new equilibrium.
2 metres per century. 4 metres per century. All bad.
- 2019 SkS Weekly Climate Change & Global Warming News Roundup #1
nigelj at 10:37 AM on 6 January, 2019Evan @3
I agree melwater pulse 1a is associated with 5 metres per century, but read the wikipedia article. Only half this is at most is attributed to destabilisation of the antarctic, the remainder to the melting of ice sheets over north america which do not exist anymore, so my conclusion is a destabilising antarctic as discussed in the article above would perhaps cause 2 metres of sea level rise per century. Which would be catastrophic.
- Global warming ‘hiatus’ is the climate change myth that refuses to die
Doug_C at 20:09 PM on 1 January, 2019Sunspot @42
The internet has been around for decades and was used by academics long before it went universal in the early 1990s with the introduction of the WWW.
Internet History Timeline: ARPANET to the World Wide Web
When it comes to science there are guidelines that date back centuries and allow an exchange of empirical evidence and agreed means to test it and place it in a meaningful context. You seem to be creating obstacles where none really exist.
The line is clear, if you lack the data and what you have doesn't fit in with already very well established theories then the burden of proof is on your shoulders, not someone else's. That's what scientific skepticism means, an open mind in an informed context always testing new data in the context of what we have already assimilated into the overall body of evidence.
The is no "problem" with the science of fossil fuels forced global warming and associated climate change. We don't need to understand how humans feel about it and what their beliefs are to understand the physical dimnersions of global warming. We just need data and a consistent structure to place it in.
And we have that going back centuries all consistent with the theory of global warming and the real world evidence we are seeing as it unfolds.
In your last paragraph you are entering into almost entirely hypothesis not theory. Geostatic rebound takes place over thousands of years, North America is still in the process of rebound from the melting of the massive ice sheets over 10,000 years ago.
There are other much more immediate concerns with global warming and climate change and it is important to place all these factors into a context based on the best evidence in the clearest context.
Which is why it is essential to leave politics and religion out of this discussion. These are based far more on internal subjective reality than objective testable data.
More than 100 comments found. Only the most recent 100 have been displayed.
More than 100 comments found. Only the most recent 100 have been displayed.


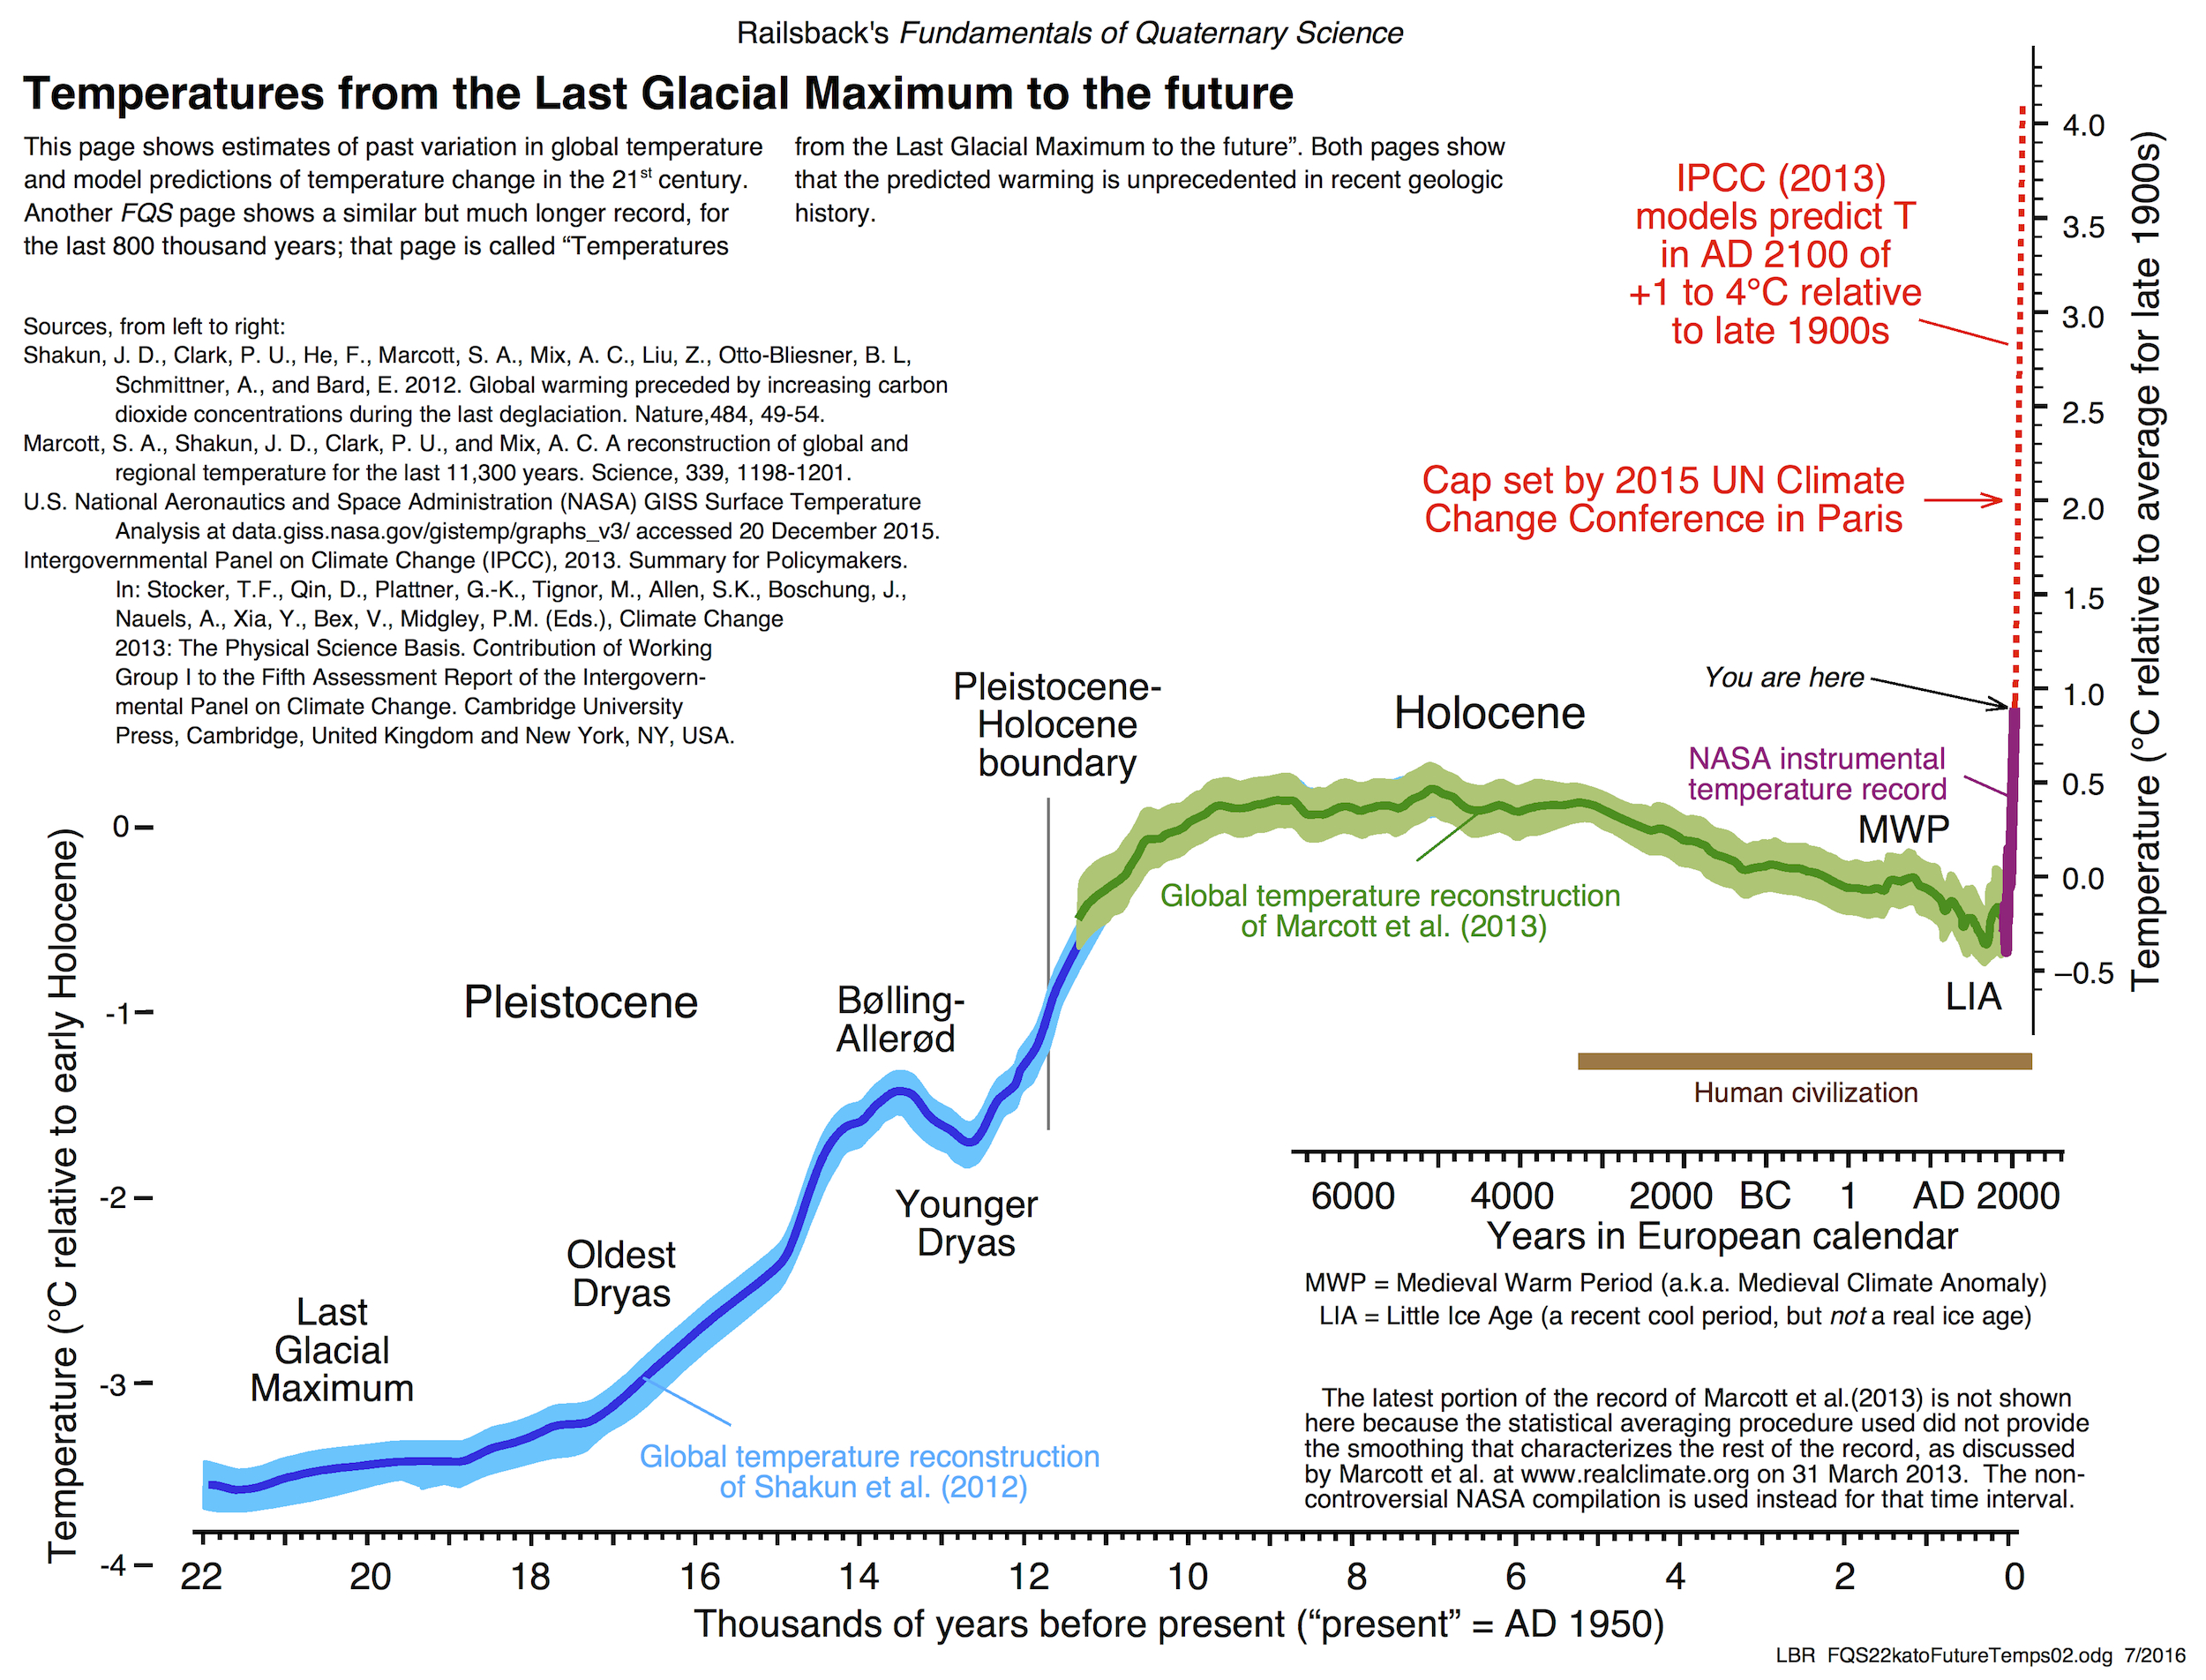
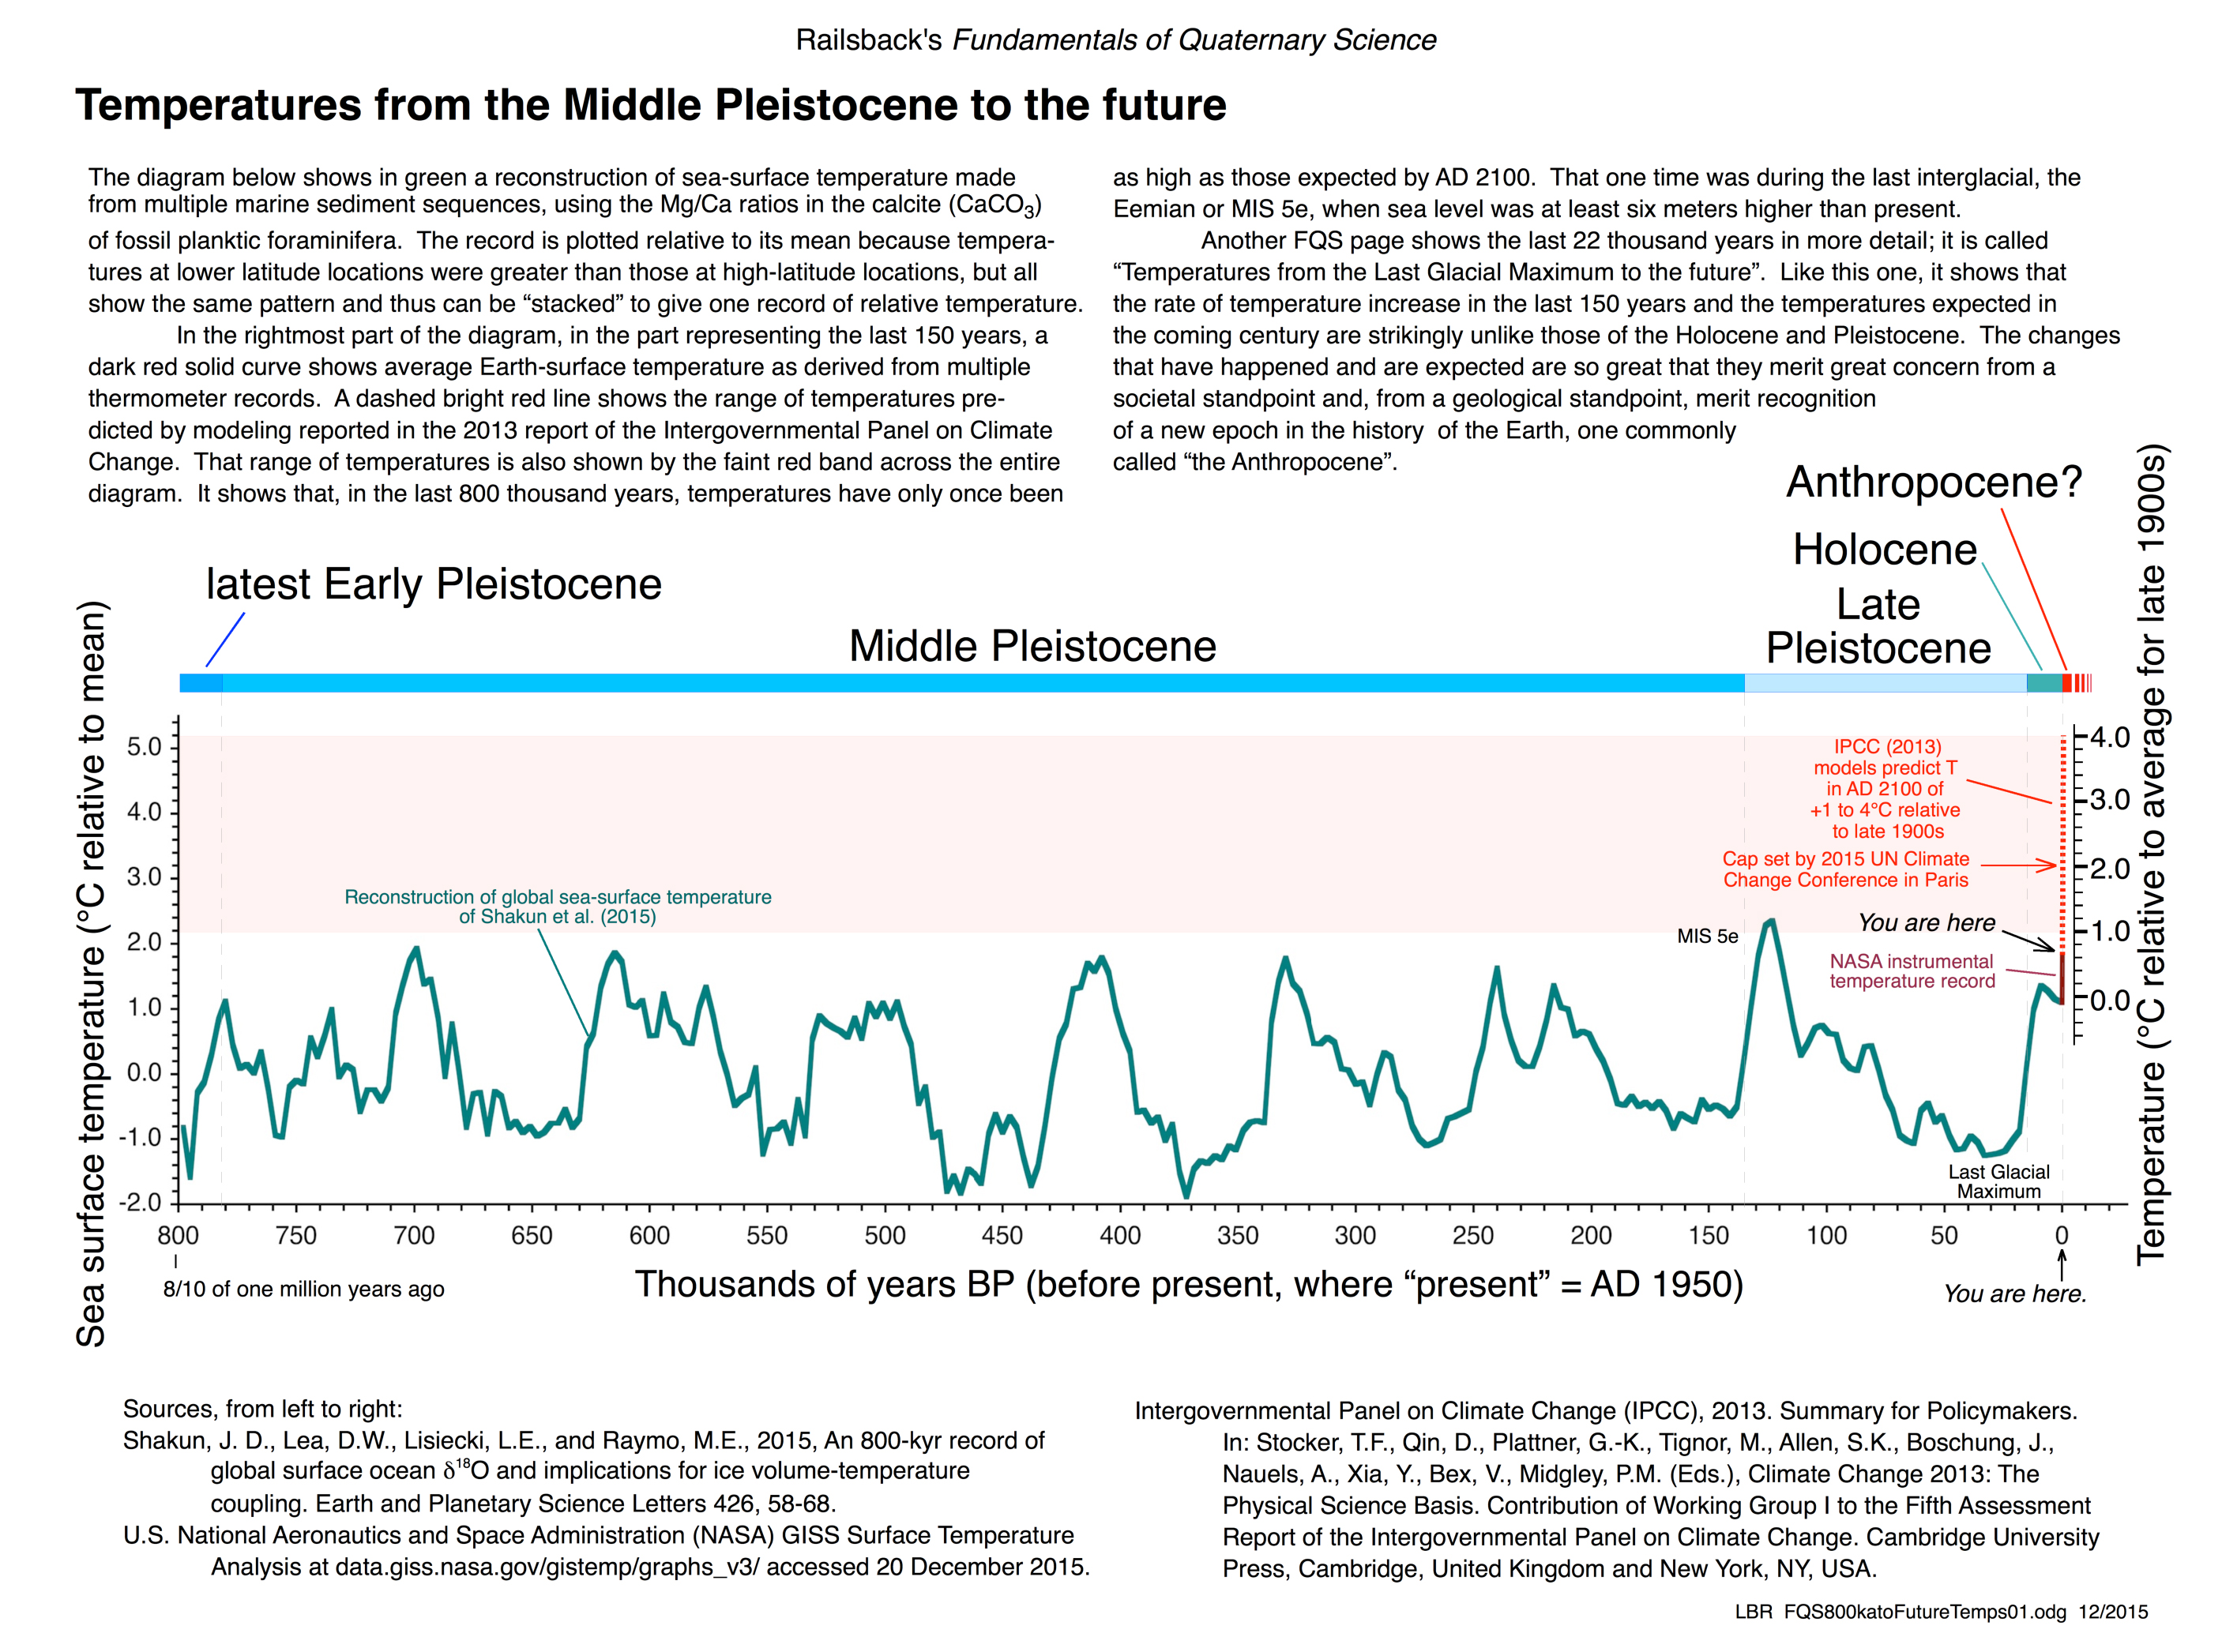
THE ESCALATOR

(free to republish)