Climate Science Glossary

Term Lookup

Enter a term in the search box to find its definition.

Settings

Use the controls in the far right panel to increase or decrease the number of terms automatically displayed (or to completely turn that feature off).

Term Lookup

Settings


All IPCC definitions taken from Climate Change 2007: The Physical Science Basis. Working Group I Contribution to the Fourth Assessment Report of the Intergovernmental Panel on Climate Change, Annex I, Glossary, pp. 941-954. Cambridge University Press.

Home Arguments Software Resources Comments The Consensus Project Translations About Support

Bluesky Facebook LinkedIn Mastodon MeWe

Twitter YouTube RSS Posts RSS Comments Email Subscribe


Climate's changed before
It's the sun
It's not bad
There is no consensus
It's cooling
Models are unreliable
Temp record is unreliable
Animals and plants can adapt
It hasn't warmed since 1998
Antarctica is gaining ice
View All Arguments...


Username
Password
New? Register here
Forgot your password?

Latest Posts

Archives

Sun & climate: moving in opposite directions

What the science says...

Select a level... Basic Intermediate Advanced

The sun's energy has decreased since the 1980s but the Earth keeps warming faster than before.

Climate Myth...

It's the sun

"Over the past few hundred years, there has been a steady increase in the numbers of sunspots, at the time when the Earth has been getting warmer. The data suggests solar activity is influencing the global climate causing the world to get warmer." (BBC)

At a glance

Thankfully for us, our Sun is a very average kind of star. That means it behaves stably over billions of years, steadily consuming its hydrogen fuel in the nuclear reaction that produces sunshine.

Solar stability, along with the Greenhouse Effect, combine to give our planet a habitable range of surface temperatures. In contrast, less stable stars can vary a lot in their radiation output. That lack of stability can prevent life, as we know it, from evolving on any planets that might orbit such stars.

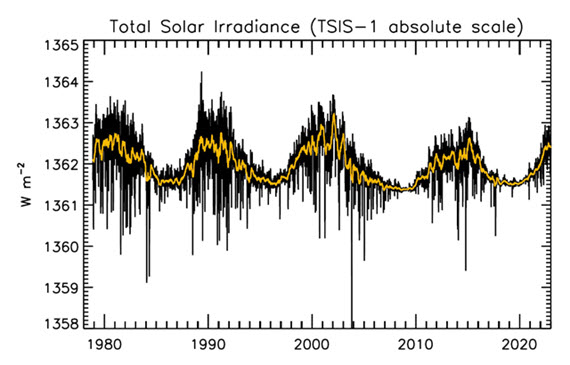
That the Sun is a stable type of star is clearly demonstrated by the amount of Solar energy reaching Earth's average orbital position: it varies very little at all. This quantity, called the Total Solar Irradiance, has been measured for around forty years with high accuracy by sensitive instruments aboard satellites. Its average value is 1,362 watts per square metre. Irradiance fluctuates by about a watt either way, depending on where we are within the 11-year long sunspot cycle. That's a variation of no more than 0.15%.

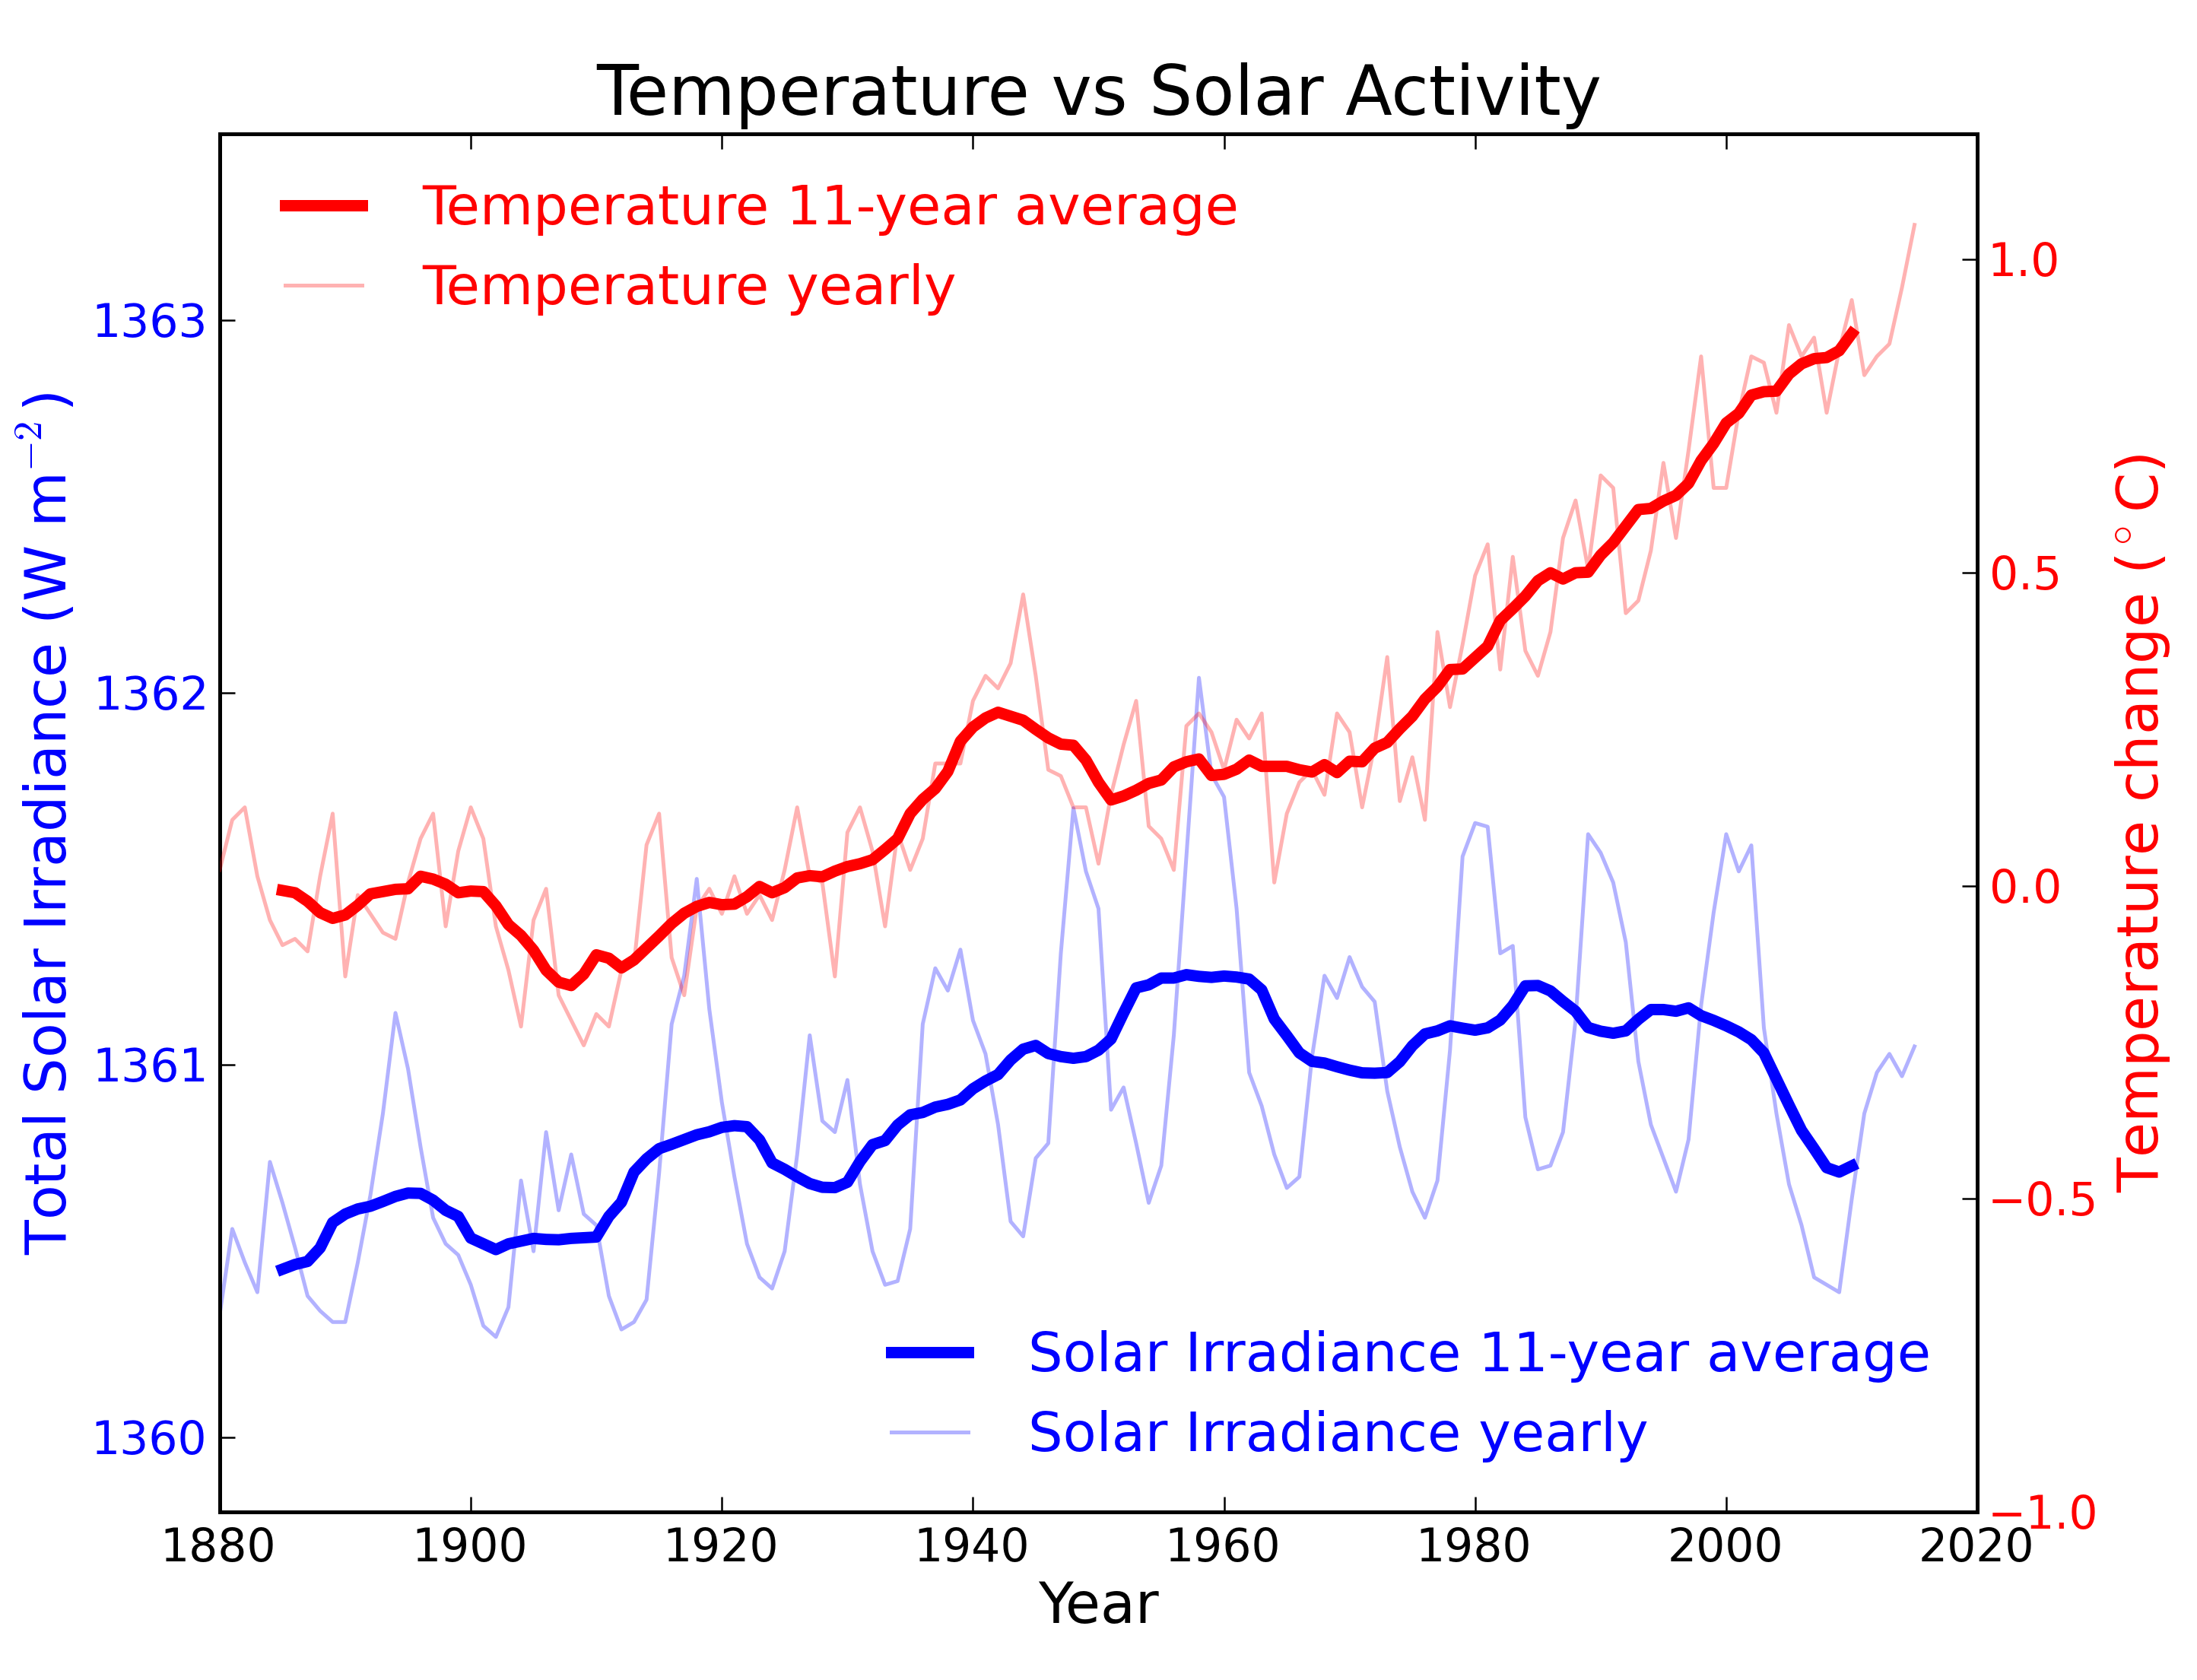
From the early 1970s until today, the Solar radiation reaching the top of Earth's atmosphere has in fact shown a very slight decline. Through that same period, global temperatures have continued to increase. The two data records, incoming Solar energy and global temperature, have diverged. That means they have gone in opposite directions. If incoming Solar energy has decreased while the Earth continues to warm up, the Sun cannot be the control-knob of that warming.

Attempts to blame the sun for the rise in global temperatures have had to involve taking the data but selecting only the time periods that support such an argument. The remaining parts of the information - showing that divergence - have had to be ditched. Proper science study requires that all the available data be considered, not just a part of it. This particular sin is known as “cherry-picking”.

Please use this form to provide feedback about this new "At a glance" section, which was updated on May 27, 2023 to improve its readability. Read a more technical version below or dig deeper via the tabs above!


Further details

Our Sun is an average-sized main sequence star that is steadily using its hydrogen fuel, situated some 150 million kilometres away from Earth. That distance was first determined (with a small error) by a time consuming and complex set of measurements in the late 1700s. It led to the first systemic considerations of Earth's climate by Joseph Fourier in the 1820s. Fourier's number-crunching led him to realise a planet of Earth's size situated that far from the Sun ought to be significantly colder than it was. He was thereby laying the foundation stone for the line of enquiry that led after a few decades to the discovery of what we now call the Greenhouse Effect – and the way that effect changes in intensity as a response to rising or falling levels of the various greenhouse gases.
TSI Solar cycles

Figure 1: Plot of the observational record (1979-2022) on the scale of the TSIS-1 instrument currently flying on the space station. In this plot, the different records are all cross calibrated to the TSIS-1 absolute scale (e.g., the TSIS1-absolute scale is 0.858 W/m^2 higher than the SORCE absolute scale) so the variability of TSI in this plot is considered to be its “true variability” (within cross calibration uncertainties). Image: Judith Lean.

The Sun has a strong magnetic field, but one that is constantly on the move, to the extent that around every 11 years or so, Solar polarity flips: north becomes south, until another 11 years has passed when it flips back again. These Solar Cycles affect what happens at the surface of the Sun, such as the sunspots caused by those magnetic fields. Each cycle starts at Solar Minimum with very few or no sunspots, then rises mid-cycle towards Solar Maximum, where sunspots are numerous, before falling back towards the end. The total radiation emitted by the Sun – total solar irradiance (TSI) is the technical term – essentially defined as the solar flux at the Earth's orbital radius, fluctuates through this 11-year cycle by up to 0.15% between maximum and minimum.

Such short term and small fluctuations in TSI do not have a strong long term influence on Earth's climate: they are not large enough and as it's a cycle, they essentially cancel one another out. Over the longer term, more sustained changes in TSI over centuries are more important. This is why such information is included, along with other natural and human-driven influences, when running climate models, to ask them, “what if?"

An examination of the past 1150 years found temperatures to have closely matched solar activity for much of that time (Usoskin et al. 2005). But also for much of that time, greenhouse gas concentrations hardly varied at all. This led the study to conclude, "...so that at least this most recent warming episode must have another source."
TSI vs. T
Figure 2: Annual global temperature change (thin light red) with 11 year moving average of temperature (thick dark red). Temperature from NASA GISS. Annual Total Solar Irradiance (thin light blue) with 11 year moving average of TSI (thick dark blue). TSI from 1880 to 1978 from Krivova et al. 2007. TSI from 1979 to 2015 from the World Radiation Center (see their PMOD index page for data updates). Plots of the most recent solar irradiance can be found at the Laboratory for Atmospheric and Space Physics LISIRD site.

The slight decline in Solar activity after 1975 was picked up through a number of independent measurements, so is definitely real. Over the last 45 years of global warming, Solar activity and global temperature have therefore been steadily diverging. In fact, an analysis of solar trends concluded that the sun has actually contributed a slight cooling influence into the mix that has driven global temperature through recent decades (Lockwood, 2008), but the massive increase in carbon-based greenhouse gases is the main forcing agent at present.

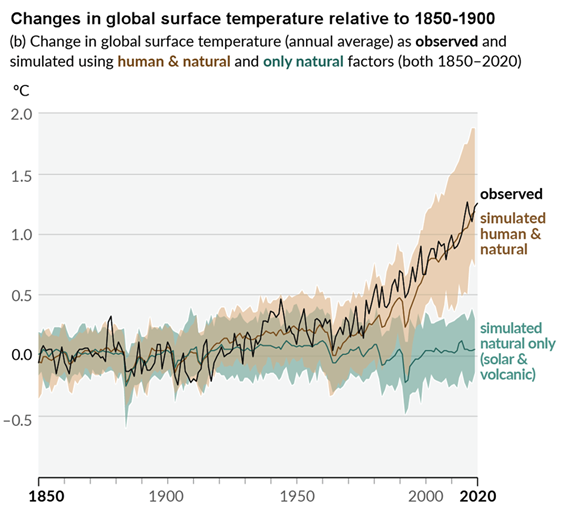
Other studies tend to agree. Foster & Rahmstorf (2011) used multiple linear regression to quantify and remove the effects of the El Niño Southern Oscillation (ENSO) and solar and volcanic activity from the surface and lower troposphere temperature data.  They found that from 1979 to 2010, solar activity had a very slight cooling effect of between -0.014 and -0.023°C per decade, depending on the data set. A more recent graphic, from the IPCC AR6, shows these trends to have continued.

AR6 WGI SPM Figure 1 Panel p

Figure 3: Figure SPM.1 (IPCC AR6 WGI SPM) - History of global temperature change and causes of recent warming panel (b). Changes in global surface temperature over the past 170 years (black line) relative to 1850–1900 and annually averaged, compared to Coupled Model Intercomparison Project Phase 6 (CMIP6) climate model simulations (see Box SPM.1) of the temperature response to both human and natural drivers (brown) and to only natural drivers (solar and volcanic activity, green). For the full image and caption please click here or on the image.

Like Foster & Rahmstorf, Lean & Rind (2008) performed a multiple linear regression on the temperature data, and found that while solar activity can account for about 11% of the global warming from 1889 to 2006, it can only account for 1.6% of the warming from 1955 to 2005, and had a slight cooling effect (-0.004°C per decade) from 1979 to 2005.

Finally, physics does not support the claim that changes in TSI drive current climate change. If that claim had any credence, we would not expect to see the current situation, in which Earth's lower atmosphere is warming strongly whereas the upper atmosphere is cooling. That is exactly the pattern predicted by physics, in our situation where we have overloaded Earth's atmosphere with greenhouse gases. If warming was solely down to the Sun, we would expect the opposite pattern. In fact, the only way to propagate this myth nowadays involves cherry-picking everything prior to 1975 and completely disregarding all the more recent data. That's simply not science.

Longer-term variations in TSI received by Earth

It's also important to mention variations in TSI driven not by Solar energy output but by variations in Earth's orbit, that are of course independent of Solar activity. Such variations, however, take place over very long periods, described by the Milankovitch orbital cycles operating over tens of thousands of years. Those cycles determine the distance between Earth and the Sun at perihelion and aphelion and in addition the tilt the planet's axis of rotation: both affect how much heat-radiation the planet receives at the top of its atmosphere through time. But such fluctuations are nothing like the rapid changes we see in the weather, such as the difference between a sunny day and a cloudy one. The long time-factor ensures that.

Another even more obscure approach used to claim, "it's the sun" was (and probably still is in some quarters) to talk about, "indirect effects". To wit, when studies can't find a sufficiently large direct effect, bring even lesser factors to the fore, such as cosmic rays. Fail.

In conclusion, the recent, post 1975 steep rise in global temperatures are not reflected in TSI changes that have in fact exerted a slight cooling influence. Milankovitch cycles that operate over vastly bigger time-scales simply don't work quickly enough to change climate drastically over a few decades. Instead, the enormous rise in greenhouse gas concentrations over the same period is the primary forcing-agent. The physics predicted what is now being observed.

Last updated on 27 May 2023 by John Mason. View Archives

Printable Version  |  Offline PDF Version  |  Link to this page

Argument Feedback

Please use this form to let us know about suggested updates to this rebuttal.

Related Arguments

Further viewing

Related video from Peter Sinclair's "Climate Denial Crock of the Week" series:

Further viewing

This video created by Andy Redwood in May 2020 is an interesting and creative interpretation of this rebuttal:

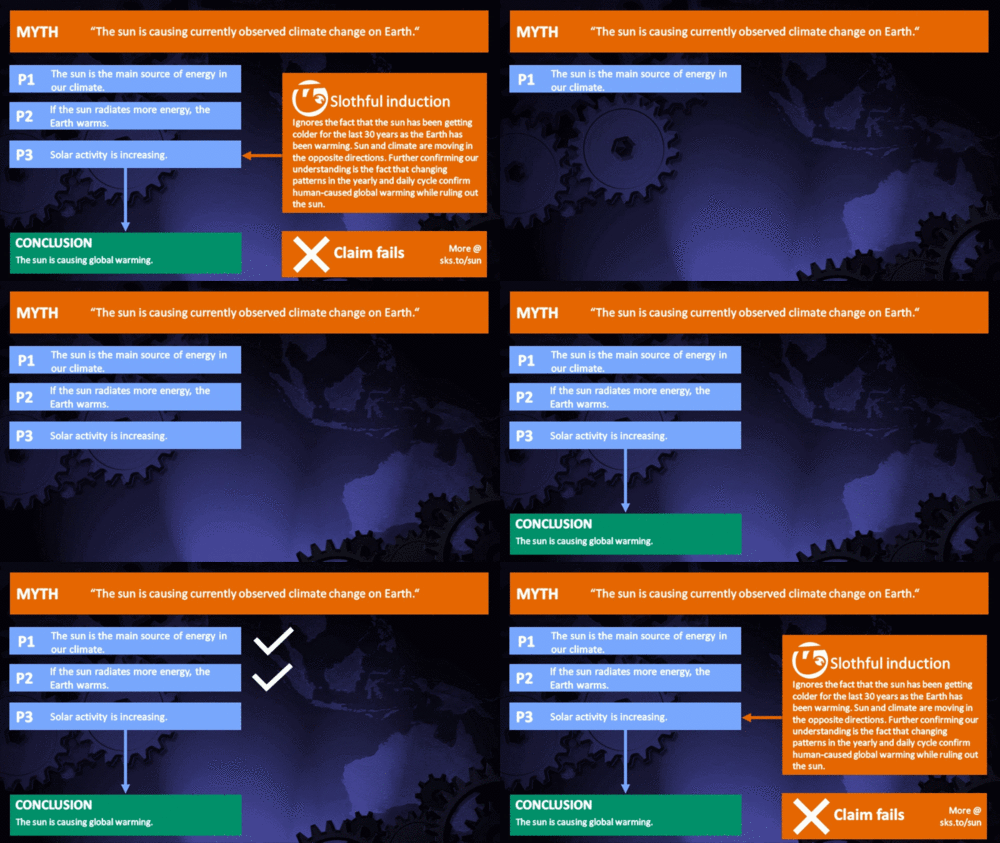
Myth Deconstruction

Related resource: Myth Deconstruction as animated GIF

MD Sun

Please check the related blog post for background information about this graphics resource.

Denial101x videos

Related lecture-videos from Denial101x - Making Sense of Climate Science Denial

and

Additional video from the MOOC

Expert interview with Mike Lockwood

Comments

Prev  4  5  6  7  8  9  10  11  12  13  14  15  16  17  18  19  20  21  22  23  Next

Comments 326 to 350 out of 626:

  1. "You only seem to only read the "parts" you want to see." No, as you can now see, I was getting to that. But no matter, I doubt you'll try to understand the physics. You're just wrong, Gord. There's no use arguing with someone who refuses to be reasonable, so that's it. We're done.
  2. Interference "In physics, interference is the addition (superposition) of two or more waves that result in a NEW WAVE pattern." "The principle of superposition of waves states that the resultant displacement at a point is equal to the vector sum of the displacements of different waves at that point. If a crest of a wave meets a crest of another wave at the same point then the crests interfere constructively and the resultant wave amplitude is greater. If a crest of a wave meets a trough of another wave then they interfere destructively, and the overall amplitude is decreased." http://en.wikipedia.org/wiki/Interference ------------------- Electromagnetic radiation "Interference is the superposition of two or more waves resulting in a NEW WAVE pattern. If the fields have components in the same direction, they constructively interfere, while opposite directions cause destructive interference." http://en.wikipedia.org/wiki/Electromagnetic_wave ------------------------------- The Resultant Electromagnetic Vector Field is the ONLY EM field that can be measured at any single point. It is, in fact, a NEW WAVE produced by interference and the component parts cannot be measured at a single point. The Resultant EM Field will be continuous if the components are continuous. For Heat Transfer by Radiation between bodies, as long as each body has a temperature, the resultant EM field will be continuous. If one body maintains a temperature that is warmer than the cooler body the continuous resultant EM Field will only propagate from warm to cold. There will be zero EM wave propagation from cold to warm and therefore there will be zero energy transfer from the cold body to the warm body. Just like the 2nd Law of Thermodynamics clearly states.
  3. Patrick - If "refusing to be resonable" includes denying the validity of the fundamental Laws of Science, then I am guilty as charged. Unfortunately, you have confirmed that you are in denial of established science. Too bad.
  4. "chris at 19:00 PM on 29 April, 2009 Re #327 Your timings and causes are incorrect Quietman. The collision of the African and Eurasian plates that "squeezed out" the Tethys Ocean and drove the crumpling and nappe formation that raised the Alps occurred 20-ish million years ago. It had nothing to do with the PETM." I guess that you should take that up with Dr. Chris Beard (Ph.D.) since I took that right out of his book "The Hunt for the Dawn Monkey". It happens to be key to the study of primate evolution and how we got to Africa from Asia. The mountains did not rise until well after the collision and are not proof that the collision took place as late as only 20 million years ago, especially since our ancestors were in Africa MUCH earlier. Morotopithecus was already bipedal and walking around Africa 23 million years ago. Early Eocene Map (Before landbridge) Miocene Map (after landbridge) Better stick to subjects that your familiar with. Oh wait, I forgot, you not familiar with those facts either.
  5. The Solar Grand Maximum that went on for about 70 years has ended. The 30 year or so PDO uptrend that combined with the Solar Grand Maximum to produce the late-20th-century temperature run up has started its 30 year downtrend. The PDO downtrend combined with the quiet sun is going to result in continued planet cooling. The sun has not been this quiet this long since 1913. Sunspot changes may be a catalyst for cloud changes and therefore have much greater influence than TSI.
  6. Correction to 327 and 348 PETM was not intended, Eocene Optimim was intended, the PETM marks a spike that begins the EO when prosimians such as Eosimias were evolving in China shortly after India met Eurasia. In the first map Africa and India are have not closed the gap. VERY active tectonics, unbelieveably active movements of continental masses. Geologically speaking super fast. PE of the Earth.
  7. Gord In all fairness I need to point out that the earth's vulcanism kept alive by gravitational stress* is a second but much weaker heat source. * work energy converted to heat + residual heat from the formation of the earth. References are listed in the Volcano thread.
  8. Quiteman - I agree. I, generally, covered this in my first Post #243, where I identified the Earth's molten core as an energy source. I think the number of under-sea volcanos and vents remains a largely unknown quantity. AGW'ers and others have simply dismissed this source of energy as insignificant. It certainly contributes some warming.
  9. Sometimes the possibilities for unknown quantities can be bracketed by known quantities. Most of the geothermal heat escaping the Earth is through slow conduction through rock, not generally subject to rapid fluctuations (mere 1000s of years) on a regional or global scale. (Depending on how deep hydrothermal circulations penetrate, that portion of heat transport may be locally quite variable, but it depends on some more steady supply of heat from below.) From the thermal conductivity and thermal gradients, a heat flux can be estimated. The average concentrations of major heat producing radioactive isotopes has been estimated in various rock types. Understanding of geophysics, geochemistry, plus data, yields an understanding of how those isotopes are likely distributed within the Earth; generally, they are concentrated in the crust (especially continental crust) relative to the mantle, and especially relative to the core. Mantle convection rates can be estimated from continental drift; there is also seismography and physics. Core convection (at least partly driven by latent heat of inner core growth, compositional variations formed by inner core growth, and cooling from above) is linked the the magnetic field. Possible long-term global cooling rates can be bracketed by evidence of past tectonic behavior and knowledge of heat sources (including tidal deformation). Etc, Etc, etc... PS while one point in space and time has only one measurable value of each of the electric field and the magnetic field, spatial variations can be analyzed mathematically (Fourier analysis) to find linearly superimposed components that have various wave vectors. Systems that resonant at different frequencies will detect different parts of the spectrum. Photons with different energies will be absorbed or emitted by associated energy transitions.
  10. Patrick As we discussed in the Volcano thread, Continental Drift was considered a steady gradual process until quite recently. Not we know that it is not. The recent increase alone is proof of that (I won't rehash details here). I know that you do not accept the hypothesis of a tectonic driver of climate, this is understandable as it is an opposing hypothesis, but I think with a little more study it will prove to be important to understanding climate.
  11. I accept tectonic drivers of climate on the millions of years time scale via geographical changes (directly forcing climate changes, also shaping some aspects of the carbon cycle) and geologic CO2 emissions. (Obviously this can all affect biological evolution and that will have climatic effects as well.) (I also accept that climate can affect geology - an example is that dry conditions have something to do with the heights achieved by the Andes, though I forget the details (lack of erosion leading to less sediment fed into the subduction zone?)) I do not see any reason to expect changes in the geothermal heat flux itself to have a significant climateic impact on regional to global scales over most of geologic time.
  12. Patrick Re: "I do not see any reason to expect changes in the geothermal heat flux itself to have a significant climateic impact on regional to global scales over most of geologic time." See the maps I posted links to on page 14 here and the additional maps in the "Climate's changed before" thread. I'll try to explain in that thread.
  13. Re #348/350 I was talking about the PETM (Paleo-Eocene Thermal Maximum. You should try to be a bit more specific/explicit in your discourse! The PETM had nothing to do with the collision of the African and Eurasian plates (see post # 329 on this thread) and is characterised by a massive spike in the atmospheric CO2 concentration (possibly originally in the form of methane) and is contemporaneous with the opening up of the North Atlantic at the nascent plate boundary. The warm Eocene period is itself very likely due to high CO2 concentrations as indicated by proxy CO2 measurements from sediments from those periods [**]. Likewise the long, slow cooling in the middle to late Eocene is associated with a continual slow decrease in atmospheric CO2 concentrations as indicated by proxy CO2 measures from cores [***]. There’s very little evidence that it is heat from (changes in) tectonic activity that generates warming above background levels. The geothermal flux is just too small (around 0.1 W/m2 compared to the greenhouse-augmented solar flux absorbed by the Earth’s surface of over 150 W/m2). Nevertheless recent evidence supports a fundamental role for plate tectonics and continental drift in Eocene warming/cooling. In this case it is the Northward movement of the Indian plate towards Asia that is proposed as the source of the slow, slow ramp up of atmospheric CO2 (and associated warming) and the slow,slow loss of CO2 that progressed into the Oligocene and gave the world Antarctic glaciation. The scenario is as follows [****]: a. As the Indian plate drifted Northwards through the late Mesozoic and into the early Cenozoic (Paleozoic-early Eocene [*]), the carbonate-rich deposits on the ocean floor of the Asiatic margin of the Tethys ocean were subducted beneath the Asiatic plate resulting in their decarbonation and the steady release of CO2 over millions of years. Around 65 MYA and lasting for about 1 million years the massive Deccan traps formation was created in the centre-West of the “Indian” continent as basaltic outpouring from eruption of a mantle plume. b. This “CO2 factory” ceased around 50 MYA as the ocean between the continents was consumed. Continental collision resulted in strong uplift in the collision zone, producing enhanced rainfall. c. The movement of the Indian continent and its massive Deccan Trap into the equatorial belt, together with the enhanced rainfall arising from mountain formation produced strong weathering. Basaltic rocks like the Deccan are strong consumers of CO2 (5-10 times more CO2 consumed compared to granitic rocks under similar weathering conditions). From around 50 MYA through to the late Eocene, CO2 levels dropped, the Earth cooled and 35 MYA or so ago the Earth was sufficiently cool for a substantial ice cap to form in Antarctica….. ([*]for a temporal evolution of global temperature during these periods see: http://en.wikipedia.org/wiki/File:65_Myr_Climate_Change.png) [**] T. K. Lowenstein and R. V. Demicco (2006) Elevated Eocene Atmospheric CO2 and Its Subsequent Decline Science 313, 1928-9. abstract: Quantification of the atmospheric concentration of CO2 ([CO2]atm) during warm periods of Earth's history is important because burning of fossil fuels may produce future [CO2]atm approaching 1000 parts per million by volume (ppm). The early Eocene (~56 to 49 million years ago) had the highest prolonged global temperatures of the past 65 million years. High Eocene [CO2]atm is established from sodium carbonate minerals formed in saline lakes and preserved in the Green River Formation, western United States. Coprecipitation of nahcolite (NaHCO3) and halite (NaCl) from surface waters in contact with the atmosphere indicates [CO2]atm > 1125 ppm (four times preindustrial concentrations), which confirms that high [CO2]atm coincided with Eocene warmth. [***]M. Pagani et al. (2005) Marked Decline in Atmospheric Carbon Dioxide Concentrations During the Paleogene Science 309, 600-603. abstract: The relation between the partial pressure of atmospheric carbon dioxide (pCO2) and Paleogene climate is poorly resolved. We used stable carbon isotopic values of di-unsaturated alkenones extracted from deep sea cores to reconstruct pCO2 fromthe middle Eocene to the late Oligocene (45 to 25 million years ago). Our results demonstrate that pCO2 ranged between 1000 to 1500 parts per million by volume in the middle to late Eocene, then decreased in several steps during the Oligocene, and reached modern levels by the latest Oligocene. The fall in pCO2 likely allowed for a critical expansion of ice sheets on Antarctica and promoted conditions that forced the onset of terrestrial C4 photosynthesis [****] D. V. Kent and G. Muttoni (2008) Equatorial convergence of India and early Cenozoic climate trends Proc. Natl. Acad. Sci. USA. 105, 16065-16070 abstract: India's northward flight and collision with Asia was a major driver of global tectonics in the Cenozoic and, we argue, of atmospheric CO2 concentration (pCO2) and thus global climate. Subduction of Tethyan oceanic crust with a carpet of carbonate-rich pelagic sediments deposited during transit beneath the high-productivity equatorial belt resulted in a component flux of CO2 delivery to the atmosphere capable to maintain high pCO2 levels and warm climate conditions until the decarbonation factory shut down with the collision of Greater India with Asia at the Early Eocene climatic optimum at ≈50 Ma. At about this time, the India continent and the highly weatherable Deccan Traps drifted into the equatorial humid belt where uptake of CO2 by efficient silicate weathering further perturbed the delicate equilibrium between CO2 input to and removal from the atmosphere toward progressively lower pCO2 levels, thus marking the onset of a cooling trend over the Middle and Late Eocene that some suggest triggered the rapid expansion of Antarctic ice sheets at around the Eocene-Oligocene boundary.
  14. Great info, chris!
  15. "The geothermal flux is just too small (around 0.1 W/m2 compared to the greenhouse-augmented solar flux absorbed by the Earth’s surface of over 150 W/m2). " Yes and the continents are fixed. This is an old story that isn't true. It is not a constant but a variable.
  16. Patrick It would be interesting if true, however they are blowing smoke.
  17. Chris The PETM is a spike of zero duration in geologic time. It represents an event that caused a heat peak but not a continued warming as it immediately cooled. The cause of this spike is unknown and as it had to lasting effect is irrelevant. The later climb represents changes in ocean currents in direct response to the Med being cut off from the Pacific.
  18. had to lasting s/b had no lasting
  19. Patrick by "blowing smoke" I mean bad science procedures. They assume AGW and try to make the past fit the hypothesis rather than study of the period and let the science speak for itself WITHOUT ASSUMPTIONS.
  20. ps Ice cores have already proven that CO2 follows temps, not the other way around. This means that regardless of how much CO2 there was, it is irrelevant. It was NOT the cause and only confirms that CO2 increases with increased temperatures some time afterward, that's all.
  21. re: #361. The PETM obviously didn't have "zero duration". The greenhouse-induced warming took up to 20,000 years with a longer recovery time. It produced a large temperature rise, ocean acidification, and is associated with expulsion of a very large amount of 13C-depeleted carbon into the atmosphere (and oceans). It caused very significant extinctions of marine organisms. #363/364: The science is speaking for itself Quietman, based on careful assesment of evidence....and science is nothing if not evidence-based. The fact is that the PETM is associated with very high atmospheric CO2 levels, and these were 13C-depleted (possibly originating in methane clathrates), and the oceans acidified. These are all characteristics of warming from greenhouse forcing and CO2 uptake by the oceans. Likewise the warming of the Eocene is linked to high atmospheric CO2 levels and cooling towards the late Oligocene was sequentially reduced CO2 levels. We can be scientific and assess the relationship between raised/reduced temperatures and raised/reduced CO2 durng these periods. We can inspect the ice age transitions and observe that the glacial-interglacial transitions were generally associated with a temperature rise of 5-6 oC and raised CO2 of around 90 ppm (180-270 ppm through several of the transitions in the ice core record). Thus a global temperature rise/fall of around 1 oC recruits/sequesters around 15 ppm of CO2 into/from the atmosphere. The peak of the Eocene was perhaps 6 oC warmer than now. Atmospheric CO2 levels were as high as 1500 ppm. It's immediately obvious that such high CO2 levels cannot be due to the physicochemical equilibrium between atmospheric and oceanic CO2 that was responsible for temperature-linked CO2 changes during ice age glacial-interglacial transitions. We might account for 100 or even 200 ppm of atmospheric CO2 that way, but we're more than 1000 ppm of atmospheric CO2 out. CO2 levels can't have risen in the manner that you suggest - it's incompatible with the evidence. And of course the notion that CO2 follows temperature but not the other way round is logically flawed. Any phenomenon/event that releases large amounts of greenhouse gas into the atmosphere must cause the Earth to warm. The Earth warmed rather quickly during the PETM as a result of the massive enhancement of greenhouse gases that has left multiple traces in the sedimentary record. That's what the evidence shows.
  22. Re 359 - when we say that it is only about 0.1 W/m2 (and, actually, I think that's rounded up from maybe 0.08 W/m2), we - here I am assuming what others mean - we don't mean that it is always exactly the same. But it cannot vary much very fast on large (regional and global) scales because much of the heat near the surface had to come from below, etc... a sudden increase in the heat flux would deplete the near-surface heat and it would take time for heat from below to build up the near-surface heat to a point where it can flow out at the same rate... and of course, the rate of radioactive decay within the crust is basically set in stone once the stone forms. Larger changes have to take millions of years... and there are negative feedbacks that would keep it from getting much larger or much smaller than what it would be following a billions-of-years long cooling trend. Re 363 - why, then, should you assume that changes in geothermal heat fluxes and continental arrangements should have any effect? - even though the later obviously and easily could, it would be an assumption (that certain physical laws held for other time periods, etc.) that it ever did... (Of course it (changes in geography) did, and of course CO2 did, etc.)
  23. Re: "and science is nothing if not evidence-based." It is except for AGW, this is faith-based as there is not evidence. Re: "The peak of the Eocene was perhaps 6 oC warmer than now. Atmospheric CO2 levels were as high as 1500 ppm." In parts of the Mesozoic it was not as hot but had higher levels of CO2, There is zero correlation. Re: "Likewise the warming of the Eocene is linked to high atmospheric CO2 levels and cooling towards the late Oligocene was sequentially reduced CO2 levels." No it's increased O2 caused cooling, not reduction of CO2. One is a cause and the other is a consequent. Re: "We might account for 100 or even 200 ppm of atmospheric CO2 that way, but we're more than 1000 ppm of atmospheric CO2 out. CO2 levels can't have risen in the manner that you suggest - it's incompatible with the evidence." No, it's not when you take into account the massive increase in tectonic activity and bombardment from space of asteroids and comets (from about 70mya through the Miocene). Think just a minute of how much NOx and Methane was being released from former seabeds not exposed to the air.
  24. not exposed to the air s/b now exposed to the air (refer to the paleomaps)
  25. ps see "Global warming and natural climate change in the past" This discussion does not belong in this thread.

Prev  4  5  6  7  8  9  10  11  12  13  14  15  16  17  18  19  20  21  22  23  Next

Post a Comment

Political, off-topic or ad hominem comments will be deleted. Comments Policy...

You need to be logged in to post a comment. Login via the left margin or if you're new, register here.

Link to this page


The Consensus Project Website

THE ESCALATOR

(free to republish)


© Copyright 2024 John Cook
Home | Translations | About Us | Privacy | Contact Us