Climate Science Glossary

Term Lookup

Enter a term in the search box to find its definition.

Settings

Use the controls in the far right panel to increase or decrease the number of terms automatically displayed (or to completely turn that feature off).

Term Lookup

Settings


All IPCC definitions taken from Climate Change 2007: The Physical Science Basis. Working Group I Contribution to the Fourth Assessment Report of the Intergovernmental Panel on Climate Change, Annex I, Glossary, pp. 941-954. Cambridge University Press.

Home Arguments Software Resources Comments The Consensus Project Translations About Support

Bluesky Facebook LinkedIn Mastodon MeWe

Twitter YouTube RSS Posts RSS Comments Email Subscribe


Climate's changed before
It's the sun
It's not bad
There is no consensus
It's cooling
Models are unreliable
Temp record is unreliable
Animals and plants can adapt
It hasn't warmed since 1998
Antarctica is gaining ice
View All Arguments...


Username
Password
New? Register here
Forgot your password?

Latest Posts

Archives

Sun & climate: moving in opposite directions

What the science says...

Select a level... Basic Intermediate Advanced

The sun's energy has decreased since the 1980s but the Earth keeps warming faster than before.

Climate Myth...

It's the sun

"Over the past few hundred years, there has been a steady increase in the numbers of sunspots, at the time when the Earth has been getting warmer. The data suggests solar activity is influencing the global climate causing the world to get warmer." (BBC)

At a glance

Thankfully for us, our Sun is a very average kind of star. That means it behaves stably over billions of years, steadily consuming its hydrogen fuel in the nuclear reaction that produces sunshine.

Solar stability, along with the Greenhouse Effect, combine to give our planet a habitable range of surface temperatures. In contrast, less stable stars can vary a lot in their radiation output. That lack of stability can prevent life, as we know it, from evolving on any planets that might orbit such stars.

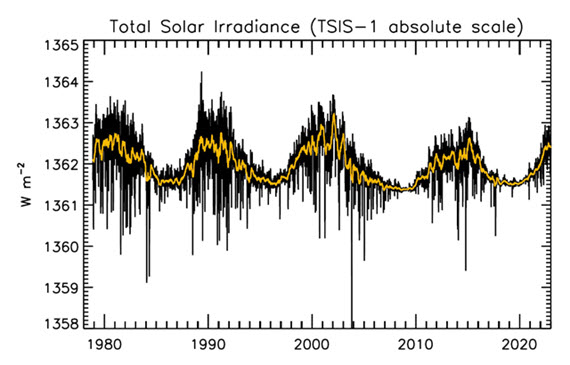
That the Sun is a stable type of star is clearly demonstrated by the amount of Solar energy reaching Earth's average orbital position: it varies very little at all. This quantity, called the Total Solar Irradiance, has been measured for around forty years with high accuracy by sensitive instruments aboard satellites. Its average value is 1,362 watts per square metre. Irradiance fluctuates by about a watt either way, depending on where we are within the 11-year long sunspot cycle. That's a variation of no more than 0.15%.

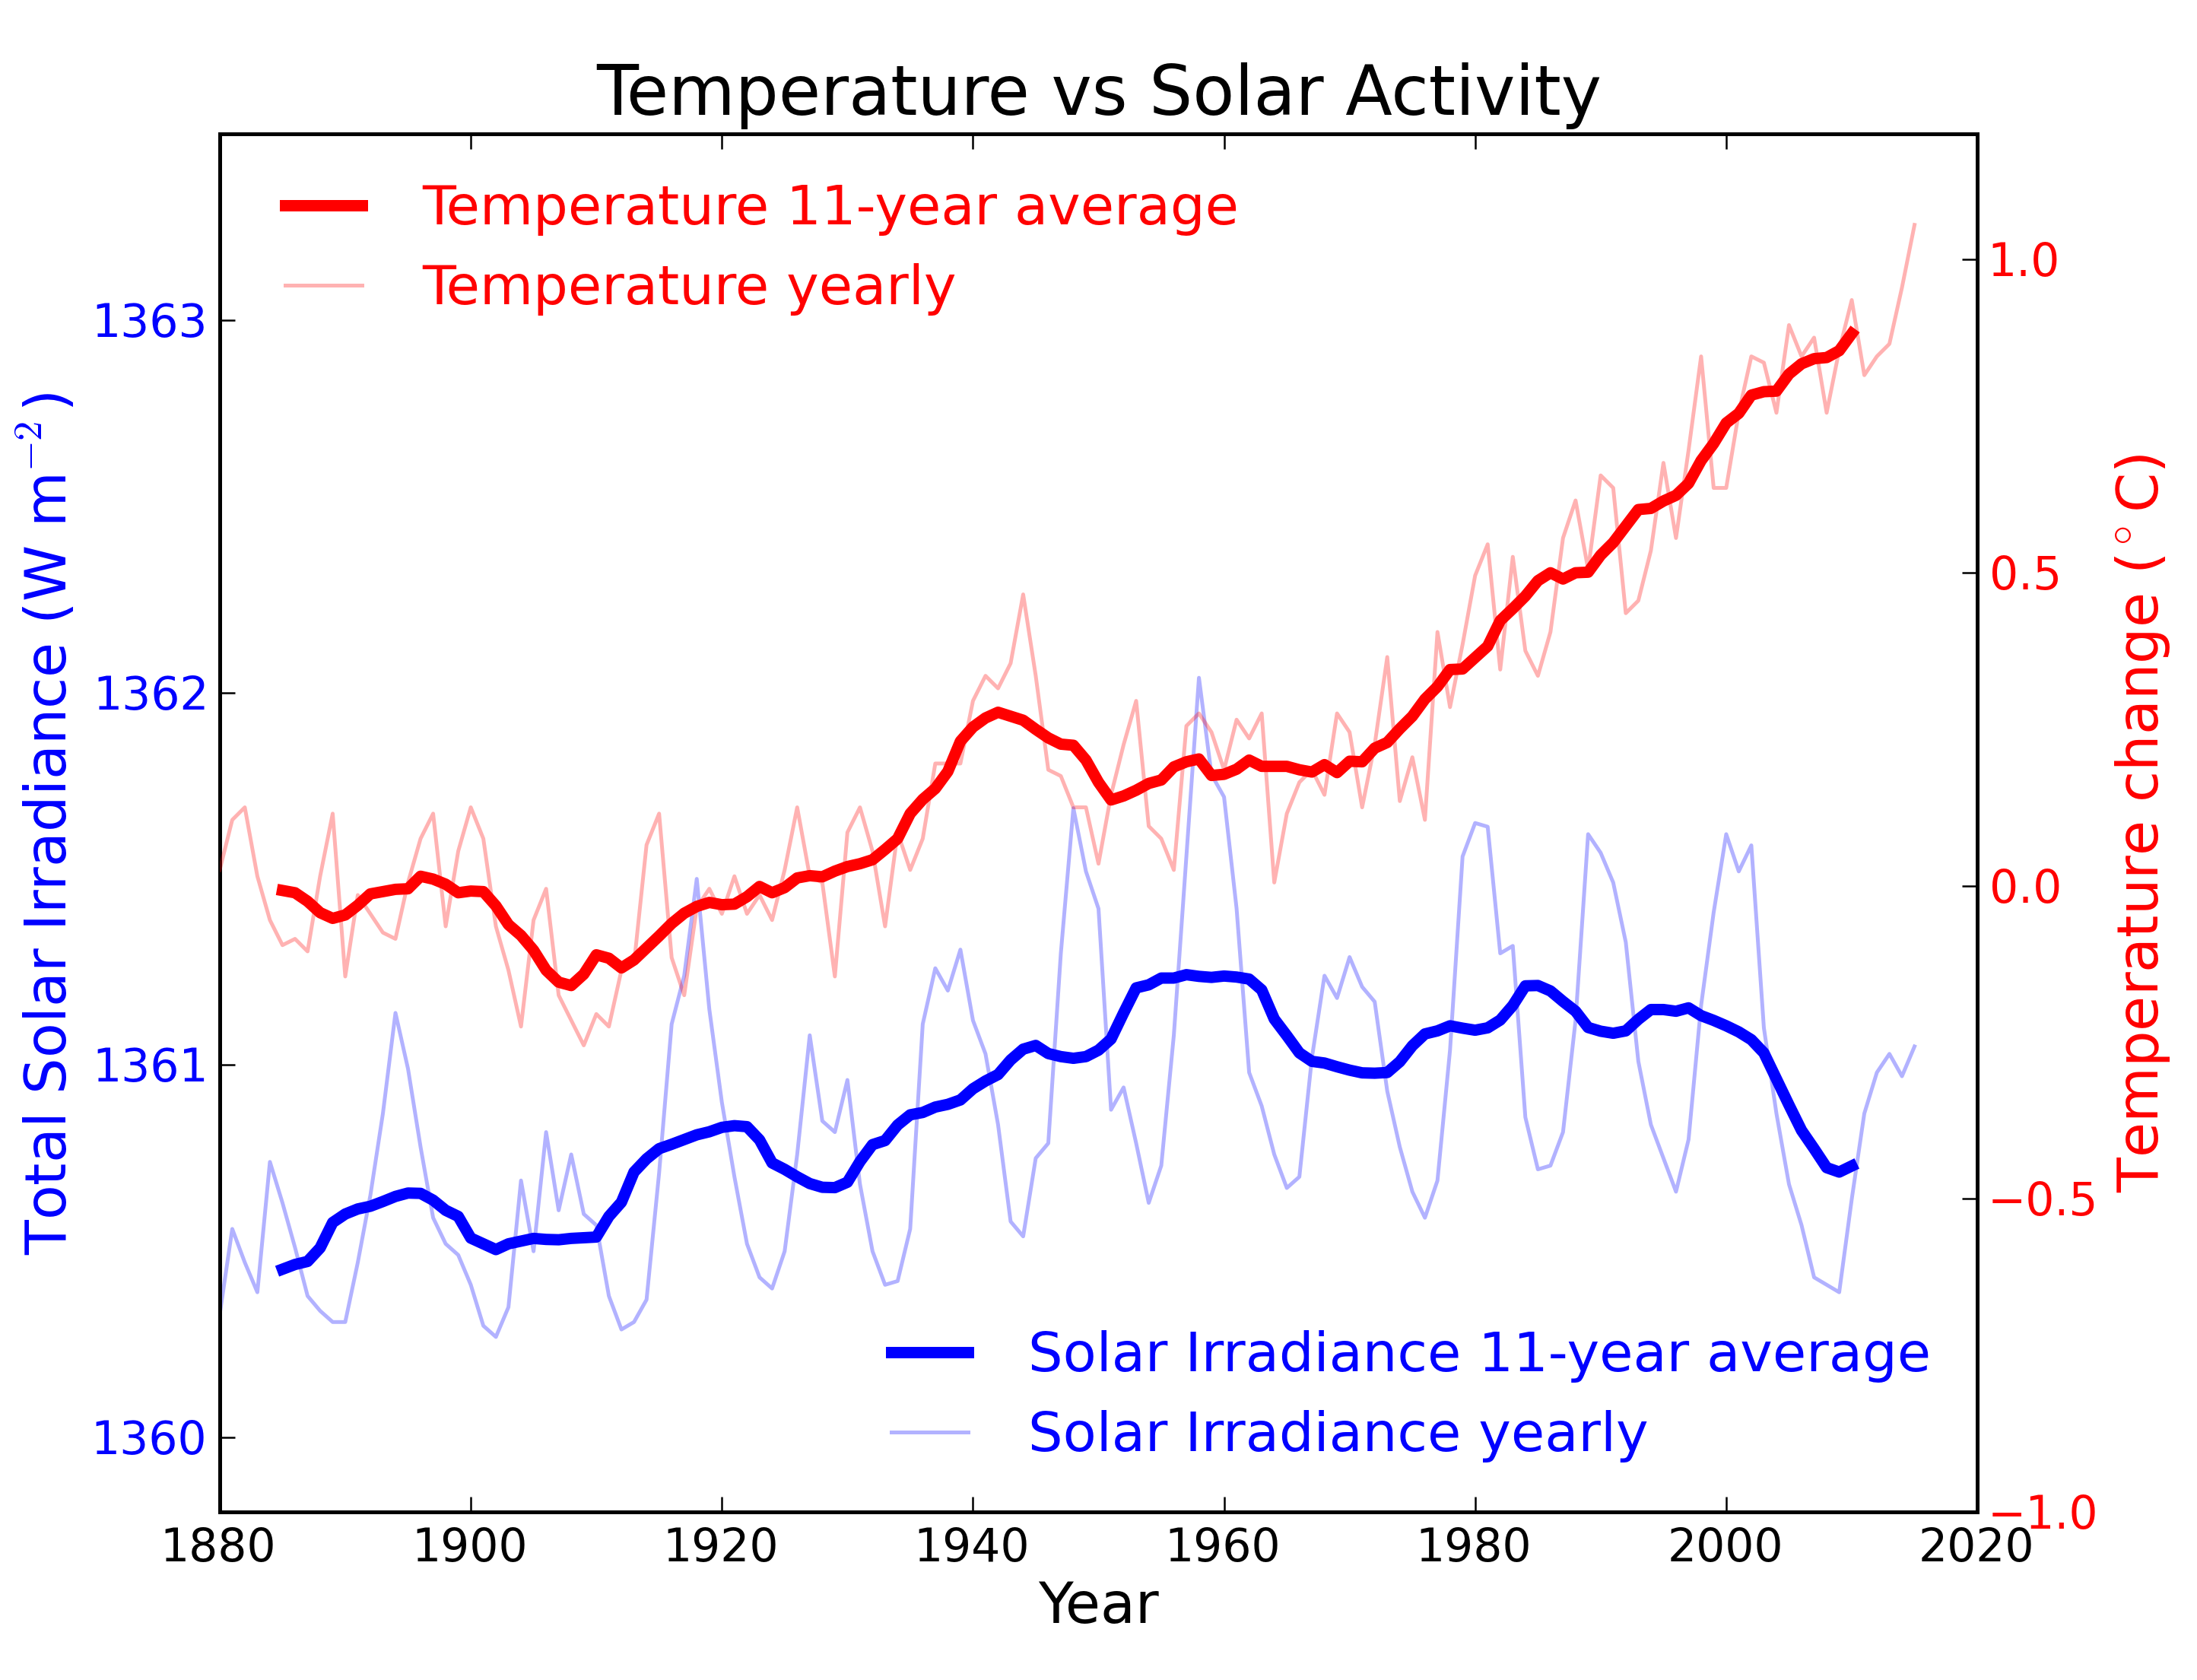
From the early 1970s until today, the Solar radiation reaching the top of Earth's atmosphere has in fact shown a very slight decline. Through that same period, global temperatures have continued to increase. The two data records, incoming Solar energy and global temperature, have diverged. That means they have gone in opposite directions. If incoming Solar energy has decreased while the Earth continues to warm up, the Sun cannot be the control-knob of that warming.

Attempts to blame the sun for the rise in global temperatures have had to involve taking the data but selecting only the time periods that support such an argument. The remaining parts of the information - showing that divergence - have had to be ditched. Proper science study requires that all the available data be considered, not just a part of it. This particular sin is known as “cherry-picking”.

Please use this form to provide feedback about this new "At a glance" section, which was updated on May 27, 2023 to improve its readability. Read a more technical version below or dig deeper via the tabs above!


Further details

Our Sun is an average-sized main sequence star that is steadily using its hydrogen fuel, situated some 150 million kilometres away from Earth. That distance was first determined (with a small error) by a time consuming and complex set of measurements in the late 1700s. It led to the first systemic considerations of Earth's climate by Joseph Fourier in the 1820s. Fourier's number-crunching led him to realise a planet of Earth's size situated that far from the Sun ought to be significantly colder than it was. He was thereby laying the foundation stone for the line of enquiry that led after a few decades to the discovery of what we now call the Greenhouse Effect – and the way that effect changes in intensity as a response to rising or falling levels of the various greenhouse gases.
TSI Solar cycles

Figure 1: Plot of the observational record (1979-2022) on the scale of the TSIS-1 instrument currently flying on the space station. In this plot, the different records are all cross calibrated to the TSIS-1 absolute scale (e.g., the TSIS1-absolute scale is 0.858 W/m^2 higher than the SORCE absolute scale) so the variability of TSI in this plot is considered to be its “true variability” (within cross calibration uncertainties). Image: Judith Lean.

The Sun has a strong magnetic field, but one that is constantly on the move, to the extent that around every 11 years or so, Solar polarity flips: north becomes south, until another 11 years has passed when it flips back again. These Solar Cycles affect what happens at the surface of the Sun, such as the sunspots caused by those magnetic fields. Each cycle starts at Solar Minimum with very few or no sunspots, then rises mid-cycle towards Solar Maximum, where sunspots are numerous, before falling back towards the end. The total radiation emitted by the Sun – total solar irradiance (TSI) is the technical term – essentially defined as the solar flux at the Earth's orbital radius, fluctuates through this 11-year cycle by up to 0.15% between maximum and minimum.

Such short term and small fluctuations in TSI do not have a strong long term influence on Earth's climate: they are not large enough and as it's a cycle, they essentially cancel one another out. Over the longer term, more sustained changes in TSI over centuries are more important. This is why such information is included, along with other natural and human-driven influences, when running climate models, to ask them, “what if?"

An examination of the past 1150 years found temperatures to have closely matched solar activity for much of that time (Usoskin et al. 2005). But also for much of that time, greenhouse gas concentrations hardly varied at all. This led the study to conclude, "...so that at least this most recent warming episode must have another source."
TSI vs. T
Figure 2: Annual global temperature change (thin light red) with 11 year moving average of temperature (thick dark red). Temperature from NASA GISS. Annual Total Solar Irradiance (thin light blue) with 11 year moving average of TSI (thick dark blue). TSI from 1880 to 1978 from Krivova et al. 2007. TSI from 1979 to 2015 from the World Radiation Center (see their PMOD index page for data updates). Plots of the most recent solar irradiance can be found at the Laboratory for Atmospheric and Space Physics LISIRD site.

The slight decline in Solar activity after 1975 was picked up through a number of independent measurements, so is definitely real. Over the last 45 years of global warming, Solar activity and global temperature have therefore been steadily diverging. In fact, an analysis of solar trends concluded that the sun has actually contributed a slight cooling influence into the mix that has driven global temperature through recent decades (Lockwood, 2008), but the massive increase in carbon-based greenhouse gases is the main forcing agent at present.

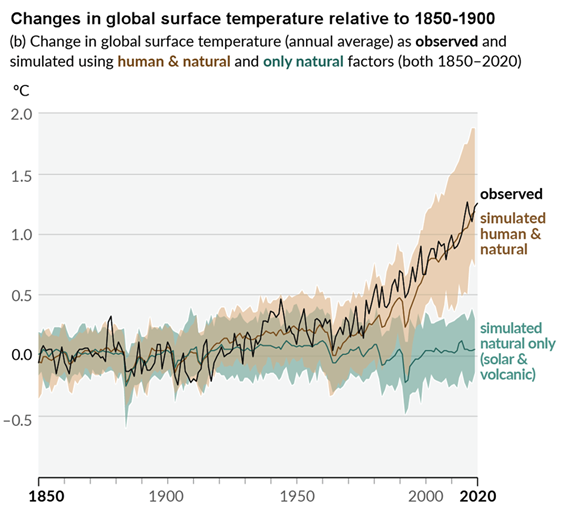
Other studies tend to agree. Foster & Rahmstorf (2011) used multiple linear regression to quantify and remove the effects of the El Niño Southern Oscillation (ENSO) and solar and volcanic activity from the surface and lower troposphere temperature data.  They found that from 1979 to 2010, solar activity had a very slight cooling effect of between -0.014 and -0.023°C per decade, depending on the data set. A more recent graphic, from the IPCC AR6, shows these trends to have continued.

AR6 WGI SPM Figure 1 Panel p

Figure 3: Figure SPM.1 (IPCC AR6 WGI SPM) - History of global temperature change and causes of recent warming panel (b). Changes in global surface temperature over the past 170 years (black line) relative to 1850–1900 and annually averaged, compared to Coupled Model Intercomparison Project Phase 6 (CMIP6) climate model simulations (see Box SPM.1) of the temperature response to both human and natural drivers (brown) and to only natural drivers (solar and volcanic activity, green). For the full image and caption please click here or on the image.

Like Foster & Rahmstorf, Lean & Rind (2008) performed a multiple linear regression on the temperature data, and found that while solar activity can account for about 11% of the global warming from 1889 to 2006, it can only account for 1.6% of the warming from 1955 to 2005, and had a slight cooling effect (-0.004°C per decade) from 1979 to 2005.

Finally, physics does not support the claim that changes in TSI drive current climate change. If that claim had any credence, we would not expect to see the current situation, in which Earth's lower atmosphere is warming strongly whereas the upper atmosphere is cooling. That is exactly the pattern predicted by physics, in our situation where we have overloaded Earth's atmosphere with greenhouse gases. If warming was solely down to the Sun, we would expect the opposite pattern. In fact, the only way to propagate this myth nowadays involves cherry-picking everything prior to 1975 and completely disregarding all the more recent data. That's simply not science.

Longer-term variations in TSI received by Earth

It's also important to mention variations in TSI driven not by Solar energy output but by variations in Earth's orbit, that are of course independent of Solar activity. Such variations, however, take place over very long periods, described by the Milankovitch orbital cycles operating over tens of thousands of years. Those cycles determine the distance between Earth and the Sun at perihelion and aphelion and in addition the tilt the planet's axis of rotation: both affect how much heat-radiation the planet receives at the top of its atmosphere through time. But such fluctuations are nothing like the rapid changes we see in the weather, such as the difference between a sunny day and a cloudy one. The long time-factor ensures that.

Another even more obscure approach used to claim, "it's the sun" was (and probably still is in some quarters) to talk about, "indirect effects". To wit, when studies can't find a sufficiently large direct effect, bring even lesser factors to the fore, such as cosmic rays. Fail.

In conclusion, the recent, post 1975 steep rise in global temperatures are not reflected in TSI changes that have in fact exerted a slight cooling influence. Milankovitch cycles that operate over vastly bigger time-scales simply don't work quickly enough to change climate drastically over a few decades. Instead, the enormous rise in greenhouse gas concentrations over the same period is the primary forcing-agent. The physics predicted what is now being observed.

Last updated on 27 May 2023 by John Mason. View Archives

Printable Version  |  Offline PDF Version  |  Link to this page

Argument Feedback

Please use this form to let us know about suggested updates to this rebuttal.

Related Arguments

Further viewing

Related video from Peter Sinclair's "Climate Denial Crock of the Week" series:

Further viewing

This video created by Andy Redwood in May 2020 is an interesting and creative interpretation of this rebuttal:

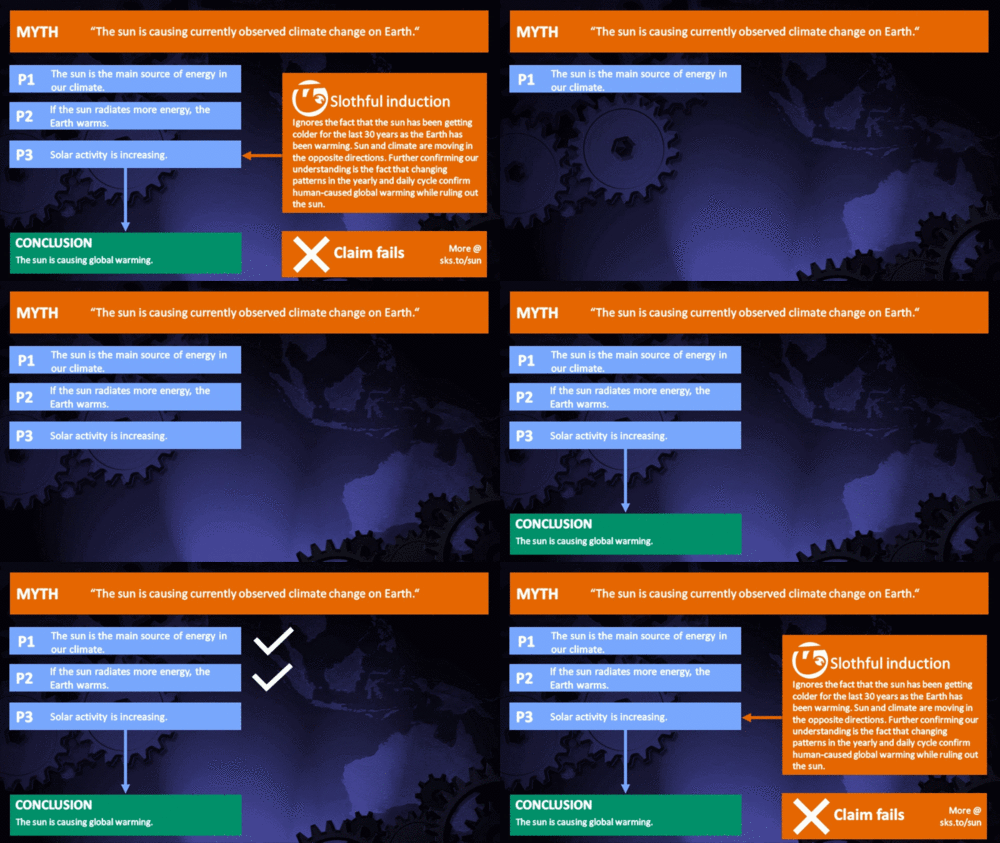
Myth Deconstruction

Related resource: Myth Deconstruction as animated GIF

MD Sun

Please check the related blog post for background information about this graphics resource.

Denial101x videos

Related lecture-videos from Denial101x - Making Sense of Climate Science Denial

and

Additional video from the MOOC

Expert interview with Mike Lockwood

Comments

Prev  15  16  17  18  19  20  21  22  23  24  25  26  27  28  29  30  31  32  33  34  Next

Comments 601 to 625 out of 1288:

  1. JMurphy, If you believe that we are experiencing record high temperatures this year, could you please explain two things. Why is Texas experiencing below average temperatures? Also, Texas experienced the fourth most rainfall for the month of July ever this year. Furthermore, how can you say CO2 drives temperature when ice core samples from Greenland show the opposite and an 800 year lag for the increase in CO2 for the last 12,000 years. In addition, can you really deny the fact that as sun spot activity increases, so do temperatures? I'll leave it there for now. I simply want to keep this discussion honest so people like Sun Tzu can form an un-biased opinion.
    Response: "Why is Texas experiencing below average temperatures?"

    Some regions will experience cool conditions but a number of countries are experiencing record high temperatures this year. 15,000 Russians died in their record heat wave last month. A few months before that, thousands of Pakistanis and Indians died in record heat waves. When you average out the whole planet, we're currently experiencing record high global temperatures.

    "how can you say CO2 drives temperature"

    We know this because the increased greenhouse effect due to rising CO2 has been directly observed by satellites and confirmed by surface measurements. In other words, several independent measurements directly observe that CO2 is trapping heat.

    "ice core samples from Greenland show the opposite and an 800 year lag for the increase in CO2 for the last 12,000 years"

    This is discussed in detail on the "CO2 lags temperature" page. In short, warming causes CO2 rise and rising CO2 causes warming. This is a positive feedback and part of the reason that the planet is able to get out of an ice age.
  2. I feel it is important to mention many areas are cooler than normal. For example, parts of China and the Pacific Northwest of the US. In the 1920's, Russia had over 600,000 deaths due to malaria. Thought I would throw that out there before you mentioned anything about AGW spreading disease. Pre-industrial era, an increase in temperature first must happen for increased oceanic evaporation which increases greenhouse gases. I also would be interested in a response to my statement on the correlation of sun spot activity and temperature.
    Response: For the record, I wasn't talking about AGW spreading disease in Russia - the 15,000 deaths were directly heat related due to record hot temperatures.

    To answer your question "can you really deny the fact that as sun spot activity increases, so do temperatures?", no, you cannot deny that. As the sun gets brighter (eg - more sunspots), the Earth receives more energy and warms. Conversely, as the sunspot activity falls, this equates to less energy reaching the Earth. Over the last 40 years while global temperatures have been rising, the sun has shown a slight cooling trend. This means the sun cannot be causing recent global warming and in fact, is slightly masking the global warming trend.
  3. GnDoty wrote : "I feel it is important to mention many areas are cooler than normal. For example, parts of China and the Pacific Northwest of the US." It's only important if it's true, but your statement would only be true if you replaced the word "many" with "some". If you believe otherwise, please post some evidence. Meanwhile, here is the true state of affairs : 2010 Tied with 1998 as Warmest Global Temperature on Record (Have a look at the Temperature Anomalies graphic) GnDoty wrote : "In the 1920's, Russia had over 600,000 deaths due to malaria. Thought I would throw that out there before you mentioned anything about AGW spreading disease." That is simply a diversion and this is not the place to go into types of malaria and treatments available back in the 1920s. With regard to sunspots, look here. Also, a quick search found a page with this graph. Does the declining trend since the 60s correlate with the increasing temperatures we have been experiencing ?
  4. GnDoty You might find this USA site handy. This is for the global stats, but you can choose a selection of national and global reports at the top. I had a quick look at one of the USA and there didn't seem to be much difference, but you might be able to track down what you're after with more focused steps through the topics. Global anomalies to August
  5. I find it interesting the only rebuttle to sun spots driving temperature is a 40 trend, which is a blink of the eye in geologic time. If you feel compelled to reveal further evidence, please do so as physical, and not computer modeling.
  6. GnDoty at 23:42 PM on 16 September, 2010 .... physical and not computer modelling. I'm not sure what you're getting at. I had a quick look through Jmurphy's references and there were a couple of projected trends but apart from that, all the other information, like the one I referred you to, were simply records of temperatures or observations of sunspots and related phenomena. Do you have a specific question about any of these?
  7. GnDoty writes: I find it interesting the only rebuttle to sun spots driving temperature is a 40 trend, which is a blink of the eye in geologic time. So? Why does this strike you as interesting? Let's say you want to explain the modern temperature rise. You have two possible culprits: solar activity or CO2. Prior to this time period (say, 1800s to 1960-ish) solar activity and CO2 were both increasing, so it's not possible to rule either of them out. From the 1970s on, however, solar activity starts decreasing, while CO2 keeps increasing. Thus, solar activity can't explain the post-1970 rise in temperature but CO2 can. It's fairly simple logic. Looking at solar activity over longer time periods is no doubt scientifically interesting, but not really necessary to rule out solar as the cause of recent warming.
  8. GnDoty, as adelady writes, the sunspot numbers representing that "40 trend" (going back to the 60s) are ACTUAL not modelled - apart from the projected figures beyond 2010, of course. Anyway, how about going back to 1850. What's the correlation there ? Shall we go further ?
  9. Sorry for my typo, which should have read 40 year trend. You can cherry pick time periods all you want. The fact is climate changes without the influence of man. That's why we find whale fossils in the Sahara Desert and shark teeth in north Texas. The position you are taking is essentially that man is more powerful than mother nature and can control climate. Do you honestly believe humans can prevent climatic events like the many that have occurred in the past. If you answer no for any of those events, then why are we focusing on it. I'll answer for you. Money and power.
  10. GnDoty writes: "I find it interesting the only rebuttle to sun spots driving temperature is a 40 trend, which is a blink of the eye in geologic time." Yes... because it is well known that sunlight travels at speeds best measured in 'geologic time'. PLONK
  11. GnDoty--that's ridiculous. Has anyone said anything about "controlling" climate? Are you saying that humans can't change climate? If we dropped ten nuclear bombs in ten large volcanoes, the thirty-year trends would certainly be affected, and that's a tiny amount of power we can wield over our environment. We have the power to kill most of the life on this planet in a matter of days. I wonder if that would affect climate? The oceans are becoming more acid due to relatively rapid saturation with CO2, and life, marine biologists reveal, is having a hard time adapting in such a short time. Where might this added CO2 have come from, I wonder? The time is long, long past where we wonder whether or not we have an effect on the nature of Earth. We eradicate species on a weekly basis. At what point in the process of replacing nature with concrete and asphalt do you suddenly realize that humans (a part of nature, by the way) are quite capable of changing climate? Controlling? Well, that's another matter--but it will be tried over the next century, even if the attempt is blunt, unwieldy, and ultimately does more harm than good. Climate certainly does change without the influence of humans, but you're willfully ignoring the nature of this recent, very rapid climate change that is occurring against the grain of several your major natural cycles. Why aren't "we" as a species taking responsibility for this change? I'll tell you: money and power.
  12. My replies have been between classes so I apologize for the short responses. "Has anyone said anything about "controlling" climate?" Well yes, you did when you said "Controlling? Well, that's another matter--but it will be tried over the next century, even if the attempt is blunt, unwieldy, and ultimately does more harm than good." So you're telling me we are more worried about the acidity of the ocean from CO2 saturation (which is balanced by higher temperatures causing more evaporation) than places like the mississipi delta dead zones due to fertilizers from agriculture up-river. I'm glad we agree this is about money and power.
  13. Re: sun tzu (600) Spot-on, sir. Diagnosis 100% correct. Blinders off. The down side to being able to see is this realization: most people intuitively understand that we are "heading for a cliff", which is why they close their eyes, stick their fingers in the ears, bury their heads in the sand & repeatedly mumble "it can't happen, it can't happen..." It can, it will, it's almost here. Very sobering, this seeing thing. The Yooper
  14. GnDoty, it appears that you believe in a conspiracy by politicians and scientists to take all our money, remove all our freedoms and lord it over us ? Even if you don't actually believe all that, it would appear that your political beliefs are getting in the way of the facts. If that is not the case, you will obviously want to learn more and this website is good for that. Start here and here, then look at the following skeptical arguments : Climate's Changed Before CO2 Lags Temperature It's Freaking Cold ! There's No Correlation Between CO2 and Temperature Humans are too Insignificant to affect Global Climate Precipitation and Storm Changes (From the EPA - there are further links there) If you are truly serious about the truth about all this, you will look at the above and then come back and tell us what you disagree with and why.
    Response: Indeed, GnDoty, please not only read the posts at those links, but put your comments on whichever of those posts is relevant. This post is narrowly focused. Off topic comments usually are deleted.
  15. Re: GnDoty (601, 602, 605, et al) My impression, reading your posts, is that you have been disinformed (as opposed to misinformed) as to the basics of climate change and CO2's role in regulating temperatures. No harm in ignorance, as long as one is truly seeking a better understanding of things. Here's a short version of CO2's role as a greenhouse gas. I would add to that the fact that the amount of fossil fuel CO2 concentrations man adds yearly to the atmosphere is 100 times that as produced annually by all of the Earth's volcanoes worldwide. CO2 is intricately linked to global temperatures and is the biggest temperature control knob of the GHG's. We see in the paleo record that natural changes in forces have operated historically at the millennial and geologic timescales. Change typically is slow. The record is punctuated, however, by short bursts of rapid change in both CO2 concentrations and temperatures. The paleo record is a good place to look for context. However, there is no comparable point anywhere in the record where CO2 levels have spiked so dramatically on such a short timescale. In 150 years, man has raised CO2 concentrations 40% of pre-industrial (read: the maximal levels of CO2 concentrations in inter-glacial periods). The rate of change is now the issue. Because of that, various feedbacks that could be expected to arise when change is slow seem to be not occurring as previous. For example, the ability of the oceans to sequester CO2 seems to be dropping (the base of the oceanic food chain, phytoplankton levels have dropped 40% in the last 40 years), the volume of the Arctic Ice Sheet is at an all-time low (surprise: the Arctic Ice Sheet acts as a carbon sink as well) and we may be seeing the pole area ice-free in summers as early as 2012 (inhibiting its function as a carbon sink). I will mention but not even discuss methane clathrate/hydrate releases already underway. We now know that we need never worry about Ice Ages again (one large factory can emit enough CO2 yearly to forestall decent into ice ages). The biggest remaining worry: will we still be able to produce enough food in a changing climate (droughts and floods play havoc with soil productivity) to support a population expected to reach 9 billion? Between unendurable heat and floods (Pakistan is the current poster child for both) becoming commonplace & suppressed food production will eventually cause significant human losses and migrations, creating enormous social and political unrest. Wars will occur, possible with nuclear exchanges. This is what the science is telling us. This is what the future holds in store. You are intelligent. I have read your comments. All that is lacking is a better understanding, one not blocked by an active disinformation campaign. Fill your mind with the coins of your pocket and your mind will fill your pockets with gold. The Yooper
  16. Interesting site with erudite comments and very well moderated, thank you John Cook. I recall in 1971 the Big Worry was global cooling and then the Modern Solar Maximum started up coincident with "global warming." I'd be interested in seeing the actual facts on global temperature measurements, i.e. what sites were used, what data controls are on those sites, who owns them, who pays for them, and when were the measurements taken. I know for a fact that many of the meteorological sites in the Russian high Arctic that had been reporting since the 1940s were shut down when the Soviet Union collapsed, and this resulted in a spike in reports from more tropical sites. Some Smart People think this led to a false sense of "global warming." My educated suspicion is that ‘greenhouse’ gasses do play a role, as does space weather, as does vulcanism, as do asteroid-earth collisions… But if you look at prehistoric periods of mass extinctions, they seem to all be associated with global cooling, not warming. Geologic periods of global warming seem to have all been associated with a great diversity of life. So what then should we fear most? All I know is my tomatoes did very poorly this year because “they” say it has been the 13th coldest summer in the US Pacific Northwest since 1941... and when I can’t grow food to eat because it is too cold, I starve. So show me the unbiased, actual, unspun, factual temperature data please.
  17. Beagle, to save everyone here (and yourself) from going over arguments that have been brought up many times in the past, I suggest you have a look at Skeptic Arguments and What the Science Says because most of your assertions are in the Top 10 there. Read what they say and then come back and state what you disagree with. Also, you state that you definitively know one thing : "I know for a fact that many of the meteorological sites in the Russian high Arctic that had been reporting since the 1940s were shut down when the Soviet Union collapsed, and this resulted in a spike in reports from more tropical sites." Facts should be quite easily proven and backed-up, so could you provide a link to the facts concerning shut-downs and the "spike" ?
    Response: Beagle, please do as JMurphy suggested. Also, please respond to his request for more info not on this thread, but on the thread Dropped stations introduce warming bias. The policy on this site is for off-topic comments to be deleted. "Off topic" on this site means off topic of the particular post on which the comments are appearing, such as this "It's the Sun" post. Often conversations start as asides on an irrelevant thread, which is okay as long as immediately those conversations continue on a relevant thread. In such cases, it's fine to post a short comment on the original thread, pointing readers to the continuation on the relevant thread.
  18. I say the Sun is the dominant factor in climate change. If you read the new work by Frederick Bailey, on the soon to launched web site www.solarchords.com and his books, you will see the background to two discoveries, one is, what drives sunspot production, the pattern has been discovered and this led to a much greater discovery i.e. It has been cleary shown that the generally accepted value of 1AU for the Earth - Sun distance around the ecliptic plane has been found to be wrong. This work clearly shows that sunspots per se do not influence climate change but because the way they are produced, they are indicators that the AU value is changing and it is this that affects the climate. Because the two events are closely linked in time, people thought that sun spots cause climate change, they do not. This also led on to investigate why does not the TSI measurements reflect the findings made. This site clearly states here; http://www.skepticalscience.com/acrim-pmod-sun-getting-hotter.htm "There is no single continuous satellite measurement of Total Solar Irradiance" In researching the this and other sites I soon realised why the TSI variation that should be seen has not been identified, because only the variation in the output of the Sun is being measured, not the total output or TSI. The variation is then appliked to the standard figure of 1368w per Sq M and allowing for the expected orbital position. Bailey's work clearly shows the reason for the historical hot and cold periods etc.
  19. Climate Scientists who limit their consideration of the influence of the sun on earth’s climate to TSI overlook a far more significant factor which is the influence of solar magnetic fields, as indicated by the proxy of sunspot number time-integral. Fewer sunspots means lower magnetic field, less shielding from galactic cosmic rays, more low-level clouds, lower average cloud altitude, warmer average cloud temperature, more radiation from the planet and thus a cooling planet. An equation based on the first law of thermodynamics that includes the sunspot time-integral, effective sea surface temperature (ESST) and atmospheric carbon dioxide level accurately calculates all average global temperatures since 1895 with a coefficient of determination of 0.88.
  20. 619: "lower magnetic field, less shielding from galactic cosmic rays, more low-level clouds, lower average cloud altitude, warmer average cloud temperature," The supposed link between galactic cosmic rays is discussed here.
    Response: cruzn246, that is one of those cues to continue discussion of that topic on that other thread. Further comments on this thread will be deleted without warning.
  21. Apparently there is more to the cosmic ray story than considered so far. The 15% estimate of temperature increase reported there is less than half that determined using the equation. A common mistake is looking at only cloud cover instead of average cloud altitude. Consideration of the sunspot number time-integral accounts for about 39% of the average global temperature run-up from 1909 to 2005. This is equivalent to an increase of average cloud altitude of only about 115 meters. ESST (PDO appears to be the dominant contributor) also accounted for about 39% of the temperature run-up. CO2 accounted for about 22%.
  22. Ken Lambert - In regards to your ongoing insistence on unmeasured solar influence, I will point out that some of your issues with 1750 are based upon an inconsistent and incorrect view of "baseline". Forcings are set to zero starting at 1750 in many discussions as a point of reference for anomalies, not because of an equilibrium state. According to the historic and paleo reconstructions, without industrialization we should have seen 1750 onward continuing the Little Ice Age slope, and cooling (not equilibrium). By comparing TSI, CO2, aerosols, and other elements to the numbers at 1750 we can see how they've changed over time, and hence determine which changes are more relevant to the changing climate. But it's absolutely NOT a zero sum game starting from a blank slate equilibrium - which you for some reason keep insisting upon. And finally, given the historic record of changes in solar forcing, your insistence on "it's the sun" is not supported - there have not been changes in solar output consistent with the temperature record over the last 30-40 years. The sun is clearly not the base cause of global warming.
  23. Ken Lambert - To follow up on the theme of comparing anomalies, the discussion on CO2 is not the only driver of climate is quite useful, especially this chart: This starts from a baseline of 1880 (where the "zero" is set), showing deltas (changes) from those values. Note that solar irradiance deltas are trivial compared to greenhouse gases and aerosols. Once again, TSI is not the driver of recent warming. TSI changes simply do not match the temperature record.
  24. KR #623 I also went through this solar versus CO2 versus other stuff with Ken a while ago using regression modeling. I clearly demonstrated that during the early 20th century, solar forcing was dominant, while during the end of the 20th century CO2 forcing was dominant. The other variables plugged into the equation were not of terrible practical significance. Anyway, in his wisdom, Ken decided to reject the results of this analysis for reasons that he could not explain coherently.
  25. kdkd - I've found your posts on statistical analysis fascinating, and I did see your earlier exchange regarding solar forcings. Do you have any suggestions for someone (like me) who isn't as familiar with the statistical analysis? Somewhere to get a decent overview on how to look at things like internal variability, sample time required to attain 95% confidence based on variation, or perhaps some of the other topics discussed here with respect to justifying conclusions? I know it's a big topic (eek!), but any pointers would be helpful.

Prev  15  16  17  18  19  20  21  22  23  24  25  26  27  28  29  30  31  32  33  34  Next

Post a Comment

Political, off-topic or ad hominem comments will be deleted. Comments Policy...

You need to be logged in to post a comment. Login via the left margin or if you're new, register here.

Link to this page


The Consensus Project Website

THE ESCALATOR

(free to republish)


© Copyright 2024 John Cook
Home | Translations | About Us | Privacy | Contact Us