Climate Science Glossary

Term Lookup

Enter a term in the search box to find its definition.

Settings

Use the controls in the far right panel to increase or decrease the number of terms automatically displayed (or to completely turn that feature off).

Term Lookup

Settings


All IPCC definitions taken from Climate Change 2007: The Physical Science Basis. Working Group I Contribution to the Fourth Assessment Report of the Intergovernmental Panel on Climate Change, Annex I, Glossary, pp. 941-954. Cambridge University Press.

Home Arguments Software Resources Comments The Consensus Project Translations About Support

Bluesky Facebook LinkedIn Mastodon MeWe

Twitter YouTube RSS Posts RSS Comments Email Subscribe


Climate's changed before
It's the sun
It's not bad
There is no consensus
It's cooling
Models are unreliable
Temp record is unreliable
Animals and plants can adapt
It hasn't warmed since 1998
Antarctica is gaining ice
View All Arguments...


Username
Password
New? Register here
Forgot your password?

Latest Posts

Archives

What evidence is there for the hockey stick?

What the science says...

Select a level... Basic Intermediate

Recent studies agree that recent global temperatures are unprecedented in the last 1000 years.

Climate Myth...

Hockey stick is broken

“In 2003 Professor McKitrick teamed with a Canadian engineer, Steve McIntyre, in attempting to replicate the chart and finally debunked it as statistical nonsense.  They revealed how the chart was derived from "collation errors, unjustified truncation or extrapolation of source data, obsolete data, incorrect principal component calculations, geographical mislocations and other serious defects" -- substantially affecting the temperature index.” (John McLaughlin)

At a glance

The Hockey Stick is a historic graph dating back to a paper published in 1999. It showed Northern Hemisphere temperature variations over the near-thousand year period from 1000-1998. The 'blade' of the stick represented the rapid warming of the late 20th Century. It has an iconic status, both in climate science and in the murky world of science-misinformation, where, naturally, it is despised by all and sundry.

Objections to the Hockey Stick are varied but mostly focussed on the stick's long handle and the data that represents. Obviously, during the centuries going back to 1000, reliable temperature measurements are not available. Fortunately for science, there are things that lived through that long time, such as certain very old trees. They record in the rings of their wood an indication of temperatures, year on year. Gardeners and farmers talk about good and bad growing years and it’s the same for natural systems. For example, cold dry periods make for narrow and densely-packed tree-rings whereas warmer, wetter times lead to more widely-spaced ones.

Importantly, today there are a great many effective past climate indicators, known as proxies because they act in place of thermometers. Because there's a range of indicators, the results from each one can be cross-checked against one another. If a new proxy is any good, its data should agree with that from the other, established ones.

Proxy datasets contain more uncertainty than directly measured temperatures. Everyone knows that. That does not mean they are useless, far from it. Cross-checking means poor data can readily be identified and investigated.

Finally, it's 24 years since the Hockey Stick graph was published. Since then, work on developing and refining the best proxies has been relentless. Better, longer temperature reconstructions have become possible. At the same time, global temperatures have continued to rise. In any of the observation-based records of surface temperature, all of the eight warmest years have been since 2015.

Please use this form to provide feedback about this new "At a glance" section, which was updated on May 27, 2023 to improve its readability. Read a more technical version below or dig deeper via the tabs above!


Further details

Reliable observational temperature records only go back so far in time – in the UK back to 1850 and in the USA to 1880, for example. So how do we find out about conditions going further back, hundreds, thousands or even millions of years into the past? We use proxies.

Proxies are things whose measurable properties are affected in certain, well-defined and understood ways by variations in temperature and other climatic parameters. Although the most well-known proxy work was undertaken by studying the rings of ancient trees, many other things have since shown usefulness in this field. They include data from ice-cores, marine and lake sediments and the fossils they contain, corals, mountain glaciers: as time goes by more and more things have shown themselves to be useful over a variety of time-spans. Armed with such tools, the paleoclimatologist can thereby reconstruct climatic conditions in ancient times, just as the paleontologist can reconstruct ancient ecosystems, from data preserved in the rocks.

By 1999, confidence in paleoclimate proxy data was sufficient to link these ancient records to modern observations and this was done in a famous paper by Michael Mann and colleagues (Mann et al. 1999), showing that global temperature gradually cooled over the last 1000 years, but then rose sharply, beginning in the 20th Century. The shape of the graph (Figure 1) therefore looked like a hockey stick lying flat on the ground with its blade pointing upwards.
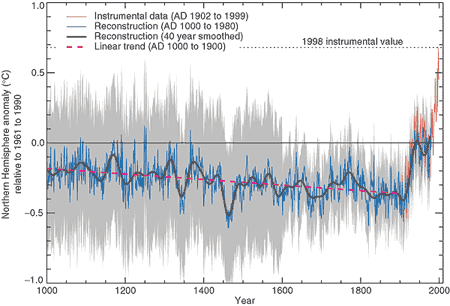

Figure 1: Northern Hemisphere temperature changes estimated from various proxy records shown in blue (Mann et al. 1999). Instrumental data shown in red. Note the large uncertainty (grey area) as you go further back in time.

Controversy, mostly of a manufactured nature, raged over the hockey-stick graph in the years following its publication: it became a symbolic focal point in the online 'climate-wars' that characterised the first two decades of the 21st Century, a time of often bitter battles and recriminations as misinformers attacked climate scientists in any way they could think of.

In the meantime, the expansion of things that were found to work as effective proxies continued apace, so that by the late 2010s we had learned a lot more about paleoclimate going right back through the glaciations and interglacials of the Quaternary and into the warmer late Cenozoic era. The paleoclimate record today stretches a long way back, through tens of millions of years.

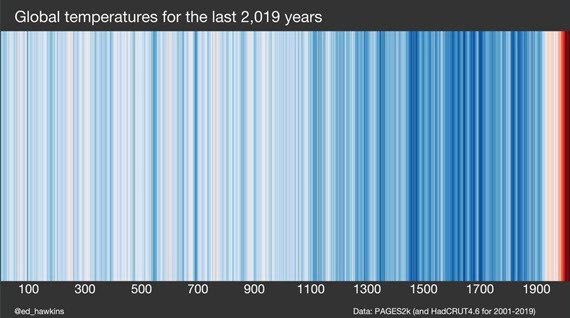
Back to shorter time-spans though, and another visually-catching graphic was recently created by climate scientist Ed Hawkins, using blues for colder years, reds for warmer ones and whites for near-average times. Known as “Warming Stripes'', the initial 2018 graph represented temperatures over the past 200 years, but a more recent version (Figure 2) uses a wide range of reliable proxy data from an international collaboration of scientists, called Past Global Changes 2K (PAGES2K), because it covers the past 2,000 years.
Warming Stripes past 2000 years

Figure 2: Warming Stripes based on PAGES2k (and HadCRUT4.6 for 2001-2019). Source: Ed Hawkins' Climate Lab Book

Warming Stripes is a visually striking graphic due in large part to its simplicity. It's like the Hockey Stick but with 20 years more scientific progress included. But like the Hockey Stick, it confirms the original findings: that the rate of recent warming is very steep in contrast to anything in the past two millennia.

Of course, as one would entirely expect, some crude attempts have been made to doctor Warming Stripes, but they never stand up to the level of scrutiny that scientists apply to their datasets. A graphic circulated in 2019 is one such example. For some unknown reason, its author left off the period 2007-2019, despite the temperature data being readily available. Could it have been because the warmest years on record occurred during this period? You tell us.

Furthermore, an in-depth examination of the graphic in question in a CBS News article shows that in fact it had been put together by crude copying and pasting in Photoshop or a similar application, so badly in fact that the edges of the pasted sections are clearly visible standing out from the top of the graphic. Like all climate misinformation, it just doesn't stand up to scrutiny.

Last updated on 27 May 2023 by John Mason. View Archives

Printable Version  |  Offline PDF Version  |  Link to this page

Argument Feedback

Please use this form to let us know about suggested updates to this rebuttal.

Further reading

The National Academy of Science's summation of the various temperature proxies are available online at Surface Temperature Reconstructions for the Last 2,000 Years.

Tamino has an interesting blog post Not Alike where he compares the Moberg temperature reconstruction (one of the least hockey stick like reconstructions with a distinct Medieval Warm Period and Little Ice Age) to modern temperature trends. He finds modern temperatures are 0.53 deg.C hotter than medieval times and the modern warming rate is 64% greater than the fastest rate in medieval times.

The NOAA Paleoclimatology Reconstructions Network has made available paleo data for download including 92 high-resolution temperature records over the past 2+ millennia.

Denial101x video

Here is a related lecture-video from Denial101x - Making Sense of Climate Science Denial

Additional video from the MOOC

Interviews with  various experts

Comments

Prev  1  2  3  

Comments 51 to 68 out of 68:

  1. GC - perhaps indeed. To clarify. You made this statement. "The first test of any paleo-climate reconstruction should be whether it portrays past climate in a plausible way. Any set of proxies that disagrees with history should immediately be discarded." The implication was that the papers you listed did indeed disagree with history. I pointed you to data, relevant to those papers which show you are wrong. The proxy record is consistent with history. Feel free to point to other papers and the historical records that invalidate them. I have no reason to think Alley's temp reconstruction for central greenland is substantially flawed. I am intrigued to know what historical records you have for central greenland to compare it with.
  2. I second that, scaddenp, I'd also like to know what historical variations in climate Mann's (or any of the many other multi-proxy reconstructions) disagree with. So far as I'm aware, most areas in which events such as the MWP or LIA are recorded historically, show these events in their proxy records. It is areas elsewhere in the world (actually, by far most of the rest of the world), which don't necessarily show the same variations. Are you the blinkered one, not grasping the implications of that, GC? Do you believe that all climate variations are spatially and temporally uniform? I'd like to see you support the accusation of Mann using only a few Yamal trees with some evidence, givent he latest paper used over a thousand proxies from a worldwide network, from many different kinds of proxies. Such accusations of cherry-picking have been debunked over and over again, not least by the multiple independent studies with different methodologies showing largely the same results.
  3. scaddenp & Co., With regard to Tamino, I have nothing to contribute to the discussion other than to say that I find "Climate Audit" more plausible than "Open Mind". The Tamino/McIntyre spat has turned into a cottage industry and good luck to both of them. Statisticians are like economists; if you put them all "End-to-End" they still won't reach agreement. The point I am trying to make is that if studies defy the historical record it is the studies that must be thrown out. Mann and his myriad supporters still insist that history be ignored but it is a battle they must ultimately lose. They should be ashamed for defending the indefensible. The post above and recent events support me. Take a look at Figure 1 that started it all. About 850 years with tiny variations and a very gentle decline followed by a rapid temperature rise. No sign of the MWP or LIA. Move on to Figure 2 that is almost identical to Figure 1. Shame on Wahl-Ammann! Still no sign of the MWP or LIA. The tiny variations are totally implausible when you consider the extreme weather events that occurred during the last 1,000 years such as the hot, dry summers around 1540 that caused major rivers in Europe to dry up. On the other extreme, the river Thames in London froze over on 24 occasions from 1408 to 1814. If you have not seen the following link before, enjoy! http://booty.org.uk/booty.weather/climate/1000_1099.htm Recently, the "Climate Science" community has begun to realize that their credibility has been ruined by historians so growing number of paleo-climate reconstructions show historical events as in Figure 6 (Mann 2008). Here, the MWP and LIA can be seen as minor excursions. What would happen if one left out the tree ring data? Here is a paper by Loehle with the answer: http://www.ncasi.org/publications/Detail.aspx?id=3025 This 2000 year reconstruction shows temperature excursions greater than 1 degree Kelvin and Medieval temperatures higher than 2010. Loehle has been demonized by establishment scientists such as Schmidt and Mann; nevertheless there are still folks like Ljungqvist who can produce similar results even with tree ring proxies included: ftp://ftp.ncdc.noaa.gov/pub/data/paleo/contributions_by_author/ljungqvist2010/ljungqvist2010.txt Climate science needs to stop muddying the waters by creating multi-proxy analyses that include even one proxy that fails the acid test of being consistent with history/archeology. Few if any tree ring proxies would survive and some other proxies might fail the cut too. The Ljungqvist paper covers 2000 years with decadal resolution using proxies located from 30N to 81N. It therefore covers the non-tropical northern hemisphere over recent historical times. The amplitude of temperature variations is 0.9 degrees compared to 3.3 degrees in Richard Alley's ice cores. However, global warming (or global cooling) should be much more pronounced at high latitudes (the central Greenland site was at 73N). When one overlays the temperature variations in Loehle 2007, Ljungqvist 2010 and Alley 2000 the historical features such as "Dark ages", MWP and LIA all show up in the right places so these analyses have some credibility, unlike MBH 98 et seq. apeescape, I read all those links (@43). Methinks they protest too much. Gavin in particular is beginning to sound a little desperate. He is paid to do what he does but he is not winning hearts or minds.
  4. GC, it sounds as though you're in tacit agreement that recent observations of Arctic ice extent, loss of terrestrial ice mass in both hemispheres, globally shrinking diurnal temperature variations, lopsided extreme heat statistics, an upward trend in ocean heat content, increasing signs of intensified convection plus a lengthy list of other consistent indicators with which you are probably painfully familiar all point to a modern change in climate? These are after all recorded in superior cultural records to the instrumentally void and comparatively sparse narratives you consider to obviate proxy temperature data. Looking at your opinion from a different perspective, I'd say your endorsement of historical records bolsters the case for new and startling history being made today. Meanwhile, a differently advanced cultural heritage provides us with a plausible explanation for our present observations. The past is not necessarily prologue; we'll need to look farther back in time to seek an offset of sufficient span and power to be capable of nullifying the secular trend we appear to have started. Once we dip farther back in chronology than historical time, your faith will have to be fully invested in proxies, if you're to seek solace in anachronism.
  5. GC - I asked for specific instance of Tamino criticism for a very good reason - I wanted evidence that Tamino was defending the indefensible as your accusation implied. Which paper do you think is the definitive account of the historical record that you think so reliable? (and the answer had better not be Lamb). I'll stand by my statement that individual proxies reflect local historical record while acknowledging that combining them into a multiproxy record is difficult. Loehle is hardly criticised for excluding tree proxies - other papers have done the same - but for numerous other errors. If he had published in something other than E&E then he might got some quality feedback for improvement instead of having to publish corrections later. The problem with leaving tree proxies out is that is all you have for too periods of too many regions. Undoubted more data will help improve this situation. I would also note very small difference between Mann 2009 and latest from Ljungqvist. Is Mann still "denying" history, but Ljungqvist isnt? McIntyre would have some credibility if he actually published instead of just misleading statements and innuendo from the sidelines.
  6. gallopingcamel has kindly moved the discussion of Loehle and Ljungqvist over to the new thread, but I just want to make sure this doesn't remain here un-amended: gallopingcamel wrote This 2000 year reconstruction (Loehle 2008) shows temperature excursions greater than 1 degree Kelvin and Medieval temperatures higher than 2010. It does show a >1K temperature difference between the peak of the MWP and the bottom of the LIA. It does not, however, show Medieval temperatures higher than 2010. In fact, the warmest decades in Loehle's MWP are 0.5K cooler than 2010. Loehle's reconstruction is centered on its own 2000-year mean, and the final datum is from around 1930. In order to compare Loehle's MWP to current temperatures, it is necessary to re-center Loehle's reconstruction to match some other temperature series (e.g., the instrumental record) that actually shows the current temperature. An example of this is included in the update to this post.
  7. GC, as you're still ignoring the point and restating your incorrect assertions, I can only presume you can't actually answer my question: Why would you assume that every local temperature variation is recorded in full in a global dataset? And can you point to detailed examples of where the regional reconstruction fails to pick out regional climatic variations recorded in local history, and show how that has fed into and distorted the meta-analyses? I doubt you can. The climate science community's credibility has certainly not been affected in the slightest by the historical record.
  8. My comment to part of this article is in relation to the section which says that the McIntyre(2004) publication says that "the hockey stick shape was the inevitable result of the statistical method used (principal components analysis). They also claimed temperatures over the 15th Century were derived from one bristlecone pine proxy record." I do not believe this is a correct interpretation of the aricle - i think the article claims that the hockey stick shape was a results of using an incorrect "scaling" of the time series by using only the last part of the entire time series - the 20th century only. He claims this overly weights the data and results in the hockey stick affect and the hockey stick is not actually resident in the data without this scaling (at least not as a PC1 component). In addition I do not think he claims that the data temperatures where from one bristlecone but that the bristlecone data is not necessarily reliable as it exagerates the true temparuture due to the species magnified growth in a higher C02 environment. This is evident in the article written in 2005 by McKitrick to the APEC Study group titled "what is the Hockey Stick Debate about?"
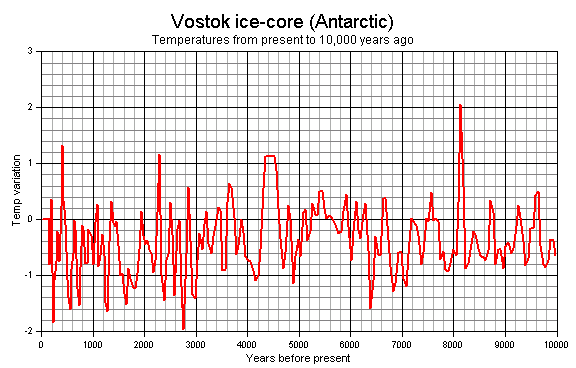
  9. Sadly this debate is the classic example of some people ignoring reality. The Hockey Stick is a misleading graph that has no place anymore in the argument. It was created with some wrong assertions and a lack of accurate data that led to the now infamous graph. I find it incredulous that a so called respected researcher could be fooled by his error so painfully. The Medieval Warm Period and the Little Ice Age are well documented and reported periods of the last 1000 years. To adjust data sets to start just as the climate was cold and then warmed is misleading. There are graphs out there that paint a different picture: This next graph shows the temperature records take from the Vostok Ice Cores and have appeared in numerous publications, including Science, over the last couple of years. The current temperature is 0 on the graph with the variation above and below this as either a positive or negative value. It is for 10,000 years and clearly shows a high degree of variation in average temperature Then we have Ice core data from Greenland's GISP2 Ice Core which clearly shows that our current understanding of how the climate naturally varies over time leaves a lot to be desired. This graph was produced by Climate Change researchers and clearly does not support the anthropogenic argument. When it comes to discussing climate, we should not be looking at trends in data for 10, 30 or even hundred year block of time, but we must study the data for thousands of years worth. The planet does not work on human timescales so our observations must reflect this fact. Bleating about the impact man has or is not having is pointless, we must simply stop polluting our environment and let nature sort the rest out. We need to make significant changes to how we deal with environmental matters, quick fixes are not intelligent or likely to work, only long term, thought out and sustainable changes will achieve any measure of success.
    Response: [muoncounter] Since you didn't bother to read the rules of this road, here's a summary: Stick to the topic. No accusations of deception. No personal attacks (bleating? really?) Cite the sources you use for information (and those should be reputable sources, not dime store blogs). Last warning before deletion.
  10. @Muoncounter: Please explain to me where in my post I have made a personal attack and to whom did I direct it? Regarding information about the graphs...fair point, but if you look at the links, they are hardly dim store blogs (surely is that not a personal attack on the blogger?) One is actually on this site. Bleating is something we all do...the western world is bleating about Climate change and ignoring the bigger picture which is far more important in my opinion. I thought my post made it clear what my position is, I do not agree with AGW, but I do agree with not polluting the environment, so I am not opposed to cleaning things up, just for the right reasons. I have kept the post on topic, it is about the hockey stick is it not? Well to counter one argument you need to justify that stance, I think I did that rather well.
  11. There's a quick discussion of LandyJim's first 'graph' here. There's much more wrong with it than just a dodgy y-axis.
  12. @JMurphy #62 I will concede that the graph could have a better quality about it, however it was used for illustrative purposes. Graph 3 of the Vostok Ice cores comes from a Climate campaigner in New Zealand http://mclean.ch/climate/global_warming.htm who is a member of the New Zealand Climate Science Coalition http://www.nzclimatescience.org/ This information originates in a very reputable and peer reviewed article: Petit, J.R., J. Jouzel, D. Raynaud, N.I. Barkov, J.-M. Barnola, I. Basile, M. Benders, J. Chappellaz, M. Davis, G. Delayque, M. Delmotte, V.M. Kotlyakov, M. Legrand, V.Y. Lipenkov, C. Lorius, L. Pépin, C. Ritz, E. Saltzman, and M. Stievenard. 1999. Climate and atmospheric history of the past 420,000 years from the Vostok ice core, Antarctica. Nature 399: 429-436. If you would like to read more information about the Vostok cores, you can here.. http://www.ncdc.noaa.gov/paleo/icecore/antarctica/vostok/vostok.html The last graph is a reproduction of one that appeared in a Science Online and Journal Peer reviewed article which is actually pro AGW. There is credit for the article in the image if you look. R. B. Alley1, J. Marotzke2, W. D. Nordhaus3, J. T. Overpeck4, D. M. Peteet5, R. A. Pielke Jr.6, R. T. Pierrehumbert7, P. B. Rhines8,9, T. F. Stocker10, L. D. Talley11 and J. M. Wallace8 And an online link is here http://www.sciencemag.org/content/299/5615/2005.abstract If you wish to see other articles written by Richard Alley.. http://www.sciencemag.org/search?author1=R.+B.+Alley&sortspec=date&submit=Submit What I am am saying is that we should not dismiss natural variations in the climate, we must not dismiss influences on those variations, only then can the impact that we have be truly assessed and then action taken accordingly. To me that is common sense.
  13. Here is another reputable reference for the GISP2 Ice Core Data sets from Richard Alley ftp://ftp.ncdc.noaa.gov/pub/data/paleo/icecore/greenland/summit/gisp2/isotopes/gisp2_temp_accum_alley2000.txt And here is the abstract from the top of at work. ABSTRACT: Greenland ice-core records provide an exceptionally clear picture of many aspects of abrupt climate changes, and particularly of those associated with the Younger Dryas event, as reviewed here. Well-preserved annual layers can be counted confidently, with only 1% errors for the age of the end of the Younger Dryas 11,500 years before present. Ice-flow corrections allow reconstruction of snow accumulation rates over tens of thousands of years with little additional uncertainty. Glaciochemical and particulate data record atmospheric-loading changes with little uncertainty introduced by changes in snow accumulation. Confident paleothermometry is provided by site-specific calibrations using ice-isotopic ratios, borehole temperatures, and gas-isotopic ratios. Near-simultaneous changes in ice-core paleoclimatic indicators of local, regional, and more-widespread climate conditions demonstrate that much of the Earth experienced abrupt climate changes synchronous with Greenland within thirty years or less. Post-Younger Dryas changes have not duplicated the size, extent and rapidity of these paleoclimatic changes.
  14. Your second graph, LandyJim, I presume comes from Monckton, or someone similar ? The latest date on it would have to be 1994, I would imagine. How do you think it would look with the temperatures up to 2010 - whatever the temperature scale on that graph actually means and for which location. Do you know ? What do you believe you are trying to show with the Vostock graph - that temperature has varied in the past ? How does that relate to today ? There are more of these you can see here and here, if you like those sort of long-term measurements. As for the fourth one, it isn't from the Abrupt Climate Change paper as you stated; and neither is it from the The Younger Dryas cold interval as viewed from central Greenland" as suggested in your subsequent post. Well, I couldn't find it, anyway, after a quick look, although I did find the data. Perhaps you could point it out more exactly ? You can even see EPICA and VOSTOK compared here, if you would like.
  15. I would like to call your attention to the most recent temperature reconstruction, which was published in Science this month. The paper entitled "2500 Years of European Climate Variability and Human Susceptibility" by Büntgen et al. actually suggests that the current warming has no parallel in the last 2500 years. ABSTRACT Climate variations have influenced the agricultural productivity, health risk, and conflict level of preindustrial societies. Discrimination between environmental and anthropogenic impacts on past civilizations, however, remains difficult because of the paucity of high-resolution palaeoclimatic evidence. Here, we present tree ring–based reconstructions of Central European summer precipitation and temperature variability over the past 2500 years. Recent warming is unprecedented, but modern hydroclimatic variations may have at times been exceeded in magnitude and duration. Wet and warm summers occurred during periods of Roman and medieval prosperity. Increased climate variability from ~AD 250 to 600 coincided with the demise of the Western Roman Empire and the turmoil of the Migration Period. Historical circumstances may challenge recent political and fiscal reluctance to mitigate projected climate change.
  16. A recent reconstruction of the Indo-Pacific Warm Pool reported by Woods Hole Institute found that for the most important body of water in the Pacific the MWP sea surface temperatures were comparable to today's. http://www.whoi.edu/page.do?pid=7545&tid=282&cid=59106&ct=162 Woods Hole Institute's report on the MWP in the Indo-Pacific Warm Pool
  17. Considering all the accusations of fraud and incompetence that have been thrown at Mann for the hockey stick, I find it especially important to point toward what can be uncovered when the skeptics's work is examined with the kind of attention they claim should be applied to scientific work. A major point in the accusations of McIntyre is from McIntyre&McKitrick 05, which expanded on a previous 04 paper. It is there claimed that Mann's statistical methods generate hockey sticks from artificially generated random data that do not contain a signal. Closer examination of the M&M computer code used in this "discovery" shows that the code is designed to sort hockey stick shapes first, then retain only these samples from a much larger number. These are the ones shown by M&M. The rest of M&M's work is riddled with much of what they accuse others to practice. The much touted Wegman report is no better. In addition wegman has been especially reluctant to let others examine his computer code, a behavior that skeptics systematically equate with fraudulent intentions. Thanks must be given to Deep Climate for investigating this in real skeptic fashion: http://deepclimate.org/2010/11/16/replication-and-due-diligence-wegman-style/ http://deepclimate.org/2010/10/25/the-wegman-report-sees-red-noise/ http://deepclimate.org/2010/10/08/wegman-under-investigation-by-george-mason-university/ What is most shocking about the whole thing is how little attention has been paid in the mass media, always so quick at picking up climate deniers accusations toward scientists.
  18. This is a response to TTTM @ Muller Misinformation#1 "Adding a warming bias" = "Using modern, accurate records"? You know something? Whenever I have something modern that accurately performs some task, I prefer it. Using a laser level when doing household repairs is a great deal better than the tedious back-and-forthing of earlier techniques. However, we sometimes find ourselves without our modern gadgetry, so we use the best of what we've got. When we get the chance we check with the best modern equipment and information. And that's what the paleo + modern assembly does. It would be really terrific if every single paleo reconstruction were both accurate and adequate for recent, shorter timescales, but some aren't for one reason or another, eg the ones with century averaging periods. We do the best we can with what we've got. And MBH's work has been validated by similar results with other paleo series that don't have such issues. If MBH were being promoted as the "best" despite disagreement with everyone else's work in this field, you might have a point. But there's agreement, so your point fails.
  19. TTTM said... "Take out the smoothing and the uptick at the end of the series in figure three (above) disappears. The temperature proxy should show a decline in temperatures as recorded by the tree rings." The problem there is that there in no decline in the temperature. We have actual recorded data showing what the modern temps are.
  20. Once again we have a science paper indicating warmth of the more distant past clearly exceeded that of the recent past, with the peak temperature of the MWP exceeding that of the current period by about 0.6°C, or about the same temperature increase that is expected by a doubling of CO2 concentration. This indicates there is nothing unusual, unnatural or unprecedented about the earth's current level of warmth in this particular part of the planet. Ran, L., Jiang, H., Knudsen, K.L. and Eiriksson, J. 2011. Diatom-based reconstruction of palaeoceanographic changes on the North Icelandic shelf during the last millennium. Palaeogeography, Palaeoclimatology, Palaeoecology 302: 109-119.
  21. Bud@everywhere See here and here. You are exploring well charted ground without consulting the maps or the natives.
  22. Bud - what do you mean "once again"? There are no millenial reconstructions which show the MWP hotter than present. For this paper, the North Icelandic Shelf does not represent the entire hemisphere or globe. And the study concludes the sea surface on the North Icelandic shelf "was not as warm during the last century as during the Medieval Warm Period." It's not the last century anymore. And finally, the anthropogenic global waming theory is based on physics, not on being "unprecedented". The fact that the planet warmed naturally in the past doesn't change the physics that humans are causing warming now.
  23. Dana, "For this paper, the North Icelandic Shelf does not represent the entire hemisphere or globe." Exactly--"skeptics" cherry picking again. They seem to never learn from their mistakes--i.e., the misrepresentation of the GIPS2 data. Also a recent paper by Thibodeau et al. (2010) shows that: "We conclude that the 20th century warming of the incoming intermediate North Atlantic water has had no equivalent during the last thousand years. " Just saying....
  24. Sorry, I of course meant to say "GISP2", not "GIPS2"
  25. Sigh. I wonder if they read these things before they post.

Prev  1  2  3  

Post a Comment

Political, off-topic or ad hominem comments will be deleted. Comments Policy...

You need to be logged in to post a comment. Login via the left margin or if you're new, register here.

Link to this page


The Consensus Project Website

THE ESCALATOR

(free to republish)


© Copyright 2024 John Cook
Home | Translations | About Us | Privacy | Contact Us