


 Arguments


How do human CO2 emissions compare to natural CO2 emissions?
What the science says...
| Select a level... |
 Basic
Basic
|
 Intermediate
| |||
|
The natural cycle adds and removes CO2 to keep a balance; humans add extra CO2 without removing any. |
|||||
Climate Myth...
Human CO2 is a tiny % of CO2 emissions
“The oceans contain 37,400 billion tons (GT) of suspended carbon, land biomass has 2000-3000 GT. The atpmosphere contains 720 billion tons of CO2 and humans contribute only 6 GT additional load on this balance. The oceans, land and atpmosphere exchange CO2 continuously so the additional load by humans is incredibly small. A small shift in the balance between oceans and air would cause a CO2 much more severe rise than anything we could produce.” (Jeff Id)
At a glance
Have you heard of Earth's carbon cycle? Not everyone has, but it's one of the most important features of our planet. It involves the movement of carbon through life, the air, the oceans, soils and rocks. The carbon cycle is constant, eternal and everywhere. It's also a vital temperature control-mechanism.
There are two key components to the carbon cycle, a fast part and a slow part. The fast carbon cycle involves the seasonal movement of carbon through the air, life and shallow waters. A significant amount of carbon dioxide is exchanged between the atmosphere and oceans every year, but the fast carbon cycle's most important participants are plants. Many plants take in carbon dioxide for photosynthesis in the growing season then return the CO2 back to the atmosphere during the winter, when foliage dies and decays.
As a consequence of the role of plants, a very noticeable feature of the fast carbon cycle is that it causes carbon dioxide levels to fluctuate in a regular, seasonal pattern. It's like a heartbeat, the pulse of the Northern Hemisphere's growing season. That's where more of Earth's land surface is situated. In the Northern Hemisphere winter, many plants are either dead or dormant and carbon dioxide levels rise. The reverse happens in the spring and early summer when the growing season is at its height.
In this way, despite the vast amounts of carbon involved, a kind of seasonal balance is preserved. Those seasonal plant-based peaks and troughs and air-water exchanges cancel each other out. Well, that used to be the case. Due to that seasonal balance, annual changes in carbon dioxide levels form regular, symmetric wobbles on an upward slope. The upward slope represents our addition of carbon dioxide to the atmosphere through fossil fuel burning.
Fossil fuels are geological carbon reservoirs. As such, they are part of the slow carbon cycle. The slow carbon cycle takes place over geological time-scales so normally it's not noticeable on a day to day basis. In the slow carbon cycle, carbon is released by geological processes such as volcanism. It is also locked up long-term in reservoirs like the oceans, limestone, coal, oil or gas. For example, the "37,400 billion tons of 'suspended' carbon" referred to in the myth at the top of this page is in fact dissolved inorganic carbon in the deep oceans.
Globally, the mixing of the deep ocean waters and those nearer the surface is a slow business. It takes place over many thousands of years. As a consequence, 75% of all carbon attributable to the emissions of the industrial age remains in the upper 1,000 m of the oceans. It has not had time to mix yet.
Fluctuations in Earth's slow carbon cycle are the regulating mechanism of the greenhouse effect. The slow carbon cycle therefore acts as a planetary thermostat, a control-knob that regulates global temperatures over millions of years.
Now, imagine the following scenario. You come across an unfamiliar item of machinery that performs a vital role, for example life support in a hospital. It has a complicated control panel of knobs and dials. Do you think it is a good idea to start randomly turning the knobs this way and that, to see what happens? No. Yet that is precisely what we are doing by burning Earth's fossil fuel reserves. We are tinkering with the controls of Earth's slow carbon cycle, mostly without knowing what the knobs do - and that is despite over a century of science informing us precisely what will happen.
Please use this form to provide feedback about this new "At a glance" section. Read a more technical version below or dig deeper via the tabs above!
Further details
Before the industrial revolution, the CO2 content in the air remained quite steady for thousands of years. Natural CO2 is not static, however. It is generated by a range of natural processes, and absorbed by others. The carbon cycle is the cover-all term for these processes. It has both fast and slow components.
In the fast carbon cycle, natural land and ocean carbon remains roughly in balance and has done so for a long time. We know this because we can measure historic levels of CO2 in the atmosphere both directly, in ice cores and indirectly, through proxies. It's a seasonal response to things like plant growth and decay.
In stark contrast to the fast carbon cycle, the slow version operates over geological time-scales. It has affected carbon dioxide levels and therefore temperatures throughout Earth's history. The reason why the slow carbon cycle is so important is because many of the processes that lead to long-term changes in carbon dioxide levels are geological in nature. They take place over very long periods and do so on an erratic basis. The evolution of a species that has deliberately disturbed the slow carbon cycle is another such erratic event.
Annually, up to a few hundred million tonnes of carbon pass through the slow carbon cycle, due to natural processes such as volcanicity. That's small compared to the fast carbon cycle, through which some 600 billion tonnes of CO2 pass to-and-fro annually (fig. 1). However, remember that the fast carbon cycle is a give-and-take seasonal process. The slow carbon cycle instead runs in one direction or another over periods typically measured in millions of years.
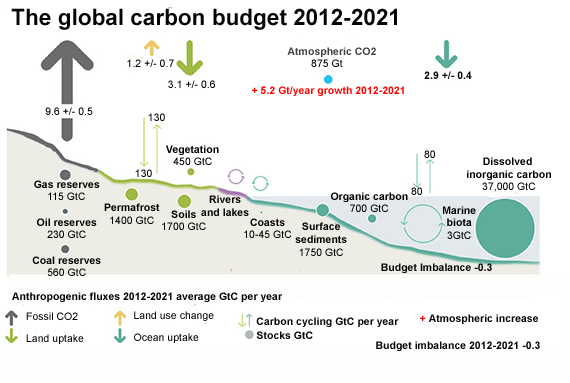
Fig. 1: Schematic representation of the overall perturbation of the global carbon cycle caused by anthropogenic activities averaged globally for the decade 2012–2021. See legends for the corresponding arrows and units. The uncertainty in the atmospheric CO2 growth rate is very small (±0.02 GtC yr−1) and is neglected for the figure. The anthropogenic perturbation occurs on top of an active carbon cycle, with fluxes and stocks represented in the background. Adapted from Friedlingstein et al. 2022.
Through a series of chemical and geological processes, carbon typically takes millions of years to move between rocks, soil, ocean, and atmosphere in the slow carbon cycle. Because of these geological time-scales, however, the overall amount of carbon involved is colossal. Now consider what happens when more CO2 is released from the slow carbon cycle – by digging up, extracting and burning carbon from one of its long-term reservoirs, the fossil fuels. Although our emissions of 44.25 billion tons of CO2 (in 2019 - source: IPCC AR6 Working Group 3 Technical Summary 2022) is less than the 600 billion tons moving through the fast carbon cycle each year, it adds up because the land and ocean cannot absorb all of the extra emitted CO2: about 40% of it remains free.
Human CO2 emissions therefore upset the natural balance of the carbon cycle. Man-made CO2 in the atmosphere has increased by 50% since the pre-industrial era, creating an artificial forcing of global temperatures which is warming the planet. While fossil-fuel derived CO2 is a small component of the global carbon cycle, the extra CO2 is cumulative because natural carbon exchange cannot absorb all the additional CO2. As a consequence of those emissions, atmospheric CO2 has accumulated to its highest level in as much as 15 to 20 million years (Tripati et al. 2009). This is what happens when the slow carbon cycle gets disturbed.
This look at the slow carbon cycle is by necessity brief, but the key take-home is that we have deeply disturbed it through breaking into one of its important carbon reservoirs. We've additionally clobbered limestones for cement production, too. In doing these things, we have awoken a sleeping giant. What must be done to persuade us that it needs to be put back to sleep?
Cartoon summary to counter the myth
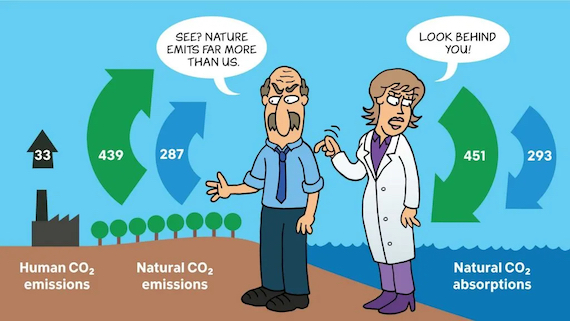
This Cranky Uncle cartoon depicts the "Cherry picking” fallacy for which the climate myth "Human CO2 emissions are small" is a prime example. It involves carefully selecting data that appear to confirm one position while ignoring other data that contradicts that position. Source: Cranky Uncle vs. Climate Change by John Cook. Please note that this cartoon is illustrative in nature and that the numbers shown are a few years old.
Last updated on 17 September 2023 by John Mason. View Archives


In terms of identifying MM Co2 emissions, how should the CO2 exhaled by the planet's population be counted? Should CO2 emissions resulting from farming, crop or livestock, be counted as MM or natural? Same question for CO2 generated from natural decomposition on our world's landfills. Human waste, treated in sewage plants and piped into rivers and oceans, generates CO2 - natural or anthropogenic? Should the definition of MM Co2 be limited to only that which exits a tail pipe or smoke stack? Even if all CO2 emissions from burning fosil fules could be sharply curtaild or eliminated through sequestration, each year there are more people on the planet, and with each year life expectancey is longer. We all need to eat and breath and as a consequence of life need excrete waste. Surely all sources of MM Co2 should be considered and counted in an appropriate way.
[TD] See "Does Breathing Contribute to CO2 Buildup in the Atmosphere?" It has both Basic and Intermediate tabbed panes.
toolate: As the mod's suggested link points out, respiration doesn't really have a net impact. The domesticated ruminant (eg cows, sheep, goats) population is another matter though - entric fermentation of plant matter in their stomachs generates methane, a potent GHG.
The chart at the top tells me that vegetation and land, plus the oceans absorb 17 more gigatons than they emit. Assuming we can't do much about the oceans, all we need to do is increase veg&land absorption by 12 gigatons to balance human production of CO2!
Well mushrumps, I have made a mess of this sort of calculation in past but lets see how I go. The difference between emissions and absorption of land/vege is 11Gt. Land area of earth is 150,000,000 km2. 1/3 is desert, so non-desert is 100,000,000 or .1Gkm2. So land/vege currently is moping up 110 tonne/km2. To mop up an extra 17Gt at current rate, then need 17G/110 = 150,000,000km. That's current area of planet. Cant plant that much forest. Looks like a challenging problem to me.
One other little gotcha is that turning desert/grassland to forest say reduces the albedo of the planet - it doesnt reflect as much radiation to space but I think that would be a minor concern.
According to the IPCC report Table 1. published in 2001, 98.5% of all CO2 is absorbed, not 40%. The charlatan IPCC since removed that table.
CO2 is CO2 whether from man or nature; someone had to lay wake at night, probaly on drugs to say less CO2 from Man gets absorbed.
Table 1. Global Sources and Absorption of CO2
Carbon Dioxide: Natural Human Made Total Absorption
Annual Million Tonnes 770,000 23,100 793,100 781,400
% of Total 97.1% 2.9% 100% 98.5%
Source: Intergovernmental Panel on Climate Change, Climate Change 2001: The Scientific Basis (Cambridge, UK Cambridge University Press, 2001), p. 188.)
[JH] If you continue to lace your comments with snark and absurd accusations, they will be summarily deleted.
Please note that posting comments here at SkS is a privilege, not a right. This privilege can be rescinded if the posting individual treats adherence to the Comments Policy as optional, rather than the mandatory condition of participating in this online forum.
Please take the time to review the policy and ensure future comments are in full compliance with it. Thanks for your understanding and compliance in this matter.
Bob Ashworth @281, what appears on page 188 of the IPCC TAR working group 1 is Fig 3.1:
The units used are Petagrammes of Carbon (= Gigatonnes Carbon), and in none of the four parts of the figure are values matching those you show. More imporantly, in Fig 3.1 B, the human perturbation is shown to clearly dominate the net natural fluxes, a fact that lead the IPCC to write:
And as you add your own little conspiracy theory to your misrepresentation of the IPCC TAR, here is a direct copy of the original report as published, demonstrating that as published the IPCC TAR agreed with the view presented in the OP above.
Finally, for good measure there is a table 3.1 in the IPCC report, appearing on page 190, which reads:
(Sorry for loss of formatting.)
Bob Ashworth: I don't see that "Table 1" on page 188 of Chapter 3 ("The Carbon Cycle and Atmospheric Carbon Dioxide") of the IPCC's TAR WG1 "The Scientific Basis." Nor are there any results from searching for the exact quoted phrase "Global Sources and Absorption of CO2." Are you claiming that the IPCC does not have that table in its post-2001 reports, or are you claiming that the IPCC removed that table from its 2001 (TAR) report after final publication? Perhaps instead that table was in only a preliminary draft of the report (which was not published because, um, it was preliminary. Duh.).
Where is there any statement by anybody, that less anthropogenic than natural CO2 gets absorbed?
Bob, did you not read the article or were you not able to understand it?
Yes, much more CO2 is released by natural sources than human industry. We all know that. The article says it.
However, the 'conclusion' you draw from this is just nonsense. A>B, therefor A+B cannot be greater than C? Natural CO2 emissions (A) and absorption (C) are roughly in balance. Ergo, the addition of CO2 from human industry (B) tips total emissions over total absorption and causes atmospheric CO2 to increase. Put another way: If, as you proudly say, 98.5% of total emissions are being absorbed, then 1.5% aren't being absorbed. Clearly, without the extra 2.9% from human emissions there would not be 1.5% in excess of absorption and atmospheric levels would not be increasing. Ergo, human CO2 emissions are causing atmospheric CO2 levels to go up.
Tom Curtis @ 273, in order to accurately determine whether the co2 leads or lags temperature, should you not be taking the fourier transform of each data set to accurately determine the phase relationship? It just seems to me looking at your graph (casually eyeballing it), looks like there is a slight phase shift with co2 lagging temp.
[PS] Please do not let this discussion of CO2 lags/leads relationships wander off onto topics discussed in detail on "CO2 lags temperature" or "CO2 increase is natural, not human caused". It is very important to note that Tom has detrended the series because he is looking for change in CO2 in response to a temperature change. Ie Co2 is both a forcing and a feedback. As feedback it does of course lag temperature. Note also that the feedback CO2 is small (8ppm) cf forcing (~100ppm). Please take further discussion to a more appropriate place.
this article is very informative showing how humans are contributing to carbon emissions in to our atmosphere. I would be interested in seeing a more complex version of this showing exactly where natural emissions and man made go.
Can you be more specific about you want? The gory detail can be found in Chapter 6 of the IPCC AR5 WG1 report.
According to some reports, we didn't emit more Carbon dioxide in 2015 than in 2014. Perhaps our output has leveled off or may even decrease as more and more energy saving, renewable generation and a flat economy take hold. I find this frightening. If you look at the Mana Loa Carbon dioxide site for April, Carbon dioxide went up 4.16ppm despite this lack of increased carbon output. All things being equal one would have expected, possibly, a 2.5ppm increase. Apparently all things are not equal. Is this some effect of the strong El Nino we experienced or have one or more carbon sinks started to shut down. If this continues to the end of 2016 and into 2017, we just may be in a spot of bother. All things being equal, we would expect the line to revert to the long term increase and should see some quite small increases on into 2017.
william
I would think its most likely an effect of El Nino. Even if carbon sinks start to shut down, they wont be that precipitous.
William,
Most likely the soil causing it. That's good news and bad news. The good news is that it is reversable. The bad news is that we are fairly unlikely to do so. As although it really is easily reversable, there is a huge institutional resistance to even trying, and actually the trends are to accelorate it rather than mitigate it.
Everyone on the world needs to glow at least 10 tree in his/her life. Assume only half of population can grow the trees for some reasons. The current population is 7.4 billions. Then we have 3.7 billions of people grow the trees, eventually, we have more 37 billions of tree. Each big trees can absorb 1 ton of carbon dioxide a year. Each year, 370 billions of carbon dioxide will be absorbed by trees. And we have schedule to control the tree, say to cut away the old trees, to collect the wood (solid carbon oxide) as recycle, reusable materials. The next thing we need to do is to get rid the dairy farm. As we know, the green effect of the methane is 12 times of CO2. A dairy cow can produce 110kg CH4 a year. Some researchs said that cow milk is not for human. Some countries not rely on the cow milk. I think these two method can improve the green house effect.
mr_alanng - I think it would by a lot simpler to just get off using fossil fuels rather than trying to sequester CO2. Also, while methane is an issue, it is less than 30% of total forcing from CO2 because the emissions are far smaller.
" Some researchs said that cow milk is not for human."
I dont think any food is "for human" except breast milk but evolution has equipped us to use it. The gene for lactase persistance is highly selected for since the paleolithic particularly in european populations. Ie once you had settled agricultural, humans with lactase persistance survived and bred better than those without.
Your citation to the IPCC AR4 Figure 7.3 seems to be incorrect. The figure shown is shown here: http://www.ipcc.ch/pdf/assessment-report/ar4/wg1/ar4-wg1-chapter7.pdf
This figure states different numbers from yours. And I cannot find the 29 Gt/yr figure anywhere.
Any further info or clarification is appreciated.
dcordell @293, I think you will find that the figure above shows the fluxes in Gigatonnes of CO2, whereas the IPCC figure shows it in Gigatonnes of Carbon. The fluxes from right to left in GtC are:
7.9, 119.7, 122.7, 90.5 and 92.2
According to the IPCC AR4 Fig 7.3 they are 8, 119.6, 122.6, 90.6 and 92.2, with the differences being down to rounding.
Hi all. I've posted hardly at all on this site due to time constraints. However, I have read the first page and the last page very carefully.
My predilection is that AGW is probably happening, but that mankind's affect [effect?] on the climate is not catastrophic.
I would like to point out that there are, in my opinion, three sides to the AGW question as it pertains to CO2 emitted by humans. There are those who believe in the "consensus" that humans are forcing the climate. There are those who deny that the human influence on the climate is large enough to force it.
There is a third group, those people who do not know which side of this matter is correct, and who are looking for truth.
Anyhow... here's the background, followed by my question.
I first started reading up on a related thread here on SkepSci...
https://www.skepticalscience.com/argument.php?p=25&t=1232&&a=18#comments
...on Page 1 of that thread, back in 2007, is the argument that warming is likely to be causing CO2 release. This argument holds, as I understand it, that mankind, while emitting a lot of CO2, is not the major CO2 emitter on the planet, but that the current warming cycle is releasing more naturally sequestered carbon into the atmo than mankind is emitting.
I understand the argument that it is thought that the minsiscule amount of CO2 that is emitted by mankind is forcing the warming, becasue of a logarithmic relationship, but the apparent leverage of that warming has not yet been proven. My understanding is that CO2 on forces the water vapor cycle in some fashion. Thus, less and less of a percentage of human emitted CO2 has a greater and greater effect on the climate.
My question is this: Is this the proper page/thread to discuss the 'Warming is Releasing' argument?
*********************************
BTW, I did notice one comment on page one, even though the comments were made back in 2008.
Mizimi #30: "It's a complex subject, [fraught] with difficulties - but ... deal with overpopoulation and the 'global warming problem' will fade away."
[TD] I turned your link into a link; in future please do that yourself with the link tool when you write your comment.
#291 mr_alanng
"Each big tree can absorb 1 ton of carbon dioxide a year."
Very few people would disagree that planting trees is a good idea to ameliorate the effects of burning fossil fuels. Here's a popular telling of the carbon sequestration available in a forest:
"'An approximate value for a 50-year-old oak forest would be 30,000 pounds of carbon dioxide sequestered per acre,' said Timothy J. Fahey, professor of ecology in the department of natural resources at Cornell University. 'The forest would be emitting about 22,000 pounds of oxygen.'"
http://www.nytimes.com/2012/12/04/science/how-many-pounds-of-carbon-dioxide-does-our-forest-absorb.html
30,000 pounds is 15 short tons. 15 short tons is 13.6 metric tonnes.
Information on forest density is here:
https://www.nrs.fs.fed.us/pubs/4580
I'm afraid that your figure is way too high.
JohnFornaro: Your understanding that "the current warming cycle is releasing more naturally sequestered carbon into the atmo than mankind is emitting" is incorrect. As is explained by the post we are commenting on right now, the naturally sequestered carbon (sequestered as "fossilized" substances that we use as fuels) is being released by humans burning those fossil fuels, thereby putting carbon dioxide and other greenhouse gasses into the atmosphere.
The amount we thereby release is not "miniscule" in the context that matters for warming. The amount we release is enough to outstrip the abilities of the natural sinks to absorb it. Consequently, humans are responsible for 100% of the increase in CO2 over at least the past 60 years, and nearly that percent since about 1850.
Please read the Basic tabbed pane at the top of this page, then flip to the Intermediate tabbed pane and read that.
JohnFornaro, for more details, please also read these posts:
JohnFornaro, the claim you read that "the minsiscule amount of CO2 that is emitted by mankind is forcing the warming, becasue of a logarithmic relationship... Thus, less and less of a percentage of human emitted CO2 has a greater and greater effect on the climate" is incorrect.
First: As I explained in my previous two replies to you, the CO2 emitted by mankind is not "miniscule," because what matters for warming is that humans are responsible for 100% of the rise in atmospheric total CO2, and the rise in that total has been more than 30% since 1850. CO2 emissions do correlate well with total atmospheric level, and the causal link is provided by the evidence described in the original post at the top of the page you are reading right now. (CO2 measurements are indeed reliable.) It is the increase in the amount of CO2 in the atmosphere that matters, not the proportion of CO2 in the atmosphere relative to other gases.
Second: The argument you cited has the logarithmic effect backward. An increase in the absolute amount (number of molecules) of CO2 in the atmosphere has less, not more, of an effect the more CO2 already is in the atmosphere. But scientists always take that into account, by referring to the (nearly) identical amount of warming from the absolute amount of CO2 doubling, regardless of whether the initial (pre-doubling) amount was large or small.
JohnFornaro @, if you look at the increase of atmospheric CO2 concentration during past warming events and use those increases to predict the modern CO2 increase, the maximum increase expected for the current warming is about 10-20 ppmv. This is most obvious in the change between glacial and interglacial shows a change in atmospheric CO2 of 15.8 +/- 0.6 ppmv/oC (Epica Dome C, 2 StDev confidence interval). Given the current increase of about 1oC over the preindustrial average, that would lead to an expectation of a 16 ppmv increase in atmospheric CO2.
That is likely an overestimate given that the long intervals involved allow time for slow processes (such as much of the tropical forest turning into open savannah and vice versa) to take place. Comparison with the CO2 increase over the MWP which, globally, was nearly as hot as the 1990s, shows that short term processes such as would have had an influence on 20th century CO2 levels result in even smaller relative increases in CO2 concentration:
That's not the only evidence against the idea that the modern CO2 increase is driven by the temperature increase, but it should be sufficient.