


 Arguments


CO2 lags temperature - what does it mean?
What the science says...
| Select a level... |
 Basic
Basic
|
 Intermediate
|
 Advanced
| ||||
|
CO2 didn't initiate warming from past ice ages but it did amplify the warming. In fact, about 90% of the global warming followed the CO2 increase. |
|||||||
Climate Myth...
CO2 lags temperature
"An article in Science magazine illustrated that a rise in carbon dioxide did not precede a rise in temperatures, but actually lagged behind temperature rises by 200 to 1000 years. A rise in carbon dioxide levels could not have caused a rise in temperature if it followed the temperature." (Joe Barton, US House of Representatives (Texas) 1985-2019) - Full Statement
At a glance
Antarctic ice-core data today provide a continuous record on temperature and atmospheric composition that goes back for some 800,000 years. The data track the last few glacial periods and their abrupt endings, with rapid transitions into mild interglacials. But in some of the ice-cores, temperature rises first and is followed, a few hundred years later, by rising carbon dioxide (CO2) levels.
Certain purveyors of climate-myths seized on this observation, claiming it to be “proof” that carbon dioxide doesn't cause climate change. Wrong, wrong, wrong. But how? The answer lies in a beer-can.
In fact, you can do this one yourself. You need two cans of any fizzy beer. On a nice summer's day, take one out of the fridge and place it outside in direct sunshine for a few hours. Leave the other where it is. Then open the two at the same time. The warm one will froth like mad, half-emptying the can and making a mess. What is left in the can will be horrible and flat. Conversely, the one straight from the fridge will just give a “pfft” noise and will be pleasant to drink, being cool and fizzy.
What's that got to do with this myth? Well, you have just demonstrated an important point about the solubility of CO2 in water. CO2 gives fizzy drinks their fizz and it is far more soluble in colder water. As the water warms, it cannot hold onto as much CO2 and it starts to degas. Hence that flat lager.
Exactly the same principle applies to the oceans. When global warming is initiated, both land and the oceans start to warm up. On land, permafrost starts to thaw out, over vast areas. Carbon dioxide (and methane) are released, having been trapped in that permafrost deep-freeze for thousands of years. At sea, that “warm beer effect” kicks in. Thanks to both processes, atmospheric CO2 levels rise in earnest, amplifying and maintaining the warmth. That rise in CO2 thereby caused more of the gas to be released, warming things up yet more in a vicious cycle, known as a positive feedback. Other feedbacks kick in too: for example as the ice-sheets shrink, their ability to reflect Solar energy back out to space likewise decreases, so that heat is instead absorbed by Earth’s surface.
The trigger for the initial warming at the end of an ice-age is a favourable combination of cyclic patterns in Earth's orbit around the Sun, leading to a significant increase in the solar energy received by Earth's Northern Hemisphere. That's no secret. Glacial-interglacial transitions are caused by several factors working in combination – triggers and feedbacks. We've understood that for a long time.
And when you think about it, saying CO2 lagged temperature during glacial-interglacial transitions so cannot possibly be causing modern warming is a bit like saying, “chickens do not lay eggs, because they have been observed to hatch from them".
Please use this form to provide feedback about this new "At a glance" section. Read a more technical version below or dig deeper via the tabs above!
Further details
That CO2 can lag behind but amplify temperature during a glacial-interglacial transition was in fact predicted as long ago as 1990. In the paper The Ice-Core Record: Climate Sensitivity and Future Greenhouse Warming by Claude Lorius and colleagues published in the journal Nature in 1990, a key passage reads:
"The discovery of significant changes in climate forcing linked with the composition of the atmosphere has led to the idea that changes in the CO2 and CH4 content have played a significant part in the glacial-interglacial climate changes by amplifying, together with the growth and decay of the Northern Hemisphere ice sheets, the relatively weak orbital forcing and by constituting a link between the Northern and Southern Hemisphere climates."
This was published over a decade before ice core records were accurate enough to confirm a CO2 lag. We now know that CO2 did not initiate the warming from past ice ages but it did amplify the warming. In fact, about 90% of the global warming followed the CO2 increase.
Antarctic ice cores reveal an interesting story, now going back for around 800,000 years. During this period, changes in CO2 levels tend to follow changes in temperatures by about 600 to 1000 years, as illustrated in Figure 1 below. This has led some to disingenuously claim that CO2 simply cannot be responsible for the current global warming. Unsurprisingly, such a claim does not tell the whole story.
Figure 1: Vostok ice core records for carbon dioxide concentration and temperature change.
The initial change in temperature as an ice-age comes to an end is triggered by cyclic changes in Earth’s orbit around the sun, affecting the amount of seasonal sunlight reaching Earth’s surface in the Northern Hemisphere. The cycles are lengthy: all of them take tens of thousands of years to complete.As both land and oceans start to warm up, they both release large amounts of CO2 into the atmosphere, from melting permafrost and from warming ocean water, since CO2 solubility in water is greater in cold conditions. That release enhances the greenhouse effect, amplifying the warming trend and leading to yet more CO2 being degassed. In other words, increasing CO2 levels become both the cause and effect of further warming. Once started, it’s a vicious, self-reinforcing cycle - an excellent example of what science refers to as a positive climate feedback.
Indeed, such positive feedbacks are necessary to complete the shifts from glacial to interglacial conditions, since the effect of orbital changes alone are too weak to fully drive such variations. Additional positive feedbacks which play an important role in this process include other greenhouse gases like methane - you may have seen videos of that gas bubbling up through icy lakes in permafrost country and being ignited. Changes in ice sheet cover and vegetation patterns determine the amount of Solar energy getting absorbed by Earth’s surface or being reflected back out to space: decrease an ice-sheet’s area and warming will thereby increase.
The detailed mechanisms for the above general pattern have of course been investigated. In a 2012 study, published in the journal Nature (Shakun et al. 2012), Jeremy Shakun and colleagues looked at global temperature changes at the commencement of the last glacial-interglacial transition. This work added a lot of vital detail to our understanding of the CO2-temperature change relationship. They found that:
1) The Earth's orbital cycles triggered warming in the Arctic approximately 19,000 years ago, causing large amounts of ice to melt, flooding the oceans with fresh water.
2) This influx of fresh water then disrupted ocean current circulation, in turn causing a seesawing of heat between the hemispheres.
3) The Southern Hemisphere and its oceans warmed first, starting about 18,000 years ago. As the Southern Ocean warms, the solubility of CO2 in water falls. This causes the oceans to give up more CO2, releasing it into the atmosphere.
4) Finally, CO2 levels may lag temperature in some ice-core records from Antarctica, but in some other parts of the world the reverse was the case: temperature and CO2 either rose in pace or temperature lagged CO2. Figure 2 demonstrates this graphically and shows how things are never as simplistic as purveyors of misinformation would wish.
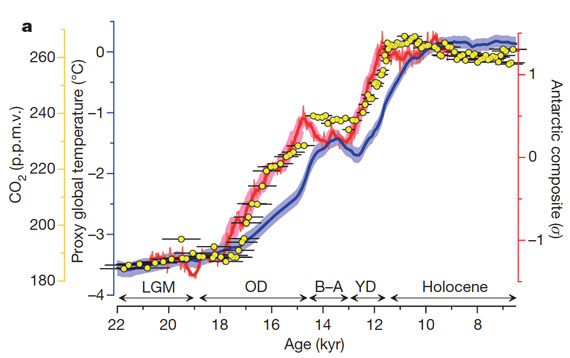
Figure 2: Average global temperature (blue), Antarctic temperature (red), and atmospheric CO2 concentration (yellow dots). Source.
Last updated on 14 February 2023 by John Mason. View Archives


dwm wrote "3. In no way did I ever imply that co2 contributed by man does not contribute to warming. We should all know, however, that it would not contribute to much more than 1 degree celcius of warming this century by itself without any feedback loop from water vapor, so to suggest otherwise would be disingenious."
Has anybody suggested otherwise?
dwm wrote "This chart was used for years to prove the driving effect co2 has on temperature,"
This is simply incorrect, the data shown in the chart provides evidence that CO2 is a greenhouse gas that can act as a feedback mechansim (amplifying the effects of orbital forcing). This is very clearly stated in the article above.
Nobody is claiming that CO2 forcing DRIVES climate change on that particular timescale, so you are just making a straw man argument.
"Regarding the variability of solar energy reaching the earth and whether it is sufficient to cause the warming patterns shown in this chart, I disagree."
Fine, care to provide any evidence to support your disagreement with the scientific mainstream on this one, some calculations perhaps?
(-snip-). "History", (-snip-), is anything for which there exists a record. Ice cores make history.
This chart was used for years to prove the driving effect co2 has on temperature, and only after the accuracy of the dating was improved, showing that the co2 increases actually lagged warming, did explainations such as this article begin to evolve.
(-snip-).
[DB] Inflammatory tone snipped (twice); sloganeering snipped.
dwm, I suspect you are using the refresh or back buttons on your browser, which are resulting in reposts of your previous messages.
I don't know why this board sometimes double posts my posts, some kind of feedback loop?
Happy reading:
Using the oceans as a calorimeter to quantify the solar radiative forcing
JOURNAL OF GEOPHYSICAL RESEARCH, VOL. 113, A11101, doi:10.1029/2007JA012989, 2008
Empirical evidence for a celestial origin of the climate oscillations and its implications
Journal of Atmospheric and Solar-Terrestrial Physics (2010)
Solar activity and Svalbard temperatures
Advances in Meteorology Volume 2011 (2011)
[PS] Fixed link (I hope)
dwm - the double posting is caused by your use of the refresh and/or back buttons on your browser.
None of the papers you mention show that solar forcing is strong enough to explain the variations in temperature over the last 400,000 years, specifically the transitions from glacial to interglacial conditions. If you disagree, give page numbers and direct quotations from the paper.
dwm - let's see if I can get a clearer understanding of your issue. I believe that you agree with the mainline science in that:
1/ Increase of CO2 in atmosphere at the moment is due to our emissions though in the glacial cycle it was outgassing from the ocean as temperature warmed.
2/ That increased CO2 does cause warming (and presumably the corallary that reducing CO2 cools the planet).
3/ That a no-feedback warming would be about 1 degree but the effect is amplified by feedback (including water vapour but also albedo).
Then we have the statement: "Since you admit to the fact that the amount of solar radiation the earth receives is variable/cyclical, why assume anything other than that (solar) for the changes in temperature, which then cause co2 to go up or down accordingly?"
Since you agreed that increased CO2 increases temperature, this is a strange statement to make. You claim "deglaciation" (by which I assume you mean the glacial cycle) is offtopic. However, the relationship of CO2 during the glacial cycle is the topic of this article so, as one of the moderators of this site, it is ontopic. Trust me on this. (However, argument that current climate change is caused by the sun are off topic and go to the topic that I pointed out above).
So to answer your question, "why assume anything other than the sun...", implies you think the graph excludes CO2 having anything to do with glaciation cycle. Beyond the difficulties in making the numbers work, there are two other reasons for assuming something beyond the sun that I can think of.
1/ If the glacial cycle is only about change in solar (plus its water vapour and albedo feedbacks), then why are NH and SH glaciations not anti-phased? The CO2 and to lesser extent CH4 are well mixed GHGs which contribute.
2/ The Milankovich cycles have been around a long time and yet we dont get the big glacial cycle till the Pleistocene. Easier to explain when look at earlier CO2 levels.
Finally note the in the PETM, CO2 increase preceded warming so closest analogue to the current situation.
An interesting collection of denialist writing being linked @430 (Shaviv, Scarfetta & Solheim-Stordahl-Humlum). I'm not sure what we are supposed to make of them.
The different ilk of "It's the sun wot done it" messages are together rather contradictory. Shaviv's the one who tries to demonstrate ocean heating has an 11-year cycle, good ole Scarfetta fits global temperature to pretty-much every pulse-beat in the solar system with the one exception of the 11-year solar cycle, and the not-to-be-outdone Humlum in that linked paper fits Svalbard temperatures to the duration of the previous solar cycle.
And the other puzzle is - What has this collection of tosh got to do with the subject of CO2 lagging temperature? Anybody any ideas?
I asked @433 "Anybody any ideas?" It appears from the comments @ 434, 435 & 436 that dwm's answer to this question is "No. I have no idea whatever."
This still may not be the definitive answer to my question (dwm has not shown here much skill in providing such answers, even when well positioned to do so), so if anybody else has any ideas, I would be happy to learn of them.
Another naive question, please. When I come across contrarian arguments in a policy discussion, I try to check the relevant science; about half the time I come away thinking the situation is even worse than I had before investigating. Here, I knew gas solubility goes down with temperature and Milankovitch cycles are completely different "drivers" from digging up coal from the Carboniferous. So the "lag" argument just reminds me of the worrying feedbacks from more CO2 leaving the oceans (and from changes in polar albedo). I presume the oceanic CO2 feedback is not included in Transient Climate Response figures - but is it generally included in ranges of Equilibrium Climate Sensitivity we find in AR5? (I know I could read AR5 more thoroughly myself, but thought it might be a question in other people's minds.)
And possibly related to that: some graphs showing temperature before the Cenozoic (the last 65 million years when temps and CO2 have gradually been falling), suggest global temps are "bistable", with a 25 °C hothouse plateau. Do you know a reason for that or is it an artefact? (Price et al (2013) does not show the plateau.) (And sepculation: If it is a real effect, are we possibly going to tip the world into a situation uninhabiltable by humans but where at least most classes of animals survive?)
Thanks in advance.
Ceddars @435, in answer to your second question, the graph by Scotese that you link to (which is much loved by deniers) is not generated by any proxies. Rather, scotese mapped different rocks known to be formed in particular climate conditions onto maps of the continents in their arrangement at the given time. This provides an approximate measure of the width of various climate zones, which are then equated to a temperature. Thus, Late Carboniferous is shown as having very extensive cold regions at the poles, and is therefore plotted as being cooler than today. In contrast, the Early Carboniferous has no cold zones at the poles, but rather cool temperate zones. Consequently it is mapped as warmer than today, but not very much warmer than today. The Middle Triassic has warm temperate zones at the poles, and is therefore plotted as being much warmer than today, ie, warmer than the Early Carboniferous.
This is a crude measure of temperature, and consequently only resolves (effectively) four climate states - Colder than today, about the same as today, warmer than today, and very much warmer than today. That does not mean temperatures were at precisely 25 C, or 20 C, etc. It only means this method cannot resolve differences in global temperature finer than about 5 C.
What is more, because this method requires mapping "thousands of rock types", it is not even capable of the normal million year plus minimum resolution found in geology. Rather, it resolves in terms of fractions of epochs, ie, 10 to 50 million year intervals. As such it is far inferior to the various proxie based temperature records produced by Dana Royer, both in resolution of temperature, and temporal resolution.
Thanks, Tom. I'll think of that temperature plateau as an artefact, and look for other proxies.
My other question remains. Does it make sense? Is effect of degassed CO₂ released from warming oceans (a) measurable; (b) a substantial feedback; (c) already included in models?
Cedders - the feedbacks that work with the Milankovich cycle are slow. With around 1000 year cycle time, the ocean's wont be outgassing anytime soon. At the moment, oceans are mopping up much of our emissions (See the OA is not okay series for detail). CMIP3 models did not include carbon cycle feedbacks. I believe that some of the CMIP5 model are "earth system" models with these feedbacks included, but they have little impact on what happens in the next 100 years.
As to measurable - Ocean pH and isotopic composition of CO2 in atmosphere would both constrain estimates of outgassing.
Cedders @437, when looking for other proxies, Dana Royer's publication page is a wise place to start. In particular, his 2004 paper with others, uses a dO18 proxy to reconstruct temperatures over the last 500 million years, which is presented below along with the known forcings over that period:
(The image is from a slide for a talk, and presented in a non-peer reviewed article in 2009, but the reconstruction is from the peer reviewed Royer et al (2004).)
That reconstruction has better time resolution than scotese's graph, but the time resolution is still restricted. Consequently Royer (2006), which looks at CO2 concentrations with reference to glacial states at a much higher time resolution is also of interest.
Ceddars @435, supplemental to Scaddenp @438, IF global temperatures had risen by 1 C without any anthropogenic of volcanic increase in CO2, ocean outgassing would have raised CO2 levels by about 10-20 ppmv. The increase in atmospheric concentration from anthropogenic emissions is far greater than that, so CO2 has entered the ocean rather than left it. However, it would have entered it more readilly without the temperature rise, so that if anthropogenic emissions had been the same, but temperature not risen, there would have been about 10-20 ppmv less CO2 in the atmosphere, and correspondingly more CO2 in the ocean.
The consequence is that the reduced capacity of the oceans to absorb CO2 as they warm is not included directly in transient or equilibrium climate response estimates, they are included indirectly for that effect is included in historical rises in CO2 concentration, and partially and in estimates of future rises. There is a slight kicker for simple models that use a linear retained fraction of atmospheric CO2, in that the ability to absorb CO2 will fall with further rises in temperature, but the effect will remain small relative to anthropogenic emissions. It will only result in increases of about 10-30% in CO2 concentration. That works out at about 1 W/m^2 of forcing, or the equivalent of about 0.75 C increase in eqilibrium temperature. So simple models will likely underestimate temperature rises by a small amount. I do not know to what extent GCMs already include the effect.
Thanks, both. I've downloaded the Ocean Acidification booklet and will work my way through it. I'm not a scientist, but to me it looks like the temperature effect (evident from the ice cores) is big enough to consider when looking at saturation of ocean carbon sinks; possibly also to investigate in reducing carbon budgets to fit a concentration pathway. If ECS is defined as equilibrium when holding pCO2 steady, then I presume it's not included there.
Cedders @441, by coincidence, Real Climate has a related thread on past temperatures today, which provides a number of usefull references (if nothing else). Unfotunately the graphic they show for phanerozoic temperatures is that by Robert Rohdes, and is based on Viezer (2000)'s adjusted dO18 without pH adjustment. Ocean pH levels do make a substantial difference, that being the difference between Viezer (2000) and Royer et al (2004).
Also of interest is this temperature reconstruction over the last 3.5 billion years:
(Source)
Again, this is without pH adjustment, so temperatures in some periods should be higher. In particular, temperatures would be appreciably higher in the Archean (up to 2.5 billion years ago), and Proterozoic (2.5 - 0.55 billion years ago). Of course, this has an even lower temporal resolution than does Royer et al (2004), and there are at least two instances of near complete glaciation ("snow ball earth") in the immediate lead up to the phanerozoic, which the resolution is inadequate to capture.
The earth is 600M years old. Do you show CO2 levels for earlier periods than 400K (when the levels were far higher and the earth was far warmer) anywhere on this site?
[PS] your comment tone is bordering on sloganeering. Ie posting long-debunked myths in disguise. If you are genuinely interested in the science, then certainly this is a site to help for instance see "Climate changed before" and "CO2 was higher in the past". Even a cursory read of the appropriate chapters in the IPCC WG1 report will tell you what the science is really saying as opposed to what misinformation sites might claim.
Sorry edgberht, but the Earth is 4.6 billion years old, not 600M years old.
Link to "Lorius 1990" seems broken:
http://pubs.giss.nasa.gov/docs/1990/1990_Lorius_etal.pdf
Is this the one that is intended?
http://pubs.giss.nasa.gov/docs/1990/1990_Lorius_etal_1.pdf
I'm arguing with a couple guys in the comments under George Marshall's excellent video presentation, How to Talk to a Climate Change Denier
One fellow there keeps pointing at this one graph as irrefutable smoking, gun proof that CO2 lags temperature:
LINK
I speculate that this is pretty short-term and in any case we know the source of atmospheric CO2, but can anyone suggest anything more to say about this?
[RH] Shortened url that was breaking formatting.
I'm suspicious of the 'detrend' term written into the CO2 time series, and the fact that your interlocutor is using the HadCRUT3 unadjusted southern hemisphere temps, instead of global.
Pure misinformation. Go to that link and take off the detrend on the CO2 and look at the picture. When you detrend, all you have left is the short-term seasonal wiggle in CO2 caused by the change in winter/summer vegetation primarily in the Northern hemisphere. Southern hemisphere doesnt have same effect (way less land vegetation) so his plot looks like lag. Try it with Northern hemisphere instead. How much effort do you suppose went in constructing such a story and do you think that some could find that accidentally? If the guy created this himself, then I think you are dealing someone who is delibratedly intending to misled with the full knowledge of what they are doing.
Looks like one of the heavily massaged graphs that Smokey/dbs/dbstealey, WUWT moderator and sock puppet extraordinare keeps posting. Congratulate your guy, he's (re) discovered that atmospheric CO2 varies with the growth and die-off of global seasonal vegetation. Which we already knew.
The short term and the use of 'isolate' are the give-aways; removing the long term rise in CO2 and ignoring mass-balance, isotope, oxygen level, and all the other evidence demonstrating an anthropogenic cause for rising CO2.
It's simply amazing how much deliberate effort goes into these denial graphs. At best (!) confirmation bias, searching for a combination that confirms what they believe despite the evidence, or at worst, flatly attempting to lie with a misrepresentation of the data. Really no way to tell which, unless the person presenting this junk is a known lobbyist...
As usual, fellas, your help is much appreciated!