Climate Science Glossary

Term Lookup

Enter a term in the search box to find its definition.

Settings

Use the controls in the far right panel to increase or decrease the number of terms automatically displayed (or to completely turn that feature off).

Term Lookup

Settings


All IPCC definitions taken from Climate Change 2007: The Physical Science Basis. Working Group I Contribution to the Fourth Assessment Report of the Intergovernmental Panel on Climate Change, Annex I, Glossary, pp. 941-954. Cambridge University Press.

Home Arguments Software Resources Comments The Consensus Project Translations About Support

Twitter Facebook YouTube Mastodon MeWe

RSS Posts RSS Comments Email Subscribe


Climate's changed before
It's the sun
It's not bad
There is no consensus
It's cooling
Models are unreliable
Temp record is unreliable
Animals and plants can adapt
It hasn't warmed since 1998
Antarctica is gaining ice
View All Arguments...


Username
Password
New? Register here
Forgot your password?

Latest Posts

Archives

CO2 lags temperature - what does it mean?

What the science says...

Select a level... Basic Intermediate Advanced

CO2 didn't initiate warming from past ice ages but it did amplify the warming.  In fact, about 90% of the global warming followed the CO2 increase.

Climate Myth...

CO2 lags temperature

"An article in Science magazine illustrated that a rise in carbon dioxide did not precede a rise in temperatures, but actually lagged behind temperature rises by 200 to 1000 years.  A rise in carbon dioxide levels could not have caused a rise in temperature if it followed the temperature." (Joe Barton, US House of Representatives (Texas) 1985-2019) - Full Statement

At a glance

Antarctic ice-core data today provide a continuous record on temperature and atmospheric composition that goes back for some 800,000 years. The data track the last few glacial periods and their abrupt endings, with rapid transitions into mild interglacials. But in some of the ice-cores, temperature rises first and is followed, a few hundred years later, by rising carbon dioxide (CO2) levels.

Certain purveyors of climate-myths seized on this observation, claiming it to be “proof” that carbon dioxide doesn't cause climate change. Wrong, wrong, wrong. But how? The answer lies in a beer-can.

In fact, you can do this one yourself. You need two cans of any fizzy beer. On a nice summer's day, take one out of the fridge and place it outside in direct sunshine for a few hours. Leave the other where it is. Then open the two at the same time. The warm one will froth like mad, half-emptying the can and making a mess. What is left in the can will be horrible and flat. Conversely, the one straight from the fridge will just give a “pfft” noise and will be pleasant to drink, being cool and fizzy.

What's that got to do with this myth? Well, you have just demonstrated an important point about the solubility of CO2 in water. CO2 gives fizzy drinks their fizz and it is far more soluble in colder water. As the water warms, it cannot hold onto as much CO2 and it starts to degas. Hence that flat lager.

Exactly the same principle applies to the oceans. When global warming is initiated, both land and the oceans start to warm up. On land, permafrost starts to thaw out, over vast areas. Carbon dioxide (and methane) are released, having been trapped in that permafrost deep-freeze for thousands of years. At sea, that “warm beer effect” kicks in. Thanks to both processes, atmospheric CO2 levels rise in earnest, amplifying and maintaining the warmth. That rise in CO2 thereby caused more of the gas to be released, warming things up yet more in a vicious cycle, known as a positive feedback. Other feedbacks kick in too: for example as the ice-sheets shrink, their ability to reflect Solar energy back out to space likewise decreases, so that heat is instead absorbed by Earth’s surface.

The trigger for the initial warming at the end of an ice-age is a favourable combination of cyclic patterns in Earth's orbit around the Sun, leading to a significant increase in the solar energy received by Earth's Northern Hemisphere. That's no secret. Glacial-interglacial transitions are caused by several factors working in combination – triggers and feedbacks. We've understood that for a long time.

And when you think about it, saying CO2 lagged temperature during glacial-interglacial transitions so cannot possibly be causing modern warming is a bit like saying, “chickens do not lay eggs, because they have been observed to hatch from them".

Please use this form to provide feedback about this new "At a glance" section. Read a more technical version below or dig deeper via the tabs above!


Further details

That CO2 can lag behind but amplify temperature during a glacial-interglacial transition was in fact predicted as long ago as 1990. In the paper The Ice-Core Record: Climate Sensitivity and Future Greenhouse Warming by Claude Lorius and colleagues published in the journal Nature in 1990, a key passage reads:

"The discovery of significant changes in climate forcing linked with the composition of the atmosphere has led to the idea that changes in the CO2 and CH4 content have played a significant part in the glacial-interglacial climate changes by amplifying, together with the growth and decay of the Northern Hemisphere ice sheets, the relatively weak orbital forcing and by constituting a link between the Northern and Southern Hemisphere climates."

This was published over a decade before ice core records were accurate enough to confirm a CO2 lag. We now know that CO2 did not initiate the warming from past ice ages but it did amplify the warming. In fact, about 90% of the global warming followed the CO2 increase.

Antarctic ice cores reveal an interesting story, now going back for around 800,000 years. During this period, changes in CO2 levels tend to follow changes in temperatures by about 600 to 1000 years, as illustrated in Figure 1 below. This has led some to disingenuously claim that CO2 simply cannot be responsible for the current global warming. Unsurprisingly, such a claim does not tell the whole story.

Figure 1: Vostok ice core records for carbon dioxide concentration and temperature change.

The initial change in temperature as an ice-age comes to an end is triggered by cyclic changes in Earth’s orbit around the sun, affecting the amount of seasonal sunlight reaching Earth’s surface in the Northern Hemisphere. The cycles are lengthy: all of them take tens of thousands of years to complete.As both land and oceans start to warm up, they both release large amounts of CO2 into the atmosphere, from melting permafrost and from warming ocean water, since CO2 solubility in water is greater in cold conditions. That release enhances the greenhouse effect, amplifying the warming trend and leading to yet more CO2 being degassed. In other words, increasing CO2 levels become both the cause and effect of further warming. Once started, it’s a vicious, self-reinforcing cycle - an excellent example of what science refers to as a positive climate feedback.

Indeed, such positive feedbacks are necessary to complete the shifts from glacial to interglacial conditions, since the effect of orbital changes alone are too weak to fully drive such variations. Additional positive feedbacks which play an important role in this process include other greenhouse gases like methane - you may have seen videos of that gas bubbling up through icy lakes in permafrost country and being ignited. Changes in ice sheet cover and vegetation patterns determine the amount of Solar energy getting absorbed by Earth’s surface or being reflected back out to space: decrease an ice-sheet’s area and warming will thereby increase.

The detailed mechanisms for the above general pattern have of course been investigated. In a 2012 study, published in the journal Nature (Shakun et al. 2012), Jeremy Shakun and colleagues looked at global temperature changes at the commencement of the last glacial-interglacial transition. This work added a lot of vital detail to our understanding of the CO2-temperature change relationship. They found that:

1) The Earth's orbital cycles triggered warming in the Arctic approximately 19,000 years ago, causing large amounts of ice to melt, flooding the oceans with fresh water.

2) This influx of fresh water then disrupted ocean current circulation, in turn causing a seesawing of heat between the hemispheres.

3) The Southern Hemisphere and its oceans warmed first, starting about 18,000 years ago. As the Southern Ocean warms, the solubility of CO2 in water falls. This causes the oceans to give up more CO2, releasing it into the atmosphere.

4) Finally, CO2 levels may lag temperature in some ice-core records from Antarctica, but in some other parts of the world the reverse was the case: temperature and CO2 either rose in pace or temperature lagged CO2. Figure 2 demonstrates this graphically and shows how things are never as simplistic as purveyors of misinformation would wish.

Shakun Fig 2a 

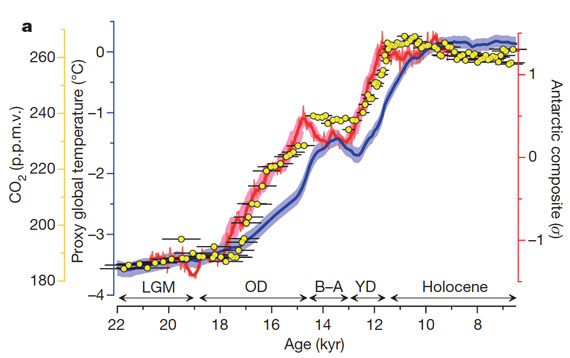
Figure 2: Average global temperature (blue), Antarctic temperature (red), and atmospheric CO2 concentration (yellow dots). Source.

Last updated on 14 February 2023 by John Mason. View Archives

Printable Version  |  Offline PDF Version  |  Link to this page

Argument Feedback

Please use this form to let us know about suggested updates to this rebuttal.

Related Arguments

Further reading

That CO2 lags and amplifies temperature was actually predicted in 1990 in a paper The ice-core record: climate sensitivity and future greenhouse warming by Claude Lorius (co-authored by James Hansen):

"Changes in the CO2 and CH4 content have played a significant part in the glacial-interglacial climate changes by amplifying, together with the growth and decay of the Northern Hemisphere ice sheets, the relatively weak orbital forcing"

The paper also notes that orbital changes are one initial cause for ice ages. This was published over a decade before ice core records were accurate enough to confirm a CO2 lag (thanks to John Mashey for the tip).

Also, gotta love this quote from Deltoid in answer to the CO2 lag argument: See also my forthcoming paper: "Chickens do not lay eggs, because they have been observed to hatch from them".

Further viewing

Denial101x video

Myth Deconstruction

Related resource: Myth Deconstruction as animated GIF

MD Lag

Please check the related blog post for background information about this graphics resource.

Comments

Prev  6  7  8  9  10  11  12  13  14  15  16  17  18  19  20  21  22  23  24  25  Next

Comments 376 to 400 out of 653:

  1. David Sanger @373, I have not read the paper which, as you say, is behind a paywall, but: 1) They appear to be ignoring Shakun et al, 2012 on the issue of CO2 lag; 2) They are absurdly wrong on the relation between CO2 increase and anthropogenic emissions (I also recommend Climate Change Cludoe: Anthropogenic CO2 on this issue); and 3) Arguments that ocean warming has called recent temperature rise generally start by assuming all ocean warming is natural, and then establishing a correlation between ocean temperature rises and global temperatures rises. As the ocean constitutes 705 of the Earth's surface, unsurprisingly they find a large correlation; but the argument is entirely circular. They assume what they set out to prove when they assume the ocean temperature increase is not caused by global warming. All three authors have a past history of exactly that sort of argument, so I do not expect anything different this time around.
  2. Thanks. I'm quite newly involved in climate issues and when I see a reference like this posted in a skeptic site always want to read the original paper (and any discussion here) to see if it really says what they say it does. Often a quote is pulled out of context where the authors meant something quite different indeed. When a paper is hidden behind a pay wall it is difficult and frustrating since there is no way to evaluate it. If this is really suspect then how can a paper like this be accepted in a journal? Here's a graph from the study (similar to ones I've seen on skeptic sites: It seems to be tracking changes in sea and air temperature and "global CO2". Is there some other process that would present the same seeming correlation and timing but which the authors are missing? As a non-expert it is difficult to counter message like on Watts today without understanding what is going on. Thanks
  3. This seems very similar to earlier effort with same message and also published at GPC. It is discussed at Realclimate here.
  4. David, all that graphic shows is that detrended air temperature, which is mostly ENSO and occasional volcanic influences, is related to detrended CO2 with the annual cycle removed too. So there is a relationship betweent he variability of both graphs, no surprise there. It says absolutely nothing about what is causing the overall rise in either one, though clearly the skeptics would want you to believe that ocean temperature rise is causing CO2 rise. They ignore many things: 1: what is causing ocean temperature to rise? 2: why is ocean pH decreasing, if CO2 is being released from the oceans (which should cause pH to rise)? 3: Where is all our CO2 going? We release ~30GT per year, yet annual CO2 rise is only half that. [the truth is that it is going into the oceans, acidifying them.] 4: As linked above, the chemical signature of the CO2 is that from FF-derived carbon, shown by several independent lines of evidence. So lots of suspension of disbelief required before you can accept the Humlum paper. In fact, I suspect I'll find the suspension of disbelief when watching The Hobbit later this year a whole lot easier!
    Response: TC: Humlum et al, 2012 discusses a number of topics, only one of which is on topic on this thread. Could detailed discussion of the anthropogenic origin of CO2 be moved to the previously suggested thread; and discussion of the ocean as the source of global warming be moved to "Why ocean heat can’t drive climate change, only chase it"

    Thank you.
  5. David Sanger @377, the three authors of the paper are all well known climate change deniers, ie, part of the 1% of climate change scientists who do not agree with the consensus. It is possible that "skeptical" sites are over stating the claims made in the paper, but unlikely they are outright misrepresenting them. Without having read the paper, however, all I can say is that such claims have been made repeatedly before - and always the evidence and reasoning in support of the claims has been dubious at best. In the case of one particular claim, ie, that anthropogenic CO2 has not significantly contributed to increased CO2 levels, the evidence against the claim is so firm that we should greet any paper purporting to prove otherwise with the same astonishment we would greet a paper purporting to re-establish the Ptolemaic (terra-centric)model of the solar system.
  6. David Sanger - and other readers: The simple lesson from this particular paper is this: If someone de-trends the data, as Humlum did in that graph, they are no longer examining the trends, and therefore cannot conclude anything about them. This is actually a fairly common mistake - any number of papers have filtered out the trends, and then attempted to state conclusions about the very data they have excluded from analysis. Very sad...
    Response: [DB] Revised text per request.
  7. scaddenp @378 Thanks for the link. That explain a lot about the context. I should have thought to search the site first for "Humlum" KR @381 So if I understand the graph then he's just showing that (sometimes) if the measured CO2 increases a bit more quickly year over year, then the temperatures increase a bit more compared to the previous year, and if the CO2 increase from year to year is a bit more modest the temperature increase is a bit less (or could actually be a decrease since the y-axes have different zero-lines). Whatever is causing the variability from year to year (even noise?) could then affect both measures in a similar manner. And none of this has anything to do with why either measure is trending upwards. Is that close? skywatcher @379 so would effects of ENSO and volcanic activity account for the seeming lag in the graphs where temperature differentials from the previous year appear to increase or decrease 12 months or so before measured CO2 differentials from the previous year?
  8. David Sanger - this is much easier if you understand that the oceans are Earth's main heat reservoir. Arguably the greatest climatic effect greenhouse gases exert is that they trap more heat in the ocean. During La Nina the oceans accumulate more energy - as heat is buried in the sub-surface ocean, and during El Nino this heat wells to the surface and is smeared across the central and eastern equatorial Pacific. Due to these characteristics, and the surface air-sea exchange of heat, the Earth is cooler-than-average during La Nina, and warmer-than-average during El Nino. But there's more to the story, there are two large competing effects on carbon exchange during ENSO. In a La Nina phase upwelling of acidified deep water along the western coast of North & South America out-gasses CO2 to the atmosphere. But this is more than compensated by the wetter-than-average rainfall which falls over the continents and particularly the tropical river basins of the world. More rainfall over such a vast land area generally means more plant growth and a draw down of atmospheric CO2. During El Nino the much of the continental land surfaces are drier-than-average. This is because the upwelled heat on the Pacific equatorial ocean surface draws moisture away from the continents, and rainfall is focused over the ocean. CO2 out-gassing may shut off, but again this is more than compensated for by land vegetation. As drought sets in on the continents, vegetation dies and CO2 is released back to the atmosphere. Warming air temperatures also elevate respiration which, again, releases more CO2 back to the atmosphere. These natural short-term CO2 fluxes dwarf human fossil fuels emissions, but unlike fossil fuel pollution they do not increase incrementally year after year. It is, of course, more complicated than that. For example the distribution of rainfall is vitally important, but that is the general picture. Armed with that knowledge you can now under see that Humlum & co aren't telling us something we don't already know. They just lack understanding of the physical mechanisms which drive this and, allied to ideological bias, therefore come to conclusions unsupported by the evidence. As for large volcanic eruptions - they can reduce atmospheric CO2 because they stimulate enhanced plant growth on a global scale. This is accomplished by the volcanic aerosols high in the stratosphere increasing light-scattering which more readily penetrates the leaf canopy. In the absence of other limiting factors, more sunlight equals more growth and hence draw down of atmospheric CO2. You can see this in the graph you presented - after the Mt Pinatubo eruption (1991) even the El Nino of 1991-92 saw a decline in atmospheric CO2 - the opposite of the normal response.
  9. David Sanger - some recommended reading: 1. Interannual extremes in the rate of rise of atmospheric carbon dioxide since 1980 - Keeling 1995 2. The Carbon Cycle Response to ENSO: A Coupled Climate–Carbon Cycle Model Study - Jones (2001)
  10. thanks @Rob, clearly explained and the papers were helpful.
  11. David (and others), for a specific response to Humlum et al., 2012, I put up a quick demo of why their method will create misleading results: https://troyca.wordpress.com/2012/08/31/comment-on-the-phase-relation-between-atmospheric-carbon-dioxide-and-global-temperature/
  12. Likely these queries have been asked before, however I can't find a description. My apologies if it's a repeat. (1) re: Figure 1 of the Topic post - what is the current thinking on the mechanism for cooling which seems to precede CO2 decreases? (2) re: Figure 2 - I understand the trigger for warming being able to precede CO2 increase and then the feedback, but why does the Antarctic temp continue to (seemingly) precede CO2 increases even though the GMT lags it? To perhaps save time, I am a skeptic and still officially uncertain on the big picture. But consider myself a true one (i.e. inquiring, open mind rather than with preconceived ideas either way).
  13. opd68, you say you understand how warming can precede rising CO2 but also ask how cooling can precede falling CO2... the two are exactly the same. Atmospheric CO2 levels do not just magically rise and fall on their own... something has to cause them to do so. Temporal causality holds that this cause must precede the effect. Ergo, in the past CO2 levels have risen and fallen in response to orbital solar forcings as described in the article above. Your second question, about Antarctic temperatures, is also covered in the article; "The Earth's orbital cycles trigger the initial warming (starting approximately 19,000 years ago), which is first reflected in the the Arctic. This Arctic warming caused large amounts of ice to melt, causing large amounts of fresh water to flood into the oceans. This influx of fresh water then disrupted the Atlantic Ocean circulation, in turn causing a seesawing of heat between the hemispheres. The Southern Hemisphere and its oceans warmed first, starting about 18,000 years ago. The warming Southern Ocean then released CO2 into the atmosphere starting around 17,500 years ago, which in turn caused the entire planet to warm via the increased greenhouse effect." All this per Shakun et al 2012, which is obviously a very new study and requiring further confirmation. However, there is nothing surprising about some parts of the planet warming faster than others. The solar forcings of the Milankovitch cycles impact specific hemispheres and only have a net effect because of the differing amounts of land in the two hemispheres. CO2, on the other hand, is well mixed throughout the atmosphere and thus impacts the entire planet 'global mean temperature' (presumably your 'GMT').
  14. Thanks CBD although note an underlying frustration. Please note that these are honest questions and not intended to do anything other than improve my own knowledge. So, to clarify, in reference to the first question/response am I correct in saying that there is a solar-related forcing to trigger the upswing, and a (obviously different) solar-related forcing to trigger the downswing? The warming trigger is enough to break the equilibrium and then the temp/CO2 feedback/forcing continues to a higher equilibrium via the process described in the Topic (as you describe also). The cooling trigger is then enough to break from the higher equilibrium and the equal but opposite (?) feedbacks occur until a lower equilibrium is reach. Re: the second question, I both read and understood the Topic, my thinking was more about: (a) after the initial trigger why does the Antarctic temp continue to rise faster than the global average? Once the CO2 kicks in (well-mixed globally as you note) why the continued difference between hemispheres? and (b) the fact that there are (seemingly) a couple of separate warming events or stages - one at 18k yr ago and then another at about 13k yr ago (after a bit of a plateau. In both cases it looks like the Antarctic Temp increase precedes the CO2 increase. Are these actually separate events with separate triggers, or is it just a break in the forcing/feedback cycle, or just not significant given the data/time-scales?
  15. opd68, the 'upswing and downswing solar forcings' are actually just the onset and completion of a single cycle. That is, as the Northern hemisphere tilts more towards the Sun it receives more sunlight and then as the tilt swings back it receives less. I'm not sure what you mean about 'breaking the equilibrium'. By definition if you have a forcing you don't have equilibrium. When the 'sign' of the forcing changes the feedbacks do so as well. There is no 'barrier' which needs to be broken in order for this to happen. There are several reasons Antarctic temps rose faster than the global average. First, it was experiencing warming due to the shutdown of Atlantic circulation (which basically pulls cold water North) plus global warming from rising CO2 levels... A+B > B alone. Second, there is less water vapor in colder climes and thus increased CO2 levels have a greater warming impact in those areas than they do in warm areas. Third, melting ice exposes darker land and ocean beneath... which absorbs more sunlight and thus warms faster than areas which had exposed land/ocean to begin with. As to the 'warming plateau', this period is generally called the Younger Dryas and there are a number of theories on its cause. All involve some other forcing coming in to play and temporarily offsetting the ongoing solar forcing / CO2 & ice feedback trend. It is anomalous compared to most previous interglacial periods and thus generally considered some kind of random (rather than regularly recurring) event... asteroid impact, increased volcanism, huge freshwater Lake Agassiz suddenly draining into the ocean, et cetera. So the warming trend was really a 'single ongoing event'... just temporarily interrupted by something else.
  16. Wonder if anyone has seen this kind of graph purporting to show CO2 lagging temps on interannual timescales in the modern age. http://www.woodfortrees.org/plot/esrl-co2/isolate:60/mean:12/scale:0.25/plot/hadcrut3vgl/isolate:60/mean:12/from:1958 I see that the 5 year trends have been removed, but don't know how to interpret this. CO2 lags temps in the modern day?
  17. barry: short-term variations in CO2 and T are affected by factors other than long-term trends. The short answer is El Nino, and the longer answer is easily found over at RealClimate: El Nino's Effect on CO2 Causes Confusion
  18. barry - I've seen that graph too, mostly at WUWT. As Bob Loblaw noted, it's due to short term ENSO variations. That particular graph has had all long term trend removed (the 'Isolate' command), and has a total range of -0.15 to +0.25 ppm - whereas annual growth of CO2 concentrations is ~2.07 ppm currently, or roughly an order of magnitude greater than these small variations. In other words, it's a graph of noise. Whoever created it was (IMO) on a search for something to confirm their preconceptions, or to mislead others. It's right up there with plotting recent temperature changes on a scale of Kelvin degrees starting at zero - visually convincing of 'skeptic' points, but once you get a good look at the dimensions, well, it's nothing to speak of...
  19. Thanks both.
  20. barry - If you want some fun, take that graph, remove the isolate, normalize to get on the same scale (fractional temperature changes and ~380ppm have different scales), and you get this graph of the relative trends (I took out the CO2 yearly averaging as well, to clarify what we are looking at). That's the real data, the actual information hidden by the rather (IMO) deceptive graph you were shown. There are in fact a few people at WUWT who seem to specialize in those misleading graphs, such as Smokey, as discussed at Tamino's blog.
    Response: [DB] Fixed 2nd link per request.
  21. Videre, you stated on a different thread in your point #2: "the lag problem crops up again because if CO2 lags temperature then it just seems something else traps energy too to start the temperature going up."  No, that is not necessary, as you would know if you actually read this post on the lag so you understand the mechanism, instead of just glancing at the post.  The Milankovich orbital forcing of warming causes more energy to enter the Northern Hemisphere (while reducing the energy entering the Southern Hemisphere) because the Sun's rays enter closer to perpendicular to the Earth's surface in the Northern Hemisphere.  That causes melting of ice and snow, which by leaving bare ground more of the time causes more energy to be absorbed by the ground ("trapped" in a different way than CO2 "traps" energy).  But that's not sufficient to tip the whole system into serious warming. The main mechanism is explained in this post, which you should read carefully.  Note that there are both a Basic tabbed pane and an Intermediate tabbed pane.  Details are in another post on Shakun et al.'s work.

  22. I have always been bothered by the lack of a detailed and convincing explanation for the 100 ky periodicity of the last four ice ages when the periodicity of northern temperate zone insolation intensities from Milankovich cycles (my understanding is that this is the important component of these cycles) is close to 20 ky.  A recent paper in Nature (Vol 500, August 8, 2013, page 190) presents an explicit explanation and also describes how CO2 has a role but is not determinative in ice age/interglacial cycles. What do you people at SkS think about this paper?   

  23. Sorry.  For completeness, the authors on that Nature paper are Ayako Abe-Ouchi, Fuyuki Saito, Kenji Kawamura, Maureen E. Raymo, Jun’ichi Okuno, Kunio Takahashi, and Heinz Blatter.

  24. tcflood - the abstract is here: Abe-Ouchi et al (2013) - Insolation-driven 100,000-year glacial cycles and hysteresis of ice-sheet volume.

    Sounds interesting. Note that it relates to the 100,000-year cycle - as stated in the abstract:

    "Carbon dioxide is involved, but is not determinative, in the evolution of the 100,000-year glacial cycles."

    Your comment omits this crucial bit of information.

  25. RE: 397-399

    Let me try again:

    Here is a paper.

    What is the SkS take on it?

Prev  6  7  8  9  10  11  12  13  14  15  16  17  18  19  20  21  22  23  24  25  Next

Post a Comment

Political, off-topic or ad hominem comments will be deleted. Comments Policy...

You need to be logged in to post a comment. Login via the left margin or if you're new, register here.

Link to this page


The Consensus Project Website

THE ESCALATOR

(free to republish)


© Copyright 2024 John Cook
Home | Translations | About Us | Privacy | Contact Us