Climate Science Glossary

Term Lookup

Enter a term in the search box to find its definition.

Settings

Use the controls in the far right panel to increase or decrease the number of terms automatically displayed (or to completely turn that feature off).

Term Lookup

Settings


All IPCC definitions taken from Climate Change 2007: The Physical Science Basis. Working Group I Contribution to the Fourth Assessment Report of the Intergovernmental Panel on Climate Change, Annex I, Glossary, pp. 941-954. Cambridge University Press.

Home Arguments Software Resources Comments The Consensus Project Translations About Support

Bluesky Facebook LinkedIn Mastodon MeWe

Twitter YouTube RSS Posts RSS Comments Email Subscribe


Climate's changed before
It's the sun
It's not bad
There is no consensus
It's cooling
Models are unreliable
Temp record is unreliable
Animals and plants can adapt
It hasn't warmed since 1998
Antarctica is gaining ice
View All Arguments...


Username
Password
New? Register here
Forgot your password?

Latest Posts

Archives

CO2 lags temperature - what does it mean?

What the science says...

Select a level... Basic Intermediate Advanced

CO2 didn't initiate warming from past ice ages but it did amplify the warming.  In fact, about 90% of the global warming followed the CO2 increase.

Climate Myth...

CO2 lags temperature

"An article in Science magazine illustrated that a rise in carbon dioxide did not precede a rise in temperatures, but actually lagged behind temperature rises by 200 to 1000 years.  A rise in carbon dioxide levels could not have caused a rise in temperature if it followed the temperature." (Joe Barton, US House of Representatives (Texas) 1985-2019) - Full Statement

At a glance

Antarctic ice-core data today provide a continuous record on temperature and atmospheric composition that goes back for some 800,000 years. The data track the last few glacial periods and their abrupt endings, with rapid transitions into mild interglacials. But in some of the ice-cores, temperature rises first and is followed, a few hundred years later, by rising carbon dioxide (CO2) levels.

Certain purveyors of climate-myths seized on this observation, claiming it to be “proof” that carbon dioxide doesn't cause climate change. Wrong, wrong, wrong. But how? The answer lies in a beer-can.

In fact, you can do this one yourself. You need two cans of any fizzy beer. On a nice summer's day, take one out of the fridge and place it outside in direct sunshine for a few hours. Leave the other where it is. Then open the two at the same time. The warm one will froth like mad, half-emptying the can and making a mess. What is left in the can will be horrible and flat. Conversely, the one straight from the fridge will just give a “pfft” noise and will be pleasant to drink, being cool and fizzy.

What's that got to do with this myth? Well, you have just demonstrated an important point about the solubility of CO2 in water. CO2 gives fizzy drinks their fizz and it is far more soluble in colder water. As the water warms, it cannot hold onto as much CO2 and it starts to degas. Hence that flat lager.

Exactly the same principle applies to the oceans. When global warming is initiated, both land and the oceans start to warm up. On land, permafrost starts to thaw out, over vast areas. Carbon dioxide (and methane) are released, having been trapped in that permafrost deep-freeze for thousands of years. At sea, that “warm beer effect” kicks in. Thanks to both processes, atmospheric CO2 levels rise in earnest, amplifying and maintaining the warmth. That rise in CO2 thereby caused more of the gas to be released, warming things up yet more in a vicious cycle, known as a positive feedback. Other feedbacks kick in too: for example as the ice-sheets shrink, their ability to reflect Solar energy back out to space likewise decreases, so that heat is instead absorbed by Earth’s surface.

The trigger for the initial warming at the end of an ice-age is a favourable combination of cyclic patterns in Earth's orbit around the Sun, leading to a significant increase in the solar energy received by Earth's Northern Hemisphere. That's no secret. Glacial-interglacial transitions are caused by several factors working in combination – triggers and feedbacks. We've understood that for a long time.

And when you think about it, saying CO2 lagged temperature during glacial-interglacial transitions so cannot possibly be causing modern warming is a bit like saying, “chickens do not lay eggs, because they have been observed to hatch from them".

Please use this form to provide feedback about this new "At a glance" section. Read a more technical version below or dig deeper via the tabs above!


Further details

That CO2 can lag behind but amplify temperature during a glacial-interglacial transition was in fact predicted as long ago as 1990. In the paper The Ice-Core Record: Climate Sensitivity and Future Greenhouse Warming by Claude Lorius and colleagues published in the journal Nature in 1990, a key passage reads:

"The discovery of significant changes in climate forcing linked with the composition of the atmosphere has led to the idea that changes in the CO2 and CH4 content have played a significant part in the glacial-interglacial climate changes by amplifying, together with the growth and decay of the Northern Hemisphere ice sheets, the relatively weak orbital forcing and by constituting a link between the Northern and Southern Hemisphere climates."

This was published over a decade before ice core records were accurate enough to confirm a CO2 lag. We now know that CO2 did not initiate the warming from past ice ages but it did amplify the warming. In fact, about 90% of the global warming followed the CO2 increase.

Antarctic ice cores reveal an interesting story, now going back for around 800,000 years. During this period, changes in CO2 levels tend to follow changes in temperatures by about 600 to 1000 years, as illustrated in Figure 1 below. This has led some to disingenuously claim that CO2 simply cannot be responsible for the current global warming. Unsurprisingly, such a claim does not tell the whole story.
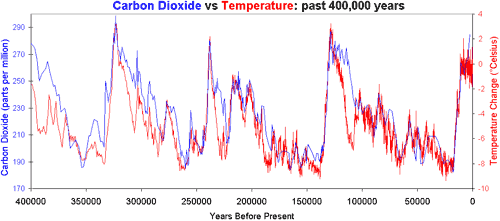
Figure 1: Vostok ice core records for carbon dioxide concentration and temperature change.

The initial change in temperature as an ice-age comes to an end is triggered by cyclic changes in Earth’s orbit around the sun, affecting the amount of seasonal sunlight reaching Earth’s surface in the Northern Hemisphere. The cycles are lengthy: all of them take tens of thousands of years to complete.As both land and oceans start to warm up, they both release large amounts of CO2 into the atmosphere, from melting permafrost and from warming ocean water, since CO2 solubility in water is greater in cold conditions. That release enhances the greenhouse effect, amplifying the warming trend and leading to yet more CO2 being degassed. In other words, increasing CO2 levels become both the cause and effect of further warming. Once started, it’s a vicious, self-reinforcing cycle - an excellent example of what science refers to as a positive climate feedback.

Indeed, such positive feedbacks are necessary to complete the shifts from glacial to interglacial conditions, since the effect of orbital changes alone are too weak to fully drive such variations. Additional positive feedbacks which play an important role in this process include other greenhouse gases like methane - you may have seen videos of that gas bubbling up through icy lakes in permafrost country and being ignited. Changes in ice sheet cover and vegetation patterns determine the amount of Solar energy getting absorbed by Earth’s surface or being reflected back out to space: decrease an ice-sheet’s area and warming will thereby increase.

The detailed mechanisms for the above general pattern have of course been investigated. In a 2012 study, published in the journal Nature (Shakun et al. 2012), Jeremy Shakun and colleagues looked at global temperature changes at the commencement of the last glacial-interglacial transition. This work added a lot of vital detail to our understanding of the CO2-temperature change relationship. They found that:

1) The Earth's orbital cycles triggered warming in the Arctic approximately 19,000 years ago, causing large amounts of ice to melt, flooding the oceans with fresh water.

2) This influx of fresh water then disrupted ocean current circulation, in turn causing a seesawing of heat between the hemispheres.

3) The Southern Hemisphere and its oceans warmed first, starting about 18,000 years ago. As the Southern Ocean warms, the solubility of CO2 in water falls. This causes the oceans to give up more CO2, releasing it into the atmosphere.

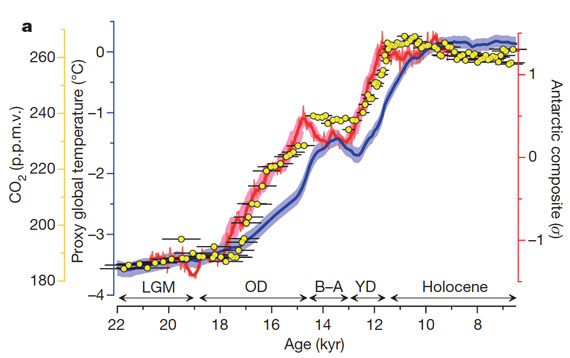
4) Finally, CO2 levels may lag temperature in some ice-core records from Antarctica, but in some other parts of the world the reverse was the case: temperature and CO2 either rose in pace or temperature lagged CO2. Figure 2 demonstrates this graphically and shows how things are never as simplistic as purveyors of misinformation would wish.

Shakun Fig 2a 

Figure 2: Average global temperature (blue), Antarctic temperature (red), and atmospheric CO2 concentration (yellow dots). Source.

Last updated on 14 February 2023 by John Mason. View Archives

Printable Version  |  Offline PDF Version  |  Link to this page

Argument Feedback

Please use this form to let us know about suggested updates to this rebuttal.

Related Arguments

Further reading

That CO2 lags and amplifies temperature was actually predicted in 1990 in a paper The ice-core record: climate sensitivity and future greenhouse warming by Claude Lorius (co-authored by James Hansen):

"Changes in the CO2 and CH4 content have played a significant part in the glacial-interglacial climate changes by amplifying, together with the growth and decay of the Northern Hemisphere ice sheets, the relatively weak orbital forcing"

The paper also notes that orbital changes are one initial cause for ice ages. This was published over a decade before ice core records were accurate enough to confirm a CO2 lag (thanks to John Mashey for the tip).

Also, gotta love this quote from Deltoid in answer to the CO2 lag argument: See also my forthcoming paper: "Chickens do not lay eggs, because they have been observed to hatch from them".

Further viewing

Denial101x video

Myth Deconstruction

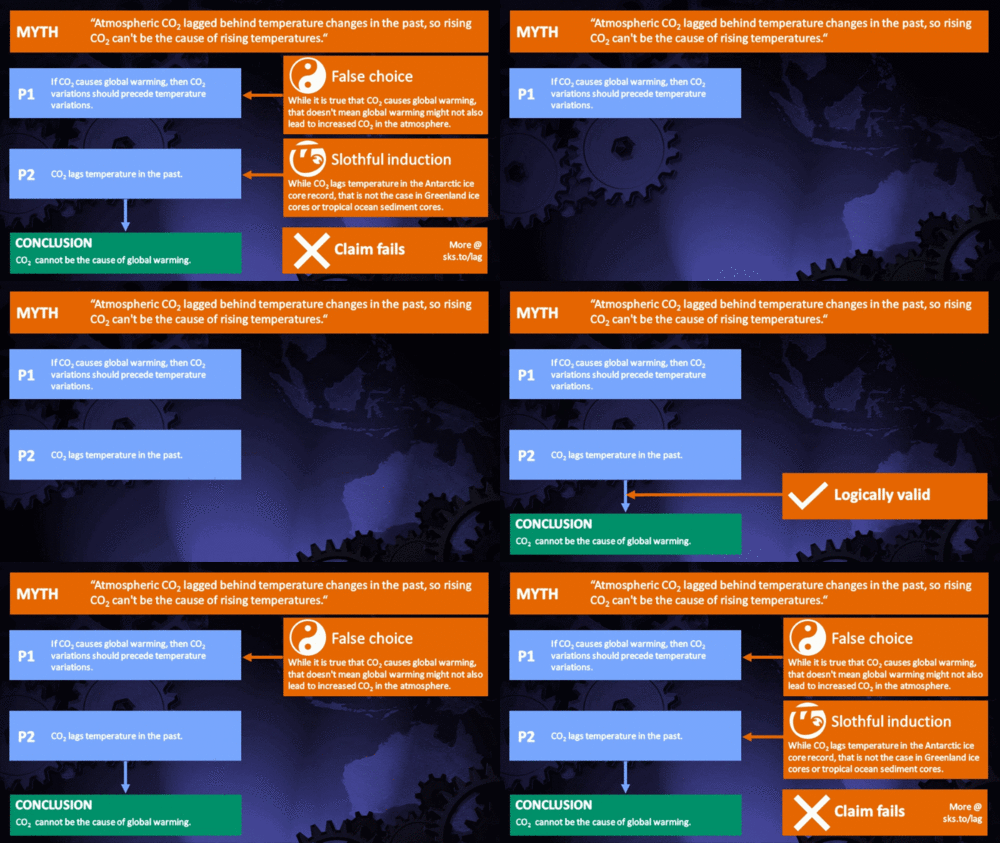
Related resource: Myth Deconstruction as animated GIF

MD Lag

Please check the related blog post for background information about this graphics resource.

Fact brief

Click the thumbnail for the concise fact brief version created in collaboration with Gigafact:

fact brief

Comments

Prev  1  2  3  4  5  6  7  8  9  10  11  12  13  14  15  16  17  18  19  20  Next

Comments 176 to 200 out of 653:

  1. Archie, if you click your own link, you will see that a feedback loop doesn't stop abruptly and dive back the other way. It would stop gradually, as the available co2 in the oceans dropped in concentration. There is nothing in that graph that explains the sharp peaks in the ice-core graphs. Conditions most certainly did not reach equilibrium.
  2. Before waffling on with various ignorant remarks about insolation and on the off-chance you actually care about this, mistermack, you might check into these papers: On the structure and origin of major glaciation cycles 1. Linear responses to Milankovitch forcing On the structure and origin of major glaciation cycles 2. The 100,000-year cycle Then, you ought to look at papers in turn cited by these two papers as well as citations of the pair. Once you've done that, you might be better able to simulate being a dilettante. If you don't have access to Paleoceanography your next comment here should be "where do I get a reprint?" If you don't ask that question, there should be a long (days long, at least) delay while you lift a finger on your own behalf, rather than twittering here about "guesses" and the like while rebuffing help you've asked for; between the two of them the papers are cited 748 times. (Don't bother asking me for pdf copies or the like, I could get them but you've got a poor attitude, so tough)
  3. e, the process of heading into the next ice-age seems to be almost continuous, it seems to be the naural condition, with the exception of the dramatic rise out of it. Ive illustrated that here, where I've just tried to show the underlying trends, seperated from the spikes. Time is running from right to left. Temp is blue, co2 is green. It shows rather graphically what should be happening very soon, if manmade co2 doesn't have enough effect.
    Response: Further comments by anyone about the onset of the ice age must be on the appropriate thread, which is not this one.
  4. Oops. Turns out the past is prologue, sometimes (warning: suggestive carrot). Turns out that employing the word "covariance" is evidence of "a deliberately false impression being left, and a false claim being made." So we're looking at argumentation underpinned by a conspiracy fantasy. I'd suggest not providing further entertainment.
  5. @mistermack: "Archie, if you click your own link, you will see that a feedback loop doesn't stop abruptly and dive back the other way." So, you admit that feedback loops don't lead to runaway warming, then? That was the (erroneous) claim you made which I responded to with that link. Try to pay attention. "It would stop gradually, as the available co2 in the oceans dropped in concentration. There is nothing in that graph that explains the sharp peaks in the ice-core graphs." What you call "sharp peaks" are actually gradual changes. They seem like sharp peaks to you because the time scale is compressed. Stretch it out and you'll see that not only are the changes not that quick (thousands of years), especially not when compared to the current warming trend. In short, you should stop eyeballing graphs and make the difference between long-term milankovitch-related cycles (where CO2 acts as a feedback, to get back on topic) and the current CO2-driven warming (where CO2 acts as a forcing. "Conditions most certainly did not reach equilibrium." Here you're half-right. Conditions never reach a total equilibrium, however, the changes are slow enough that they give that impression. This has nothing to do with the rapid rate of change we are experiencing, which is caused by increased CO2 levels.
  6. Archie, "never stop" was not meant to be taken literally. (why do I have to explain that?) If CO2 is the main driver, the feedback loop would have to continue as long as there was dissolved CO2 available to come out of the oceans. Which would heat the planet way past the point where it "did" stop. Is that any easier? If you look at the graph I posted above, where I averaged out the peaks and troughs, you can see that the trend is a continuous fall into an ice age, until some drastic event causes a spectacular temperature rise to a one-off peak, with this repeated over and over. It doesn't reflect the patterns of the Milankovitch cycles at all. Find out what drives that huge rise, and you will know what drives the climate. That's why the widely accepted 800 year lag is important. A tiny CO2 rise, following 800 years after a miniscule rise in insolation due to the Milankovitch cycle, just doesn't fit the bill. At the depth of the ice-age, a high proportion of the sun's energy is being reflected back into space anyway. I can't see a slow, tiny, gradual increase in insolation causing such a sudden and violent rise. And as I said earlier, what is the sudden stopping mechanism?
  7. mistermack #181: "Archie, "never stop" was not meant to be taken literally. (why do I have to explain that?)" Because it's the opposite of what you said? "If CO2 is the main driver, the feedback loop would have to continue as long as there was dissolved CO2 available to come out of the oceans." Why? If we take humans digging up and burning fossil fuels out of the equation then rising CO2 levels are a FEEDBACK. Once the forcing, in this case increased insolation of the northern latitudes, stops the feedback will eventually stop as well. Look at the ice-albedo feedback for example. Even if we stopped increasing atmospheric CO2 levels today ice would continue to melt for decades to centuries. It should not be at all surprising that there is a lag time between the point that a forcing peaks and the point that all of the feedbacks caused by that forcing peak. "And as I said earlier, what is the sudden stopping mechanism?" So long as the feedback factor is less than 1 it is simple mathematics that once the forcing ends the feedback must eventually do so as well. Ergo, the 'stopping mechanism' is quite obviously the end of the forcing. When you move your foot from the accelerator to the brakes of your car does the vehicle stop instantly? If not, why would you think that the entire planet can shift directions on a dime?
  8. CB, you clearly don't rate CO2 as having much of a greenhouse effect, if you think that a slight drop in insolation could halt temperature rises, at a point of extremely high and rising CO2 levels. A factor of 1 could hardly suddenly drag the world out of the depths of an ice-age, all the way to the hottest point in the cycle.
  9. @mistermack: you clearly didn't understand what CBDunkerson explained. During those times, CO2 was a feedback. When the main forcing stopped, the feedback diminished. Today the situation is different. We don't have an insolation-based forcing. However, CO2 levels are 35% higher than at the highest point during the past 600,000 years. It *is* the forcing, not the feedback. If you disagree, please provide scientific evidence supporting your point of view. Anything else will be ignored as more noise from the contrarian side.
  10. #181: "A tiny CO2 rise, following 800 years after a miniscule rise in insolation due to the Milankovitch cycle, just doesn't fit the bill. At the depth of the ice-age, a high proportion of the sun's energy is being reflected back into space anyway." Your remarks convey a very one-sided sense of scale. A tiny CO2 rise? Look at the CO2 graph you posted in #178: 180ppm at LGM, 280 at the graph's t=0 and 390 now. Those are not tiny changes. A high proportion of solar energy reflected back to space? This requires that you understand how the LGM changed the total albedo of both the sum total land area and the oceans basins. From Broccoli and Manabe 1987: ... both the ice sheet and CO2 effects are found to be required in order to produce sufficient cooling on a global basis. ... the loss of heat energy due to the reflection of solar radiation by Northern Hemisphere continental ice is almost entirely compensated by a reduction in the upward terrestrial radiation from that hemisphere.
  11. You know, in science, there was once this thing we called the Theory of Multiple Working Hypotheses. Anathema (a formal ecclesiastical curse accompanied by excommunication) in modern climate science. So, in juxtaposition to the hypothesis of future global climate disruption from CO2, a scientist might well consider an antithesis or two in order to maintain ones objectivity. One such antithesis, which happens to be a long running debate in climate science, concerns the end Holocene. Or just how long the present interglacial will last. Looking at orbital mechanics and model results, Loutre and Berger (2003) in a landmark paper (meaning a widely quoted and discussed paper) for the time predicted that the current interglacial, the Holocene, might very well last another 50,000 years, particularly if CO2 were factored in. This would make the Holocene the longest lived interglacial since the onset of the Northern Hemisphere Glaciations some 2.8 million years ago. Five of the last 6 interglacials have each lasted about half of a precession cycle. The precession cycle varies from 19-23k years, and we are at the 23kyr part now, making 11,500 years half, which is also the present age of the Holocene. Which is why this discussion has relevance. But what about that 6th interglacial, the one that wasn’t on the half-precessional “clock”. That would be MIS-11 (or the Holsteinian) which according to the most recently published estimate may have lasted on the order of 20-22kyrs, with the longest estimate ranging up to 32kyrs. Loutre and Berger’s 2003 paper was soon followed by another landmark paper by Lisieki and Raymo (Oceanography, 2004), an exhaustive look at 57 globally distributed deep Ocean Drilling Project (and other) cores, which stated: “Recent research has focused on MIS 11 as a possible analog for the present interglacial [e.g., Loutre and Berger, 2003; EPICA community members, 2004] because both occur during times of low eccentricity. The LR04 age model establishes that MIS 11 spans two precession cycles, with 18O values below 3.6o/oo for 20 kyr, from 398-418 ka. In comparison, stages 9 and 5 remained below 3.6o/oo for 13 and 12 kyr, respectively, and the Holocene interglacial has lasted 11 kyr so far. In the LR04 age model, the average LSR of 29 sites is the same from 398-418 ka as from 250-650 ka; consequently, stage 11 is unlikely to be artificially stretched. However, the June 21 insolation minimum at 65N during MIS 11 is only 489 W/m2, much less pronounced than the present minimum of 474 W/m2. In addition, current insolation values are not predicted to return to the high values of late MIS 11 for another 65 kyr. We propose that this effectively precludes a ‘double precession-cycle’ interglacial [e.g., Raymo, 1997] in the Holocene without human influence.” To bring this discussion up to date, Tzedakis, in perhaps the most open peer review process currently being practised in the world today (The European Geosciences Union website Climate of the Past Discussions) published a quite thorough examination of the state of the science related to the two most recent interglacials, which like the present one, the Holocene (or MIS-1) is compared to MIS-19 and MIS-11. The other two interglacials which have occurred since the Mid Pleistocene Transition (MPT) also occurred at eccentricity minimums. Since its initial publication in 2009, and its republication after the open online peer review process again in march of this year, this paper is now also considered a landmark review of the state of paleoclimate science. In it he also considers Ruddiman’s Early Anthropogenic Hypothesis, with Rudddiman a part of the online review. Tzedakis’ concluding remarks are enlightening: “On balance, what emerges is that projections on the natural duration of the current interglacial depend on the choice of analogue, while corroboration or refutation of the “early anthropogenic hypothesis” on the basis of comparisons with earlier interglacials remains irritatingly inconclusive.” As we move further towards the construction of the antithetic argument, we will take a closer look at the post-MPT end interglacials and the last glacial for some clues. An astute reader might have gleaned that even on things which have happened, the science is not that particularly well settled. Which makes consideration of the science being settled on things which have not yet happened dubious at best. Higher resolution proxy studies from many parts of the planet suggest that the end interglacials may be quite the wild climate ride from the perspective of global climate disruption. Boettger, et al (Quaternary International 207 [2009] 137–144) abstract it: “In terrestrial records from Central and Eastern Europe the end of the Last Interglacial seems to be characterized by evident climatic and environmental instabilities recorded by geochemical and vegetation indicators. The transition (MIS 5e/5d) from the Last Interglacial (Eemian, Mikulino) to the Early Last Glacial (Early Weichselian, Early Valdai) is marked by at least two warming events as observed in geochemical data on the lake sediment profiles of Central (Gro¨bern, Neumark–Nord, Klinge) and of Eastern Europe (Ples). Results of palynological studies of all these sequences indicate simultaneously a strong increase of environmental oscillations during the very end of the Last Interglacial and the beginning of the Last Glaciation. This paper discusses possible correlations of these events between regions in Central and Eastern Europe. The pronounced climate and environment instability during the interglacial/glacial transition could be consistent with the assumption that it is about a natural phenomenon, characteristic for transitional stages. Taking into consideration that currently observed ‘‘human-induced’’ global warming coincides with the natural trend to cooling, the study of such transitional stages is important for understanding the underlying processes of the climate changes.” Hearty and Neumann (Quaternary Science Reviews 20 [2001] 1881–1895) abstracting their work in the Bahamas state: “The geology ofthe Last Interglaciation (sensu stricto, marine isotope substage (MIS) 5e) in the Bahamas records the nature of sea level and climate change. After a period of quasi-stability for most of the interglaciation, during which reefs grew to +2.5 m, sea level rose rapidly at the end ofthe period, incising notches in older limestone. After briefstillstands at +6 and perhaps +8.5 m, sea level fell with apparent speed to the MIS 5d lowstand and much cooler climatic conditions. It was during this regression from the MIS 5e highstand that the North Atlantic suffered an oceanographic ‘‘reorganization’’ about 11873 ka ago. During this same interval, massive dune-building greatly enlarged the Bahama Islands. Giant waves reshaped exposed lowlands into chevron-shaped beach ridges, ran up on older coastal ridges, and also broke off and threw megaboulders onto and over 20 m-high cliffs. The oolitic rocks recording these features yield concordant whole-rock amino acid ratios across the archipelago. Whether or not the Last Interglaciation serves as an appropriate analog for our ‘‘greenhouse’’ world, it nonetheless reveals the intricate details ofclimatic transitions between warm interglaciations and near glacial conditions.” The picture which emerges is that the post-MPT end interglacials appear to be populated with dramatic, abrupt global climate disruptions which appear to have occurred on decadal to centennial time scales. Given that the Holocene, one of at least 3 post-MPT “extreme” interglacials, may not be immune to this repetitive phenomena, and as it is half a precession cycle old now, and perhaps unlikely to grow that much older, this could very well be the natural climate “noise” from which we must discern our anthropogenic “signal” from. If we take a stroll between this interglacial and the last one back, the Eemian, we find in the Greenland ice cores that there were 24 Dansgaard-Oeschger oscillations, or abrupt warmings that occurred from just a few years to mere decades that average between 8-10C rises (D-O 19 scored 16C). The nominal difference between earth’s cold (glacial) and warm (interglacial) states being on the order of 20C. D-O events average 1470 years, the range being 1-4kyrs. Sole, Turiel and Llebot writing in Physics Letters A (366 [2007] 184–189) identified three classes of D-O oscillations in the Greenland GISP2 ice cores A (brief), B (medium) and C (long), reflecting the speed at which the warming relaxes back to the cold glacial state: “In this work ice-core CO2 time evolution in the period going from 20 to 60 kyr BP [15] has been qualitatively compared to our temperature cycles, according to the class they belong to. It can be observed in Fig. 6 that class A cycles are completely unrelated to changes in CO2 concentration. We have observed some correlation between B and C cycles and CO2 concentration, but of the opposite sign to the one expected: maxima in atmospheric CO2 concentration tend to correspond to the middle part or the end the cooling period. The role of CO2 in the oscillation phenomena seems to be more related to extend the duration of the cooling phase than to trigger warming. This could explain why cycles not coincident in time with maxima of CO2 (A cycles) rapidly decay back to the cold state. ” “Nor CO2 concentration either the astronomical cycle change the way in which the warming phase takes place. The coincidence in this phase is strong among all the characterised cycles; also, we have been able to recognise the presence of a similar warming phase in the early stages of the transition from glacial to interglacial age. Our analysis of the warming phase seems to indicate a universal triggering mechanism, what has been related with the possible existence of stochastic resonance [1,13, 21]. It has also been argued that a possible cause for the repetitive sequence of D/O events could be found in the change in the thermohaline Atlantic circulation [2,8,22,25]. However, a cause for this regular arrangement of cycles, together with a justification on the abruptness of the warming phase, is still absent in the scientific literature.” In their work, at least 13 of the 24 D-O oscillations (indeed other workers suggest the same for them all), CO2 was not the agent provocateur of the warmings but served to ameliorate the relaxation back to the cold glacial state, something which might have import whenever we finally do reach the end Holocene. Instead of triggering the abrupt warmings it appears to function as somewhat of a climate “security blanket”, if you will. Therefore in constructing the antithesis, and taking into consideration the precautionary principle, we are left to ponder if reducing CO2’s concentration in the late Holocene atmosphere might actually be the wrong thing to do.
    Response: Your comment likely will spark discussion that belongs on the thread We’re heading into an ice age. So will you please copy it into a comment on that thread? Then post a new comment on this thread, simply pointing to your comment's new home. When you have done that, I'll delete this original comment from this thread. Thanks.
  12. Sentient, can you provide a link or citation for Tzedakis' paper? Can't find it, would like to take a look. BTW, mistermack might want to read sentient's post so as to get a better understanding of how tracking insolation for a single day is actually employed. Reevaluate what's "worthless," your remark versus the science.
  13. There seems to be very poor understanding of feedback among posters, so I'll try to give a simplified description. Imagine you have a football, (soccer), and a golfball. Chop the football in half, and lay it on the ground as a bowl. Put the golfball inside. That's negative feedback. If anything disturbs the golfball, it will roll back to the middle. Turn the football over, and put the golf ball on top. A very slight forcing factor ( a breath of wind ) causes it to roll. Once it's on the down slope, gravity, the feedback mechanism, takes over, and the ball runs away. It no longer needs the wind that started it, and wind in the other direction can't blow it back up the football. So those who claim that a reverse in the level of insolation would stop a feedback mechanism are really not understanding what's happening at all. For that to happen, the feedback would have to be incredibly weak, nowhere near what could pull a planet out of an ice-age. In reality, it's removing the feedback power source that stops positive feedback loops, like turning down the volume knob on your guitar amplifier. In climate terms, that would require the CO2 to run out, or the process of outgassing from the ocean to suddenly stop.
  14. @mistermack: you don't seem to understand that climate feedbacks don't necessarily lead to runaway warming. Did you read the article I linked to earlier? "In climate terms, that would require the CO2 to run out, or the process of outgassing from the ocean to suddenly stop." There is a finite amount of CO2 sequestered in the oceans, so it is possible that the rate of CO2 release from oceans would slow down as that amount decreases. Your analogy is inadequate, and your conclusions are thus erroneous. I suggest reading more from this site before attempting to take down current AGW theory.
  15. Archie, that's totally illogical. If you consider the peaks of the graphs, you have a huge steep rise, coming to a sudden stop, followed by a huge steep fall. How on earth does that happen in response to CO2 feedback? Does the ocean suddenly stop outgassing, and suddenly start sucking in CO2? In huge quantities? How would that happen?
    Response: Again, you seem to be assuming that putting the label "positive feedback" on any phenomenon necessitates the runaway version of positive feedback. See the Argument "Positive Feedback Means Runaway Warming", and read all three versions--Basic, Intermediate, and Advanced.
  16. In any case, Archie, for that to happen, the CO2 graph would have to get ahead of the temperature graph.
  17. mistermack, your incorrect analogy with a moving ball makes me suspect that you are incorrectly thinking of temperature as having inertia.
  18. mistermack, lots of factors influence temperature. Although CO2 is a really important one, it is not the only one. The interplay of those factors is complicated. Our knowledge of that interplay is summarized in causal models. Those models do a good job of hindcasting the changes in temperature in response to changes in those factors.
  19. @mistermack: you seems to assume a lot of things wrong. What you says happens "suddenly" in reality takes hundreds, even thousands of years. You also seem to believe only CO2 affects temperature. You've been provided with links explaining why these ain't so. Why not try to study these various mechanisms a bit more instead of taking such an adversarial approach? Did you come here to learn, or to make a point?
  20. mistermack, since you seem frustrated at the answers you are getting here, why don't you post your question about the rapidity of cooling over on this particular post on ice ages at RealClimate?
  21. MrResponse, I have read that article about runaway warming, someone already linked it on this thread. But you can't have it both ways. If there is a built-in mechanism that stopped runaway warming, (as seems perfectly clear anyway from the graphs), then there should be little to worry about. And also, what is the mechanism that happens so suddenly (suddenly in climate terms Archie), and sends the whole process into reverse? There is nothing similar to that in the page you linked. If it was the CO2 supply dwindling in the ocean, wouldn't it happen incredibly slowly? How do you think that could happen quickly, and go straight into steep reverse, as I asked? People seem to be dodging the difficult question here.
  22. mistermack, you are incorrect that runaway warming was happening but something else stopped it. Positive feedbacks that are not of the runaway variety never can run away. They are self-limiting. Each little bout of positive feedback is just that--a little, short-lived bout that inherently, by its fundamental nature, will die out. They do not strain toward running away. They are introspective. Belly button "innies" rather than "outies." In our current era, there is a lot for us to worry about despite the lack of the runaway variety of positive feedback, because we keep adding greenhouse gases; our addition of greenhouse gases is a forcing. The non-runaway positive feedback amplifies the effects of those additions. If we suddenly stopped adding greenhouse gases and all other emissions, temperature would continue to rise for several years due to the Earth working toward equilibrium, but then the temperatures would fall. If we continued to emit but at a constant rate instead of an increasing rate, temperature would continue to rise for longer but then would asymptote. Tying all that back into the topic of this post: Those past CO2 positive feedbacks also were not of the runaway variety. So they, too, inherently would peter out. Unlike the human-caused addition of CO2, there was no forcing by independent addition of CO2. CO2 was instead acting as a non-runaway feedback. Other, forcing and feedback, factors needed to keep stimulating the system and thereby prompting more (non-runaway) positive feedback from CO2. Most prominent among those factors was orbital cycles, but there also were effects of changes in vegetation, dust, snow and ice cover,.... So your question "what made the temperature rise stop" is ill posed. The better question is "what made the temperature continue to rise as long as it did?"
  23. Tom, if the graphs remotely resembled a process "petering out", I would have to agree. However, as I've pointed out so many times, they don't. Draw your own graph, of a feedback loop "petering out". What does it look like? Does it resemble the ice core records? And why don't the CO2 graphs jump in front of the temperature graphs when that happens? If a drop in CO2 is pulling down temperatures?
  24. @mistermack: again, you are misled by the time scale used in the graphs. The changes seem sudden to you because the scale is in hundreds of thousands of years. If you were to see these changes happen on a much smaller scale, they wouldn't look so sudden, and would be consistent with the feedback loops ending. Also, Tom has not claimed that a drop in CO2 is what drove the climate down. Instead, CO2 is a *feedback* mechanism in those cases. You won't learn much (and you clearly have much to learn still) by refusing to listen to rebuttals to your erroneous claims.
  25. mistermack, you continue to refuse to acknowledge the importance of the time scales of the graphs. Try mentally zooming in on Figure 1 at the top of this post until its x axis had the same time scale as the graph of temperature response to cessation of human emissions. The "sudden" drops would not seem so sudden. Or zoom out of the the graph of temperature response to cessation of human emissions until its timescale matches that of Figure 1. Then the "gradual" drop would seem just as sudden as Figure 1's drops. What seems to you personally to be unrealistic and unreasonable rates of decrease when you look at a graph zoomed out so far, in fact are completely reasonable when the actual times involved are recognized.

Prev  1  2  3  4  5  6  7  8  9  10  11  12  13  14  15  16  17  18  19  20  Next

Post a Comment

Political, off-topic or ad hominem comments will be deleted. Comments Policy...

You need to be logged in to post a comment. Login via the left margin or if you're new, register here.

Link to this page


The Consensus Project Website

THE ESCALATOR

(free to republish)


© Copyright 2024 John Cook
Home | Translations | About Us | Privacy | Contact Us