


 Arguments


Is Greenland gaining or losing ice?
What the science says...
| Select a level... |
 Basic
Basic
|
 Intermediate
| |||
|
Greenland on the whole is losing ice, as confirmed by multiple satellite and on the ground field measurements. |
|||||
Climate Myth...
Greenland is gaining ice
“[E]ven if it were true that Greenland’s ice had been melting at ‘new record’ rates, after seven and a half years of global cooling global warming cannot be the cause. The true position in Greenland is to be found in Johannessen et al. (2005), where satellite altimetry established that the mean thickness of the entire Greenland ice sheet had increased at 2 inches per year – a total of almost 2 feet – in the 11 years 1993-2003.” (Christopher Monckton)
At a glance
The interior of Greenland features a huge ice sheet that covers some 80% of that large island. Up to three kilometres thick, the sheet contains a whopping 2.9 million cubic kilometres of ice. If that all melted, global sea level would go up by around seven and a half metres. So it would obviously be good if that didn't happen.
Read any science about ice-sheets and you will soon run into a term that will become familiar: 'mass balance'. Mass balance is an expression of the health of any ice-sheet. Ice-sheets gain mass by snowfall and lose mass by 'ablation', a term covering sublimation, evaporation melt, and meltwater runoff, plus solid ice discharge by the glaciers that drain them. If the value for mass balance of an ice sheet is a positive number, the sheet is growing. But a negative value means the sheet is dwindling.
Since 1991, satellites have obtained continuous data on the Greenland ice-sheet, using radar, lasers and sensitive instruments that can detect changes in local gravity. Such methods allow mass balance to be calculated.
With over 30 years of satellite data now at our disposal, we can step back and look at the big picture. The Greenland ice sheet was close to a neutral state of balance in the 1990s. Since then however, annual losses have risen. One recent paper calculates that Greenland lost almost 4,000 billion tonnes of ice between 1992 and 2018, adding almost eleven millimetres to global sea levels.
Reduction of ice mass balance has occurred for two key reasons. Firstly there is increased meltwater run-off. Have you seen imagery of bright blue pools connected to rivers, flowing across the surface of the ice-sheet, to disappear down into it in spectacular cascades? That's the run-off. Secondly, there is glacier instability - whereby glaciers speed up in their discharge of ice, ultimately to the ocean, with those videos of spectacular calving events many of you will have seen. In Greenland, it's thought that these two processes account for about half of ice-sheet loss each.
Of course, the rate of ice loss varies from year to year. It depends on weather patterns. A cooler year with a lot of snowfall will provide a considerable counter-weight to the loss processes. Then again, in June 2023 the temperature rose to 0.4oC at the Summit Station, a research facility situated 3,216 metres above sea level and near the high-point of the ice-sheet. That has only happened five times in the 34 years since the station was established. Like anywhere else, the year to year pattern is pretty varied: however it's the multidecadal trend that matters and that is very definitely downwards.
It never pays to pick short time-spans when discussing matters of long-term climate trends. Statements like the one by Christopher Monckton in the myth-box above, made in 2009, have simply been made invalid by the march of time.
Please use this form to provide feedback about this new "At a glance" section. Read a more technical version below or dig deeper via the tabs above!
Further details
Anecdotes of structures on the Greenland Ice Sheet, such as the now disused Dye 2 and 3 Cold War radar stations being engulfed by snow, have led to claims in some quarters that Greenland is gaining ice. However, a couple of isolated radar stations are not representative of the whole ice-sheet and the late 2000s, when the claims were made, is a long time ago now. So let's take a look at how ice-sheets are evaluated and what has happened since.
On any ice-sheet, ice loss occurs because of surface melt, wind-ablation and sublimation. Surface meltwater finds its way down through crevasse systems to the bed of the glacier, there lubricating and accelerating its down-slope motion. Where ice-shelves around the coastline are lost through melting and/or collapse, the loss of their buttressing effect has the same result, as it also does when warm water causes grounding line retreat. All of these processes are intensified by increased warmth.
Although on-site measurement techniques are used by glaciologists, it has become standard practice to use satellites for large scale monitoring. Satellites return data from extensive areas of remote terrain that would require expeditions to reach. Three key measuring parameters are employed to obtain ice-sheet data. These comprise elevation change, mass change and flux components. The first satellites capable of such measurements were launched in the very early 1990s, ERS-1 in 1991 and ERS-2 in 1995. Thus, the satellite record of ice sheet change is now multidecadal.
Elevation change
The elevation of the Greenland ice-sheet is measured using both laser and radar altimetry. In both cases a signal is fired at the surface of the ice and bounced back. Both radar and laser waves travel at the speed of light, so recording the time they take to return to the satellite means the distance travelled may be calculated. Radar altimeter signals provide good coverage for ice sheets. However, at first there were some resolution issues, causing difficulties in measuring sloped/rough terrain. Laser altimetry is also highly accurate and has an even better resolution than radar altimeters but cloud cover can be an issue.
Radar altimeter signals also penetrate the near-surface uncompacted snow and ice layer. This can introduce a bias into the data. Those who work on such programmes are well aware of such issues. In 2010, Cryosat-2 was placed in orbit, equipped with a much higher resolution radar altimeter. This altimeter uses complex radar combination techniques, known as radar interferometry, to enhance horizontal resolution. That allows more precise measurements of changes in ice elevation of as small as a few centimetres. A further benefit of Cryosat 2 is that it allows for the highest latitude coverage available for an altimeter. Measurements can be taken right up to 88° north. Continuing the theme of better and better equipment, the next generation of monitoring satellites, Sentinel 3a and 3b, were launched in 2016 and 2018 respectively.
Mass Changes
Gravimetry measures changes in regional gravitational fields through accurate measurements of the gravitational pull on satellites as they overfly a district. As an ice-sheet gains or loses mass through time, regional gravitational forces are affected. Measuring these effects makes mass change estimates possible. The technique involves precise monitoring of the separation between a pair of satellites in identical orbits. This was one purpose of the space mission that has changed the way we study Earth's gravitational forces. It is called the Gravity Recovery and Climate Experiment, or GRACE, and was launched in 2002. The GRACE mission ended in 2017 but these highly innovative techniques were continued on GRACE-FO (GRACE Follow-On), launched in 2018.
Flux Component Method
The flux component method involves the estimation of the total mass input and mass output for each individual glacial drainage-system. Put together, these values allow us to estimate the situation for the whole ice sheet. Mass input estimates require detailed knowledge of patterns of snow accumulation, in both space and time. On site observations of glacier mass involve meteorological records, snow pits, ice cores and marker poles. These are used to ground truth regional ice-sheet models. Good agreement between modelling and measurements give confidence in the usefulness of the method.
Outflow estimates involve recording the speed of the ice flow and the thickness of the ice. Radar Interferometry allows for direct all-weather recording of surface velocities. Depth of ice streams has been estimated using various means, from bedrock topography models to ground penetrating radar surveys.
Satellite-based observations have been used to record ice surface velocity, although the velocity of an ice sheet often varies with depth, introducing some uncertainty. Outlet glaciers, though, tend to move by rapid basal sliding. Such ice-streams therefore have minimal variation in speed with depth.
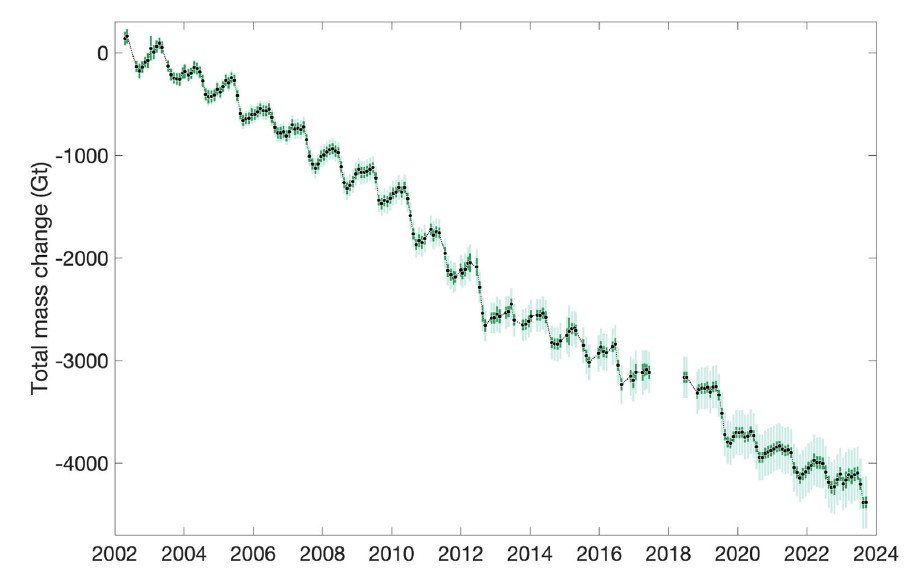
Fig. 1: GRACE and GRACE-FO satellite gravimetry-based mass balance, representing the total mass change in the Greenland Ice-sheet in gigatons (Gt) from April 2002 to September 2023. Source: NOAA Arctic Report Card 2023, page 33.
The results of these various missions all point at one thing (e.g. Fig. 1). Net negative mass balance - ice loss has dominated every year since 1998. It's highly variable, though as the weather fluctuates. Some winters see much greater snow accumulation than others. Some summers are warmer than others. Just as an example, in the one year period from 1 September 2022 too 31 August 2023, GRACE-FO measured a total GIS mass balance of -156 +/- 22 Gt. That equates to 0.4 mm of sea level rise in 12 months. However, the year was a below-average one for ice-melt. Yet by the 2010-2018 period, average annual ice-loss was six times that of the 1990s (Mouginot et al. 2019).
An extensive literature exists on the methodology of and results from ice-sheet monitoring on Greenland from the early days (e.g. Johannessen et al. 2005) to the present (e.g. Shepherd et al. 2019; Mankoff et al. 2021 and references therein). However, NOAA's annual Arctic Report Card is a good place to start exploring, with much more extensive literature citations than is possible here.
Last updated on 19 February 2024 by John Mason. View Archives


DMI said the Greenland ice sheet likely grew in 2016-17 (this was released on October 16, 2017) and 2017-18 (this was released on October 27, 2018). This makes many of the posts above look silly. The faint of heart can take solace that they don't have to look at Tony Heller's website. But, they could look at DMI's, NSIDC's, etc.
Molsen - perhaps you could share the link which demonstrates your point? Knowing Heller, there are a no. of ways to cherry-pick data. Deniers often jump on Surface mass balance which is always positive (even in 2012) and last two summers have been high. The ice sheet gains more ice from precipation than melts every year. However, SMB doesnt take acount of calving losses which are what determine ice sheet mass. Your statement does not appear to be backed by the ice mass data seen here.
The silly fellow Molsen managed not to link to his two DMI said 'thises', so here are the links to the two 'thises' I assume were intended. They are both CarbonBrief posts of the date stated by guest authors Dr Ruth Mottram, Dr Peter Langen and Dr Martin Stendel from DMI.
The first 'this' (16/10/17) actually says of the 2017 melt year "This year, thanks partly to Nicole’s snow and partly to the relatively low amounts of melt in the summer, we estimate the total mass budget to be close to zero and possibly even positive." The "main culprit" was thus named as the snowfall brought to Greenland by Hurricane Nicole in October 2016.
The second 'this' (27/10/18) declines to be drawn on the 2017/18 total mass balance, deferring to GRACE-FO which was expected to be soon up-&-running in Oct 2018 although at time of writing GRACE-FO output data (rather than data collection) is yet to show itself.
So no sign of pronouncements that Greenland ice sheet "likely grew" throughthese years. Then perhaps there are other 16/10/17 & 27/10/18 Greenland news posts that do pronounce on Total Mass Balance, Or is Molsen misinterpreting Surface Mass Balance data?
[PS] Keep it seemly.
You should read the Polar Portal Season Report for 2018, published in November 2018, by DMI. It notes some positive things, such as Greenland's glaciers losing only a minor amount of area in the last six years.
That's fantastic news. Take a look at the helpful graph DMI provides on page 5. Will the trend continue this year? I dunno, but it's interesting the last six years have gone unnoticed by the MSM, etc.
[JH] Please provide a link to the report you have referenced.
PS - When it comes to the impacts of Greenland's melting ice sheet, it is volume, not area, that matters most.
I believe the report he references is http://polarportal.dk/fileadmin/user_upload/polarportal-saesonrapport-2018-EN.pdf. pg 5 graph show rates of reduction in glacier area has reduced since 2012 (which is good news). However, last mass graph..
doesnt look so hopeful, but we are all waiting for Grace-FO to provide data for the current situation. I dont see anything that would suggest this article is outdated.
The graph supports the article being updated. The mass loss since 2012 has been much less than what occurred from 2006-2012 — i.e., the mass loss since 2012 is probably one-quarter what is was in the preceding six years.
However, the second paragraph of this entry, with its use of the phrase "drastically increased since the year 2000" misses that entirely.
So, the end of the second paragraph should have the following added to be accurate and fair:
"but the rate of decrease has slowed remarkably since 2012 for reasons that are unknown. This declining rate of mass loss has gone unacknowledged by the media and climate scientists. On the contrary, the media (at least) have reported that the opposite is happening. At this point, that is not the case."
A fair statement?
Surface melt and snowfall mass balance are not the sum of the total mass balance equation by far. Because calving and discharge from the margins are not factored into that.
Per ther DMI:
Which brings it into good agreement with NASA:
According to the NASA (GRACE) data, the average loss from 2009 to 2013 was 399 gigatonnes per year. From 2013 to 2017, the average loss per year was 190 gigatonnes per year.
The statement that there has been an acceleration of ice mass loss since 2009 is factually wrong. At the very least, there has been an interesting pause in that "acceleration" since 2013. It's kind of like minimum summer sea ice extent in the Arctic: it has kind of been going sideways (i.e., not declining) for the last 12 years or so. Again, interesting....
Just because you cherry-pick different dates to suit your purpose does not invalidate the statement:
Recommended supplemental reading:
Cold Water Currently Slowing Fastest Greenland Glacier by Carol Rasmussen, JPL/NASA, Mar 25, 2019
Actaully I agree that changes in Arctic are interesting - we have had a sequence of warm winters and cloudy summers which are certainly of scientific interest in understanding weather. Likewise the effects of flip in NAO on weather patterns are very important for future weather prediction. However, thinking that these represent a climatic change is wishful thinking.
The GRACE data show that ice loss accelerated in 2009 and then slowed down in 2013. Are you suggesting otherwise, Daniel Bailey? The underlying data are invalidated by a poorly drafted statement?
And, scaddenp, let's see what happens in the future; as articles on the growing Jacobshavn glacier note, scientists do not understand the processes behind the Greenland ice melt as well as they thought a few years ago. Who knows what they'll know in a few year?
Molsen, if you are hoping against hope that suddenly melt is going into reverse, then you are choosing to ignore much of the science published on Greenland by not looking at the drivers for is happening in the system. I sure know which way I would bet! This is like people starting the "warming stopped in 1998 2016" refrain. Hope springs eternal but you are going to be disappointed. Weather does not equal climate. Come back again and give us your opinion when, say, NAO flips again.
Molsen @37,
You talk of "poorly drafted statements" and ask whether GRACE data showed "accelerated" ice loss in 2009 and then "slowed down" in 2013.
Looking at the data, the 2009 net ice loss decelerated from the previous year's average of 266Gt/yr to 199Gt/yr. And the 2013 net ice loss also decelerated relative to the previous year, from 428Gt/yr to 327Gt/yr (although, as the graph of the data shows, the data for these later years is missing a few months).
The rate of net ice loss is highly variable. I'm sure you could pedantically cherry-pick some of the data to demonstrate that the net ice loss is decelerating throughout the entire period. It is likewise with the ice loss from glaciers like the Jacobshavn glacier although I think you rather underestimate the knowledge of scientists. A very recent comment on the Jacobshavn glacier is HERE.
Given the total volume of ice in the Greenland ice sheet, it seems that a little more than 99.99 per cent of it does not melt in even a bad year. Is that statistically significant from zero?
To clarify: is the percentage that melts (i.e., the 0.01 per cent - at worst -statistically different from zero?
[DB] Annual losses from the Greenland Ice Sheet are 286 Gt/year. Pretty statistically significant, even relative to the Empire State Building:
Molsen @40,
You say that "it seems that a little more than 99.99 per cent of it does not melt in even a bad year." That is actually wrong. It is about 99.93% that annually "does not melt." The ice sheet averages something like 1,500m in depth and the melt is about 1m of that. What you appear to ignore is the annual +800mm precipitation of snowfall which must be added to the net Ice Mass figures to give the total annual melt.
However, I will assume you are interested in net Ice Mass as that has been your interest up-thread and that would be roughly equal annually to 0.01% of the total ice mass. The statistical significance of the net ice loss is not in any way dependent on the total mass of ice suffering the loss. Rather it is a matter of whether the measurement of Ice Mass is noisy enough that the negative trend could be purely a product of the noise. This can be determined statistically.
In the case of the GRACE data of total Greenland Ice Mass graphed repeatedly on this web-page, the negative trend is a long long way from being statistically insignificance. A quick linear regression through the data with the annaul cycle removed (2003-2015, the data which was readily available) gave a trend of -273.4Gt/yr +/-7.3Gt/yr(2sd). So the Confidence interval would be -266 to -281, all a long way from zero.
If we're losing, on average, 0.01% of total Greenland ice mass per year, then we can expect to lose 1% of the total mass in a century. That doesn't sound so bad until you realize it assumes the melt rate does not accelerate.
GRACE data ends in 2016. Do we have GRACE-FO data, yet, so we can extrapolate what has happened in the intervening years?
icowrich - try http://gravis.gfz-potsdam.de/greenland. Regular updates from FO are really just getting started.
Please note: the basic version of this rebuttal has been updated on February 18, 2024 and now includes an "at a glance“ section at the top. To learn more about these updates and how you can help with evaluating their effectiveness, please check out the accompanying blog post @ https://sks.to/at-a-glance