


 Arguments


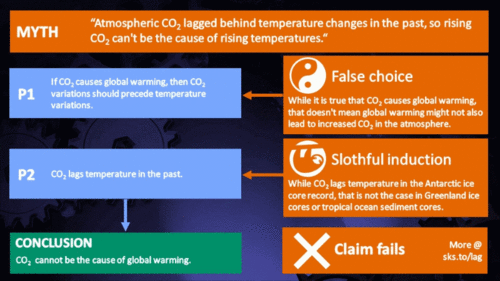
CO2 lags temperature - what does it mean?
What the science says...
| Select a level... |
 Basic
Basic
|
 Intermediate
|
 Advanced
| ||||
|
CO2 didn't initiate warming from past ice ages but it did amplify the warming. In fact, about 90% of the global warming followed the CO2 increase. |
|||||||
Climate Myth...
CO2 lags temperature
"An article in Science magazine illustrated that a rise in carbon dioxide did not precede a rise in temperatures, but actually lagged behind temperature rises by 200 to 1000 years. A rise in carbon dioxide levels could not have caused a rise in temperature if it followed the temperature." (Joe Barton, US House of Representatives (Texas) 1985-2019) - Full Statement
At a glance
Antarctic ice-core data today provide a continuous record on temperature and atmospheric composition that goes back for some 800,000 years. The data track the last few glacial periods and their abrupt endings, with rapid transitions into mild interglacials. But in some of the ice-cores, temperature rises first and is followed, a few hundred years later, by rising carbon dioxide (CO2) levels.
Certain purveyors of climate-myths seized on this observation, claiming it to be “proof” that carbon dioxide doesn't cause climate change. Wrong, wrong, wrong. But how? The answer lies in a beer-can.
In fact, you can do this one yourself. You need two cans of any fizzy beer. On a nice summer's day, take one out of the fridge and place it outside in direct sunshine for a few hours. Leave the other where it is. Then open the two at the same time. The warm one will froth like mad, half-emptying the can and making a mess. What is left in the can will be horrible and flat. Conversely, the one straight from the fridge will just give a “pfft” noise and will be pleasant to drink, being cool and fizzy.
What's that got to do with this myth? Well, you have just demonstrated an important point about the solubility of CO2 in water. CO2 gives fizzy drinks their fizz and it is far more soluble in colder water. As the water warms, it cannot hold onto as much CO2 and it starts to degas. Hence that flat lager.
Exactly the same principle applies to the oceans. When global warming is initiated, both land and the oceans start to warm up. On land, permafrost starts to thaw out, over vast areas. Carbon dioxide (and methane) are released, having been trapped in that permafrost deep-freeze for thousands of years. At sea, that “warm beer effect” kicks in. Thanks to both processes, atmospheric CO2 levels rise in earnest, amplifying and maintaining the warmth. That rise in CO2 thereby caused more of the gas to be released, warming things up yet more in a vicious cycle, known as a positive feedback. Other feedbacks kick in too: for example as the ice-sheets shrink, their ability to reflect Solar energy back out to space likewise decreases, so that heat is instead absorbed by Earth’s surface.
The trigger for the initial warming at the end of an ice-age is a favourable combination of cyclic patterns in Earth's orbit around the Sun, leading to a significant increase in the solar energy received by Earth's Northern Hemisphere. That's no secret. Glacial-interglacial transitions are caused by several factors working in combination – triggers and feedbacks. We've understood that for a long time.
And when you think about it, saying CO2 lagged temperature during glacial-interglacial transitions so cannot possibly be causing modern warming is a bit like saying, “chickens do not lay eggs, because they have been observed to hatch from them".
Please use this form to provide feedback about this new "At a glance" section. Read a more technical version below or dig deeper via the tabs above!
Further details
That CO2 can lag behind but amplify temperature during a glacial-interglacial transition was in fact predicted as long ago as 1990. In the paper The Ice-Core Record: Climate Sensitivity and Future Greenhouse Warming by Claude Lorius and colleagues published in the journal Nature in 1990, a key passage reads:
"The discovery of significant changes in climate forcing linked with the composition of the atmosphere has led to the idea that changes in the CO2 and CH4 content have played a significant part in the glacial-interglacial climate changes by amplifying, together with the growth and decay of the Northern Hemisphere ice sheets, the relatively weak orbital forcing and by constituting a link between the Northern and Southern Hemisphere climates."
This was published over a decade before ice core records were accurate enough to confirm a CO2 lag. We now know that CO2 did not initiate the warming from past ice ages but it did amplify the warming. In fact, about 90% of the global warming followed the CO2 increase.
Antarctic ice cores reveal an interesting story, now going back for around 800,000 years. During this period, changes in CO2 levels tend to follow changes in temperatures by about 600 to 1000 years, as illustrated in Figure 1 below. This has led some to disingenuously claim that CO2 simply cannot be responsible for the current global warming. Unsurprisingly, such a claim does not tell the whole story.
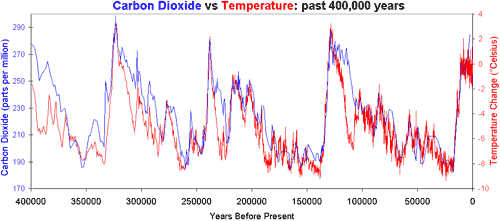
Figure 1: Vostok ice core records for carbon dioxide concentration and temperature change.
The initial change in temperature as an ice-age comes to an end is triggered by cyclic changes in Earth’s orbit around the sun, affecting the amount of seasonal sunlight reaching Earth’s surface in the Northern Hemisphere. The cycles are lengthy: all of them take tens of thousands of years to complete.As both land and oceans start to warm up, they both release large amounts of CO2 into the atmosphere, from melting permafrost and from warming ocean water, since CO2 solubility in water is greater in cold conditions. That release enhances the greenhouse effect, amplifying the warming trend and leading to yet more CO2 being degassed. In other words, increasing CO2 levels become both the cause and effect of further warming. Once started, it’s a vicious, self-reinforcing cycle - an excellent example of what science refers to as a positive climate feedback.
Indeed, such positive feedbacks are necessary to complete the shifts from glacial to interglacial conditions, since the effect of orbital changes alone are too weak to fully drive such variations. Additional positive feedbacks which play an important role in this process include other greenhouse gases like methane - you may have seen videos of that gas bubbling up through icy lakes in permafrost country and being ignited. Changes in ice sheet cover and vegetation patterns determine the amount of Solar energy getting absorbed by Earth’s surface or being reflected back out to space: decrease an ice-sheet’s area and warming will thereby increase.
The detailed mechanisms for the above general pattern have of course been investigated. In a 2012 study, published in the journal Nature (Shakun et al. 2012), Jeremy Shakun and colleagues looked at global temperature changes at the commencement of the last glacial-interglacial transition. This work added a lot of vital detail to our understanding of the CO2-temperature change relationship. They found that:
1) The Earth's orbital cycles triggered warming in the Arctic approximately 19,000 years ago, causing large amounts of ice to melt, flooding the oceans with fresh water.
2) This influx of fresh water then disrupted ocean current circulation, in turn causing a seesawing of heat between the hemispheres.
3) The Southern Hemisphere and its oceans warmed first, starting about 18,000 years ago. As the Southern Ocean warms, the solubility of CO2 in water falls. This causes the oceans to give up more CO2, releasing it into the atmosphere.
4) Finally, CO2 levels may lag temperature in some ice-core records from Antarctica, but in some other parts of the world the reverse was the case: temperature and CO2 either rose in pace or temperature lagged CO2. Figure 2 demonstrates this graphically and shows how things are never as simplistic as purveyors of misinformation would wish.
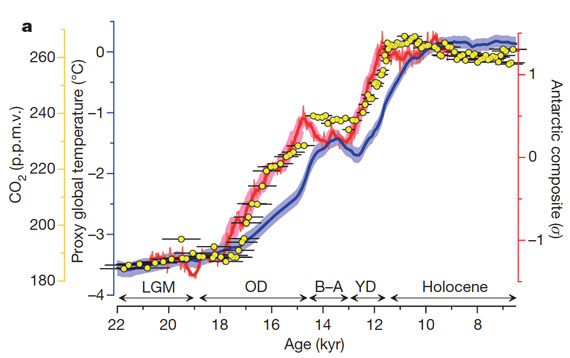
Figure 2: Average global temperature (blue), Antarctic temperature (red), and atmospheric CO2 concentration (yellow dots). Source.
Last updated on 14 February 2023 by John Mason. View Archives


Eclectic @575
Your explanation paints a consistent picture with Schmidt's comments and makes sense. Dana's comments when taken at face value still seem to me to be a little unclear.
Thanks for taking the time to respond.
Tcflood @576 , certainly for me there was some "unclearness" in the messages from Schmidt and Dana. Maybe in their comments they did not choose to spend time going into meticulous details of the time-lines and/or regional variations [such as in the northern Pacific?] involved in the glacial/interglacial transition phase. Or maybe those details have not yet been determined exactly.
Nevertheless, the important "take home" message is that of (a) an initial warming from Milankovitch orbital effects, causing (b) warming oceans to release CO2 which provides the bulk of subsequent global warming. Which is always an excellent point for rebutting those tiresome denialists' claims of "no CO2/temperature causative relationship".
The time lag is likely an illusion caused by an age date discrepancy between the ice and the gas trapped in the ice. The ice is snow before it is ice. The atmosphere is free to circulate to the bottom of the snow layer, so the gas is considerably younger than the ice it is imbedded in. Parrenin et al 2013 found that there is no lag between CO2 and the temperature changes when both are put on the same chronology.
Synchronous Change of Atmospheric CO2 and Antarctic Temperature During the Last Deglacial Warming
F. Parrenin et al.
Science 339, 1060 (2013);
DOI: 10.1126/science.1226368
Good discussion.
The link "The ice-core record: climate sensitivity and future greenhouse warming by Claude Lorius (co-authored by James Hansen"
is broken. It's just been moved, not removed. It is now at
https://pubs.giss.nasa.gov/abs/lo03000u.html
[PS] Thanks very much for that. Link updated.
“Tectonics in the tropics trigger Earth’s ice ages, study finds
Major tectonic collisions near the equator have caused three ice ages in the last 540 million years. . . .
Over the last 540 million years, the Earth has weathered three major ice ages — periods during which global temperatures plummeted, producing extensive ice sheets and glaciers that have stretched beyond the polar caps.
Now scientists at MIT, the University of California at Santa Barbara, and the University of California at Berkeley have identified the likely trigger for these ice ages.
In a study published today in Science, the team reports that each of the last three major ice ages were preceded by tropical “arc-continent collisions” — tectonic pileups that occurred near the Earth’s equator, in which oceanic plates rode up over continental plates, exposing tens of thousands of kilometers of oceanic rock to a tropical environment.”
http://news.mit.edu/2019/tectonics-tropics-trigger-ice-ages-0314
Hi,
I am dealing with a denier who constantly puts up graphs that he's created from the EPICA Ice Core Data.
This denier makes the following cliams.
No correlation, and EPICA Ice Core data proves it:
Temperature increases CO2 levels, but CO2 levels do not increase temperature.
I made my own graph of the EPICA Ice Core data and it appears that this denier is only taking a very small era of time from the EPICA ice core data.
Here is my graph of the data and the yellow highlighted section appears to be erea of time this dener is zooming in on.
[DB] Please limit image widths to under 500 pixels.
TVC15 @581,
I'm not sure what has happened to the red trace on your version of the EPICA data - I think its x-axis is stretched perhaps three-times longer than it should be.
As for the denialist, hs is simply taking tiny bits of EPICA data and graphing them in a way to hide any CO2-T relationship. Frankly, I would not accept his trustworthiness unquestioned. If he tries such deception, why not start fiddling with the data being plotted to assist the deception?
His two graphs are the lead-up-to and the follow-on-from the height of the Eemian interglacial. If they had been joined together, his little game would be clearly exposed.
The graph below was taken from this RealClimate page. The denialist hides the obvious CO2-T correlation in the lead-up by flattening the CO2 plot with a y-axis from 0-to-300ppm (while his follow-on graph plots a little more sensibly from 220-to-300ppm). With his graph of follow-on CO2 & T, the graph below does show that temperature fell away from the height of the Eemian while CO2 levels were a little less depressed. (Figure 1 in the OP above shows this quite well.) Of course, CO2 isn't the only driver of climate and the EPICA data plotted below does show methane levels dropping quickly through that follow-on period.
This is pretty typical climate ball even if graph is honest. Ignore that climate is always the result of net forcing and focus on CO2 only. Scan the data looking for anything, anywhere to find an interval where CO2 and temperature out of sync, ignore other possible causes and declare it a proof. Especially ignore the other overwhelming evidence of the effect of CO2 particularly in the modern era where, unlike ice core, we can know the value of all the other forcing in play.
@582 MA Rodger
@scaddenp
Thanks once again! This particular denier is one sly devil for sure.
The tactics used by climate deniers will never cease to amaze me!
TVC - I think "sly devil" is unkind - he is just doing what is natural for all of us, namely indulging in motivated reasoning to justify a preferred belief. If you have a reason to deny AGW (usually ideological or identity based), then there is a vast reserve of misinformation out there to provide comfort. Sadly, debunking those points will only result in either denial of facts or moving on to the next cherry-picked point. At best, you are talking to observers of your discussion. Ever tried discussing evolution with a young earth creationist? It becomes obvious quickly that discussion is never about the science but more about the importance of particular way of reading the bible to their beliefs. That is where the discussion needs to happen before they can be even open to talking about science. Hayhoe's TED talk I pointed to earlier suggests a similar way forward.
@585 scaddenp
Trust me he's a sly devil. He berates anyone who challenges his climate myths. He's a bully and his posts are very sneaky. He posts those two graphs so many times and tells people to "learn from them".
He's the most sneaky climate myth posting person I've ever encountered. He truly thinks he's smarter than all the rest.
The real devils are the ones that know they are lying rather than self-deluded. This one sounds more like they have acquired undue confidence from being deeply mired in denier myths.
scaddenp,
I agree. Morally corrupted people who know better but choose to try to keep others from being more aware and better understanding of what is really going on are a serious threat to the future of humanity.
Those who have been easily impressed into a Dunning-Kruger Effect belief in their Brilliance and Correctness in spite of the fact that they have been fooled into passionately holding an incorrect harmful belief is tragic.
Unfortunately the popularity and profitability of fossil fuel use motivates many people who do know better to behave in morally corrupt ways. And it makes it easier for them to tempt people into Dunning-Kruger Effect delusions supporting the incorrect claims used to justify less correction of the harmful unsustainable activity that has become so popular and profitable.
@ MA Rodgers
Well the denier went bezerk when I pointed out what you showed me he did with his graphs. This was his come back. Instead of the word tiny as you used I used the word minute.
"Minute?"
Are you that far out in left field?
Graph #2 starts at 151,423 years before present and ends at 131,455 years before present.
That covers 19,968 years.
How is 19,968 years "minute?"
The first interval on Graph #2 is 151,423 years before present to 149,921 years before present.
That's 1,502 years.
How is 1,502 years minute?
The time intervals are those in the US Government's NCDC NOAA Excel Chart for EPICA Ice Core Data.
That's how your own government published it.
[B][I]You're going to accuse and fault me, because you don't like how your own government published the data?[/I][/B]
Man, you people are cult-like.
Why join them together?
I know why....you want people to look at incredibly large time-intervals which hides the fact that there is no correlation between CO2 and temperature.
Graph #1 starts 131,329 years before present and ends at 111,862 years before present.
That covers 19,467 years.
How is 19,467 years a "minute" time interval?
Explain that to us.
No, all you've done is proven you're in total panic mode.
Again, I encourage and urge everyone to download the data and make your own graphs, so you can see CO2 does not increase temperature, but temperature does increase CO2.
See scaddenp what I mean? He's a sly devil bully.
Remember that he is correct that increasing temperature will also increase CO2 on century scale. CO2 is both forcing and feedback. There is no argument on that. The increase of CO2 that comes the milankovich-driven NH warming is what magnifies the event and what turns the NH-only forcing into a global forcing. The mechanism doesnt operate when exactly the same milankovich effect is working on the SH.
@590 scaddenp,
The thing he is wrong about is his claims in the first graph. He states over and over that "there is no relationship between CO2 and Temperature"...Then he posts these graphs.
Why would there be a time lag of thousand years between the end of the ice age in Antarctica compared to on the northern hemisphere?
There is obviously an Oldest Dryas, an Allerød-Bølling, a Younger Dryas and a Holocene in the world temperature records and in the ice core record from Vostok Antarctica but they are shifted by about thousand years which is a really long time period. Why would there be such a slow response to the increased CO2 levels on the northern hemisphere? It looks rather as if the dating of the Antarctica ice core temperature and CO2 records not are in agreement with the other global temperature records. I have been reading that the stratigraphic dating of the ice cores can differ from other dating methods by a millennium.
Is there an ice core record from the Greenland glaciers showing the CO2 concentrations and temperatur?
I haven’t found any so far. Anyone who has seen some comparison?
In what published scientific research did you read that?
A quick look at the paleoclimate archives shows CO2 data for GRIP and GISP2 though the records are nowhere near as long as those in Antarctica. I am not really sure that I understand the question about the end of the ice-age. The Milankovich forcings that control the broad timing ice ages are not synchronous between hemisphere. Furthermore the events mentioned are regional discursions thought to be driven by combinations of icesheet melting dynamics and oceanic processes. The processes are local not global. That said, the causes of D-O and Heinrich events is not settled science.
It's interesting that the CO2 readings from the Greenland cores don't match the readings from the Antarctic cores. One of the studies pointed to by scaddenp @595 says this in the abstract:
Just shows how carefully the scientists look at these things. They really do try to think of everything.
Oops forgot to add link to previous post:
https://www.ncdc.noaa.gov/paleo-search/study/17878
For more about problems with contamination of greenland CO2 by organic molecule reactions, see here. Antarctic cores have fewer issues.
You can look in Raymond Bradley's Paleoclimatology third edition about dating of ice cores. I think you cannot just compare time scales for different dating methods with one another without having some clear evidence for some time event like an volcanic eruption or similar which enables you to link the time scales together.
The Shakun study only covers the last degclaciation, not the entire 400,000 year period (of Vostok Ice Core records indicating a lag), so does not adequately explain this lag.
Whatsmore, the Shakun study offers a highly complex explanation to arrive at the "conclusion" that there was no lag. Is there empirical evidence to support the points made in their explanation or are these just theoretical e.g. ocean circulation, etc.? Do they arrive at the same conclusion "that there was no lag" for the rest of the 400,000 years?