


 Arguments


CO2 lags temperature - what does it mean?
What the science says...
| Select a level... |
 Basic
Basic
|
 Intermediate
|
 Advanced
| ||||
|
CO2 didn't initiate warming from past ice ages but it did amplify the warming. In fact, about 90% of the global warming followed the CO2 increase. |
|||||||
Climate Myth...
CO2 lags temperature
"An article in Science magazine illustrated that a rise in carbon dioxide did not precede a rise in temperatures, but actually lagged behind temperature rises by 200 to 1000 years. A rise in carbon dioxide levels could not have caused a rise in temperature if it followed the temperature." (Joe Barton, US House of Representatives (Texas) 1985-2019) - Full Statement
At a glance
Antarctic ice-core data today provide a continuous record on temperature and atmospheric composition that goes back for some 800,000 years. The data track the last few glacial periods and their abrupt endings, with rapid transitions into mild interglacials. But in some of the ice-cores, temperature rises first and is followed, a few hundred years later, by rising carbon dioxide (CO2) levels.
Certain purveyors of climate-myths seized on this observation, claiming it to be “proof” that carbon dioxide doesn't cause climate change. Wrong, wrong, wrong. But how? The answer lies in a beer-can.
In fact, you can do this one yourself. You need two cans of any fizzy beer. On a nice summer's day, take one out of the fridge and place it outside in direct sunshine for a few hours. Leave the other where it is. Then open the two at the same time. The warm one will froth like mad, half-emptying the can and making a mess. What is left in the can will be horrible and flat. Conversely, the one straight from the fridge will just give a “pfft” noise and will be pleasant to drink, being cool and fizzy.
What's that got to do with this myth? Well, you have just demonstrated an important point about the solubility of CO2 in water. CO2 gives fizzy drinks their fizz and it is far more soluble in colder water. As the water warms, it cannot hold onto as much CO2 and it starts to degas. Hence that flat lager.
Exactly the same principle applies to the oceans. When global warming is initiated, both land and the oceans start to warm up. On land, permafrost starts to thaw out, over vast areas. Carbon dioxide (and methane) are released, having been trapped in that permafrost deep-freeze for thousands of years. At sea, that “warm beer effect” kicks in. Thanks to both processes, atmospheric CO2 levels rise in earnest, amplifying and maintaining the warmth. That rise in CO2 thereby caused more of the gas to be released, warming things up yet more in a vicious cycle, known as a positive feedback. Other feedbacks kick in too: for example as the ice-sheets shrink, their ability to reflect Solar energy back out to space likewise decreases, so that heat is instead absorbed by Earth’s surface.
The trigger for the initial warming at the end of an ice-age is a favourable combination of cyclic patterns in Earth's orbit around the Sun, leading to a significant increase in the solar energy received by Earth's Northern Hemisphere. That's no secret. Glacial-interglacial transitions are caused by several factors working in combination – triggers and feedbacks. We've understood that for a long time.
And when you think about it, saying CO2 lagged temperature during glacial-interglacial transitions so cannot possibly be causing modern warming is a bit like saying, “chickens do not lay eggs, because they have been observed to hatch from them".
Please use this form to provide feedback about this new "At a glance" section. Read a more technical version below or dig deeper via the tabs above!
Further details
That CO2 can lag behind but amplify temperature during a glacial-interglacial transition was in fact predicted as long ago as 1990. In the paper The Ice-Core Record: Climate Sensitivity and Future Greenhouse Warming by Claude Lorius and colleagues published in the journal Nature in 1990, a key passage reads:
"The discovery of significant changes in climate forcing linked with the composition of the atmosphere has led to the idea that changes in the CO2 and CH4 content have played a significant part in the glacial-interglacial climate changes by amplifying, together with the growth and decay of the Northern Hemisphere ice sheets, the relatively weak orbital forcing and by constituting a link between the Northern and Southern Hemisphere climates."
This was published over a decade before ice core records were accurate enough to confirm a CO2 lag. We now know that CO2 did not initiate the warming from past ice ages but it did amplify the warming. In fact, about 90% of the global warming followed the CO2 increase.
Antarctic ice cores reveal an interesting story, now going back for around 800,000 years. During this period, changes in CO2 levels tend to follow changes in temperatures by about 600 to 1000 years, as illustrated in Figure 1 below. This has led some to disingenuously claim that CO2 simply cannot be responsible for the current global warming. Unsurprisingly, such a claim does not tell the whole story.
Figure 1: Vostok ice core records for carbon dioxide concentration and temperature change.
The initial change in temperature as an ice-age comes to an end is triggered by cyclic changes in Earth’s orbit around the sun, affecting the amount of seasonal sunlight reaching Earth’s surface in the Northern Hemisphere. The cycles are lengthy: all of them take tens of thousands of years to complete.As both land and oceans start to warm up, they both release large amounts of CO2 into the atmosphere, from melting permafrost and from warming ocean water, since CO2 solubility in water is greater in cold conditions. That release enhances the greenhouse effect, amplifying the warming trend and leading to yet more CO2 being degassed. In other words, increasing CO2 levels become both the cause and effect of further warming. Once started, it’s a vicious, self-reinforcing cycle - an excellent example of what science refers to as a positive climate feedback.
Indeed, such positive feedbacks are necessary to complete the shifts from glacial to interglacial conditions, since the effect of orbital changes alone are too weak to fully drive such variations. Additional positive feedbacks which play an important role in this process include other greenhouse gases like methane - you may have seen videos of that gas bubbling up through icy lakes in permafrost country and being ignited. Changes in ice sheet cover and vegetation patterns determine the amount of Solar energy getting absorbed by Earth’s surface or being reflected back out to space: decrease an ice-sheet’s area and warming will thereby increase.
The detailed mechanisms for the above general pattern have of course been investigated. In a 2012 study, published in the journal Nature (Shakun et al. 2012), Jeremy Shakun and colleagues looked at global temperature changes at the commencement of the last glacial-interglacial transition. This work added a lot of vital detail to our understanding of the CO2-temperature change relationship. They found that:
1) The Earth's orbital cycles triggered warming in the Arctic approximately 19,000 years ago, causing large amounts of ice to melt, flooding the oceans with fresh water.
2) This influx of fresh water then disrupted ocean current circulation, in turn causing a seesawing of heat between the hemispheres.
3) The Southern Hemisphere and its oceans warmed first, starting about 18,000 years ago. As the Southern Ocean warms, the solubility of CO2 in water falls. This causes the oceans to give up more CO2, releasing it into the atmosphere.
4) Finally, CO2 levels may lag temperature in some ice-core records from Antarctica, but in some other parts of the world the reverse was the case: temperature and CO2 either rose in pace or temperature lagged CO2. Figure 2 demonstrates this graphically and shows how things are never as simplistic as purveyors of misinformation would wish.
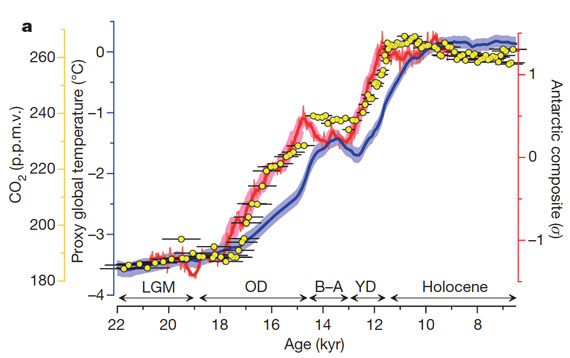
Figure 2: Average global temperature (blue), Antarctic temperature (red), and atmospheric CO2 concentration (yellow dots). Source.
Last updated on 14 February 2023 by John Mason. View Archives


Adri Norse Fire @547.
You say:- "I do not know if it's a good way to discredit me by supposing that those graphics are maliciously manipulated, that they are biased or that they are directly garbage."
Of those four graphics you presented @540, certainly three of them were "biased" to the point of being "directly garbage" although whether this "bias" was due to malicious manipulation I cannot say for sure. It could be simple incompetance.
As for your notion that I was 'discrediting' you - that I find surprising because you said of previous comment examining the failings of graphics you had presented that you had "liked the dissection" done and even offered up more charts on the stength of it (indeed you offered up the "garbage").
And off-topic, I note you also present @547 a link to a web blog provided by The Daily Sheeple (which has been described as "among the most untrustworthy sources in the media") suggesting this shows "NASA scientists" amongst other arguing for a potential "a new short cold period ... between 2030 and 2050." If you examine this web blog you link to, you actually see it shows no such thing. The "garbage" it presents on that matter is only supported by the well-konwn climate denier Don Westerbrook. The NASA scientist comment is solely about the sun, as is that of Clette & Lefevre. The NASA web page linked does say:-
but this still does not support your assertion of a NASA source for "a new short cold period ... between 2030 and 2050."
And please do not see this as "a good way to discredit" you, unless that is you choose to take no heed of this correction and continue spreading "garbage."
Concerning the global temperature rise since 1935 and my rhetorical question - averaging GISS, NOAA BEST & HadCRUT the rise is quite significant, so far totalling about 1ºC.
Adri... I take extreme exception to your comment relate blue sky and Stalin. No one here presents the arguments for AGW because anyone has "told them so." People you will encounter here at SkS are presenting the published scientific research which they've read and understand. We are presenting what has been researched and shown to be correct through a great deal of hard work by a long list of very intelligent and well-educated people.
Again, per my original question... When I read your comments it sounds to me as if you are starting from a position where you believe the science must be wrong, and you're attempting to rationalize that position before you even understand some of the most basic elements of the science. I'm trying to understand why you would do that rather than starting from a position saying you just don't know and proceeding to learn something about the science.
I fully admit, this is a challenge today because there are so many websites out there which present wrong information. You just have to have some capacity to decipher which resources are reliable and which are not.
Ardi
"Is it not science? When Jane Goodall is talking in a documentary about the behavior of chimpanzees is not science?"
No, it is not. It is one scientist explaining her work, and subject to the editing of the documentary maker. No other scientists review her comments, nor is there a "right of reply". Documentaries are often didactic (eg GGWS) and by selective editing/quoting present a view that is very different from what they actually support (ask Carl Wunshfor example.) Actual science is presented in peer-reviewed journals and thanks to citing tools it is easy to see whether the views expressed there have contested or accepted by other scientists.
"The IPCC review? Is it not true that there are a large number of non-scientific personnel among the IPCC? And then, why only the IPCC?"
Hmm, so it would appear you have again unskeptically accepted a comment from what source?? as an excuse to dismiss the views of the IPCC. See your biases at work? You still havent explained where these biases arise. When governments wanted to know about the science of climate change, they put together IPCC. The science of climate change (WG1) is a review of the all peer-reviewed science by a large team of international experts in the field. The people and their associations are listed in back, (but have you actually bothered to read it - or just spent time finding reasons to avoid conclusions you dont like?) Are you seriously suggesting that there is a more capable group for assessing climate science out there that we should take note of?
"Of course, you can convince me if what you say can be scientifically tested directly and not based on an assumption."
You would appear to have an extremely naive about the nature of scientific testing. Vast sections of the science cant be put on a laboratory bench. Instead science proceeds from investigation of the chain of causation and seeing what can be observed fits one theory or another.Climate theory makes a huge no. of predictions of which the most compelling is probably the change spectra and amount of radiation both irradiating the surface and being lost to space. Both are directly measured, both fit theory to extraordinary accuracy (see here and here). No other theory remotely fits the predictions.
You claim climate science is based on untested assumptions. Which would these be? Something you read from another unreliable source? Are conservation of energy and Planck's Law untested assumptions in your mind or is it okay for scientists to assume that?
So far people here have shown that sources you have relied on for your arguments are in fact from sewers of disinformation. MA Rogers above shows you how a link you provided distorts the science. If that were me, I would be angry that they duped me and would trust them no further. You? Or are your biases too powerful?
Adri Norse Fire @547, I just noticed from scaddenp's reply your comment to the effect that:
First, there are a large number of non-scientists among the IPCC personel. That is because the paid personel of the IPCC do not conduct the reviews. Instead, the paid personel are administrators who undertake publication, maintain the website, and reprsent the IPCC in meetings with other UN bodies/officials. The actual reviews are conducted by experts acting pro-bono.
You will note that I say "experts" and not scientists. That is again, because there are a large number of non-scientists among the authors of the IPCC. Specifically, the authors of Working Group 3 (dealing with the best policy for mitigation), and to a lesser extent Working Group 2 (dealing with impacts), include a large number of economists. The authors of Working Group 1 are (The scientific basis) are, however, exclusively scientists; and all IPCC authors are relevant experts.
Finally, you may have heard that the IPCC reports are political because the wording is voted on line by line by national (and hence typically political) representatives. That, however, is only true of the Summary for Policy Makers. It is why it is always better to read the Technical Summary, or the relevant sections of the individual chapters.
I will note that most wording changes in the Summary for Policy Makers have been at the insistence of states such as Saudi Arabia, who have had an obvious interest in downplaying the effects of anthropogenic global warming. To the extent that it introduces a bias, it causes the IPCC to underplay the risk.
@Rob Honeycutt - I find it quite arrogant that you assume that every tidbit of information on this website is accurate while others only produce incorrect data. This for me is the crux of the whole issue, the "us" vs. "them" mentality. The very fact that legitimate scientists are labeled as "deniers" (substitute heretic if you like) if they do not tow the company line, offends me, as it should any true person of science. When you enter into a scientific discovery with a bias, that should set off alarm bells.
When postulating a theory, it is the primary goal of the scientist postulating that theory that they make all attempts to disprove it, and allow others to make the same attempts and to not "fall in love" with it (please search for Dr. Richard Feynman and his lectures on the evolution of the oil drop experiment in calculating the charge of an electron and how credential bias delayed the calculation of it's true value). It's called transparency. The validity of an argument does not depend on whether it is peer reviewed or not either, we throw that idea around like it is the true litmus test of an idea. If it is the truth, it will survive all efforts to destroy it. In fact Einstein was offended that his papers needed to be peer reviewed. Peer review to me is censorship. If the goal is the truth, peer review is unecessary because it's quite possible that those peer gatekeepers are inadequite to fully understand new or "radical" concepts, like when Einstien and Rosen postulated that gravity was a wave. I feel it hobbles us as a species. True science is also not gouverned by concensus either (that single flawed paper that everyone clings to). We used to all agree that the world was flat remember?
I have a degree in physics, I understand how to read papers and understand how data is represented and mis-represented. Graphs are never or rarely presented with error bars which in itself smacks as unscientific. I will patently ignore any data set that does not have a full disclosure on the error analysis and indicate it clearly, yet the general public is led to believe that what they are seeing is gospel and not open to debate.
I do not know you Rob, as you do not know me, and I have no issue with your point of view, other than it should be stated that it is a point of view and not a definitive statement of the truth, because neither of us has earned the right to say what the truth is, and a great many people with greater qualifications than ours haven't earned that right either. The truth is or it isn't, it does not require concensus or cheerleaders.
[JH] Sloganeering snipped.
Being that the previous commenter is using a name that doesn't appear before this, I have no clue who it is. But it does seem that whatever I've said struck a nerve, even if the commenter doesn't refer specifically to anything I've said.
The argument against CO2 caused global warming is flawed. It is "apples and oranges" The time period cited is thousands of years ago. We were not relavent then as agents of climate change then. In the past 200 years, We have become exponentialy more effective in causing climate change up to the present. These changes are linked to CO2 changes.
Before this period, CO2 was not much effective as a cause of climate change.
Thank You - Poor rochard
Why do we have to converse in English? I'm tired of cutting and pasting into the google translator and then I have to interpret what you mean. I guess it's my fault because this is a web in English.
Tom Curtis
You have described very well the improved method that used PAGES 2000, but that does not imply that it is a truly impartial reconstruction because as I said to have more markers in some continents than in others, in doing the average the global reconstruction has a better representation of certain parts of the world than others and the final reconstruction is biased. When you have many more proxies in some areas than in others, the average of the continents is partial in not having a similar number of proxies in the different areas. In other words the final result will approximate more faithfully to some means than others and therefore will condition the global average. To have a really faithful chart, they should have many more proxies in Africa, for example. But as you say, the PAGES 2000 chart is more reliable than that of Loehle and McCulloch. But back to the beginning, what about my appreciation on the PAGES 2000 chart?
MA Rodger
It is true what you say about the first chart, but the paper it refers to also says: ''From an analysis of 6000 continental borehole thermal records to ammonia the world (14), Huang et al. Conclude that 500 to 1000 years ago, temperatures were warmer than today, '' Which is valid for my initial question.
The second chart has probably been made by the man shown below, '' Nasif Nahle '' from the three sources he quotes. But the temperature of the chart is at least exactly the same as that of Dahl-Jensen's study and in that study it also says: '' The last 10 ky BP. The CO is 2.5 K warmer than the present temperature, and at 5 ka the temperature slowly cools toward the cold temperatures found around 2 ka. (C) The last 2000 years. The medieval warming (1000 A.D.) is 1 K warmer than the present temperature, and the LIA is seen to have two minimums at 1500 and 1850 A.D. The LIA is followed by a temperature rise culminating around 1930 A.D. Temperature cools between 1940 and 1995. ''
If you have a good eye you will see that the third graph shows that the peak temperature is 0.7 no to 0.5 therefore there does not seem to be much difference between today and the Medieval Warm Period according to that chart.
And as for the last chart, I agree with you that it is a slop. But it seems that you have missed one of the first graphics I put. The CO2 graph for 800,000 years. Maybe you should dissect it too, do not misunderstand me, I still like the dissections you do.
It is true as you say that NASA has not made these findings public, but those who did it, have been using the data provided by NASA, as you can see here: https://solarscience.msfc.nasa.gov/SunspotCycle.shtml
Rob Honeycutt
Very good. You really are right, but I'm not starting from scratch. Obviously I am not an expert and I recognize that I do not defend very well in the details, but I think I know something more than the average about science.
You already have your answer, but you must admit that it is good for you as a scientist (if you are) to have someone come forward to rebut your arguments. If something is really scientific it must be susceptible of being falsified or refuted, right? Science advances through essay and error. I'm doing you a favor, then.
scaddenp
So no statement of any documentary on science is true? First of all, I did not say that this is how "science works", of course not, I mean that is how science is taught to the public. And Jane Goddall teaches science through the media, as much as David Attenborough. I have no reason to distrust more of one man whose base is in Antarctica, than what you tell me.
<Hmm, so it would appear you have again unskeptically accepted a comment from what source ??> You can see that Tom Curtis himself confirms it (That there are a lot of non-scientific staff).
You build on this subject in a supposed consensus that does not exist, perhaps in public and political opinion itself. But I have seen that in the scientific community the subject is far from being consensual, although the majority supports the anthropogenic global warming. It's not like I said before, like the law of gravity.
<You claim climate science is based on untested assumptions. Which would these be?> That the share of CO2 produced by human emissions causes current global warming, for example.
<You? Or are your biases too powerful?> Haha, well I am not angry and as you have been able to check now, the graphics I put are not very good, but neither are the rubbish to which Mr. MA Rodgers alluded.
Tom Curtis
Again, thank you for the information. And yes, I immediately noticed that appreciation.
-------------------------------------------
And I want to add something, you do not seem very convinced about the solar theory to which I alluded and is normal if you are not familiar with it. I just want to say that I do not know your age, I will be alive between 2030 and 2050 but I guess those who live with me will be able to see it firsthand.
And for MA Rodgers, I have just remembered the names of leading Russian scientists who have come to similar conclusions on this subject, Mr. Abdusamatov and Mrs. Zharkova.
http://www.wetter.at/wetter/welt-wetter/Sonne-extrem-ruhig-Kommt-Mini-Eiszeit/241375001
http://www.express.co.uk/news/science/723481/Earth-ICE-AGE-big-freeze-solar-activity
http://www.dailymail.co.uk/sciencetech/article-3156594/Is-mini-ICE-AGE-way-Scientists-warn-sun-sleep-2020-cause-temperatures-plummet.html
http://www.forbes.com/sites/larrybell/2014/01/21/miss-global-warming-yet-if-not-just-wait-and-you-might/#c2e266161996
https://www.omicsgroup.org/journals/grand-minimum-of-the-total-solar-irradiance-leads-to-the-little-ice-age-2329-6755.1000113.pdf
https://www.youtube.com/watch?v=7sh_nlz43Pc
I do not know why but it seems that there is an error in the server of Nature about the article of the Mrs. Zharkova, perhaps a ray? Just write it on google and try to have it if you can. Best regards.
>So no statement of any documentary on science is true?
Of course not, but it cannot be assumed that this is what the science actually does say especially if the documentary has a point to make other than informing about science in a disinterested way. They are not a source on which to found an opinion without checking actual science first.
>I have no reason to distrust more of one man whose base is in Antarctica, than what you tell me.
Since I dont know documentary you refer to, nor the wording or context of the statement, so it is hard to comment, but someone stating opinions at variance to rest of the scientific community should be fact checked. What was the documentary so we can evaluate your source perhaps? You still havent explained your process for evaluating one source of information (eg something you heard on a documentary) versus another (say the IPCC reports).
"You can see that Tom Curtis himself confirms it (That there are a lot of non-scientific staff)."
Seriously?? You can distrust the IPCC because their administrators arent scientists? That is what you are trying to imply? All the actual writers and reviewers of the science of climate change are scientists as Tom said or did your brain just censor that information because it would destroy your case?
But I have seen that in the scientific community the subject is far from being consensual,
Your evidence for this please?
That the share of CO2 produced by human emissions causes current global warming,
That is NOT an assumption! That is conclusion of the studies. Predicted by science long before global warming even noticiable. Just in case we have problem with assumption in google translate, an assumption is that which is deemed to be true at commencement of a study. For climate science, that would be laws of physics and chemistry. You would us and yourself a favour if you actually read the IPCC chapter of attribution instead of you making assumptions about how the science was actually done.
Adri... Let's look at that logic from another angle. Okay?
You go to a doctor because you have some condition that you'd like to have examined by an expert. You go to that person because you know they have years of training in their field. They are the expert and you are not. Right?
The same applies to climate science. The people who do the research are experts in their fields. They are people who've spent their entire professional career studying the subject matter. They have a very deep understanding of the subject matter which other people don't have.
When you go to the doctor, and that doctor gives you their professional opinion, do you say, "Well, you need me here to challenge your expertise. I can find many things on the internet that disagree with your diagnosis! How can I trust that your diagnosis is correct?"
No. You don't. If the diagnosis bothers you for some reason, you might go ask a second professional for their opinion. But that's about it.
But you are here suggesting that you have the capacity to actually challenge the overwhelmingly agreed consensus of professionals related to man-made climate change.
Most scientists in other fields would say they don't have the expertise in climate science to challenge the consensus position. They don't just blindly accept the science. If they're curious they will spend time trying to learn why there is such a broad and overwhelming consensus. But they certainly don't try to blindly challenge the science without first fully informing themselves on the topic by reading the relevant scientific research. And they certainly aren't going to trust blogs to inform them.
Adri Norse Fire @558.
You will appreciate that I am only able to interpret your written words. @532 you appear quite definite saying “The question is whether we have the highest concentration of atmospheric CO2 in 800,000 years, without going further, why the current temperature is 1.5 ° lower than the medieval warm period?“ I did point out that the value “1.5 ° lower” was not properly defined as the units of degree were absent. But if you have modified your position to be now arguing that “500 to 1000 years ago, temperatures were warmer than today,” that is fine. However do note you are wrong to say that such a statement is “valid for (your) initial question.” It is not.
Also it is wrong to cite Broecker (2001) in the manner that you do. Broecker do reference Huang et al (1997) in the manner you quote and Huang et al do set out that data supporting their findings. Indeed, Huang et al do provide a significant portion of the evidence for a global MWP presented by Broecker. However Broecker (2001) concludes “The case for a global Medieval Warm Period admittedly remains inconclusive.” And the graphic you provided @532 which attempts to use Broecker (2001) to support itself is, as explained @543, utter garbage.
Your defence of the second graphic you presented @532 doesn't explain why the Dye 3 temperature profile developed by Dahl-Jensen et al (2009) is omitted. Nor does it explain the second trace on the graphic you presented. Nor does it provide any resolution to the case for a global MWP. As set out @543, that graphic is also utter garbage.
The data presented in the third graphic @532 ends at 1935. I thought mention of the global warming 1935-to-date establshed by the global thermometer record would prevent your use of the 1935 end-point of that graphic to support your unsupported assertions. I can but repeat that you are wrong to do so.
And the fourth you now agree is garbage.
Your final point in this particular list @558 seems to be saying that someone can misuse data if it comes from a legitimate source. That is very wrong. You do require to show use of legitimate data by “those who did it,” with “it” being the proper use of NASA data to predict "a new short cold period ... between 2030 and 2050." The best of luck with that fool's errand!!
But I should make plain that this discussion of individual data sets (and the garbage) is not the proper way to develop a case for asserting that “500 to 1000 years ago, temperatures were warmer than today.” Always the first step should be to assess the present state of the science on the subject. Although it is a few years old now IPCC AR5 is surely the place to start, particularly Chapter 5 - Section 5.3.5 or perhaps more helpfully the Technical Summary Section TS.2.2.1. You will quickly see that you will have quite a job on your hands asserting that “500 to 1000 years ago, temperatures were warmer than today.”
Your additional web-links @558 add nothing to this situation. They concern the future, not the past. And in this, Zharkova et al (2015) is solely talking about the sun not our climate. The garbage you link to in the English-speaking press is entirely wrong in suggesting there is a prediction of climate within this work. Indeed, does not your German link say “Kein Effekt auf globale Erwärmung “?
And if you think Abdussamatov (2013) is worth quoting (as your Forbes link does), do note the scientific response since publication – he has gained the attentions of nothing but a tiny pile of denialists. And that is because Abdussamatov (2013) spouts garbage.
I have recently come across a study that has led me to question the very basis of anthropomorphic climate change (something I haven't been seriously forced into before). This study claims to have revealed that present day CO2 increases still lag behind temperature increases when you would expect it to precede it as the main driver of the observed temperature increase since 1975. From the abstract:
"The maximum positive correlation between CO2 and temperature is found for CO2 lagging 11-12 months in relation to global sea surface temperature, 9.5-10 months to global surface air temperature, and about 9 months to global lower troposphere temperature"
If CO2 is indeed the driver of this current period of accelerated warming, as the theory states, surely temperature would lag CO2, wouldn't it? What am I missing here?
http://www.tech-know-group.com/papers/Carbon_dioxide_Humlum_et_al.pdf
Apologies if this study has been covered elsewhere but my limited research indicates that it's been ignored by subscribers to the anthropomorphic climate change theory since it was published and contrarians are using it with little resistance.
I do not like being wrong, being repeatedly accused of belonging to the church of global warming is irritating enough. But cognitive dissonance is a worse. I'm more inclined to change my outlook than ignore evidence, though not without a fight obviously...
Does anyone have any suggestions as to why CO2 might still lag temperature, if indeed it is?
Malpeli @562, the short answer is that in determining the lags, Humlum first subtracts from each monthly temperature or CO2 concentration value, the value of that same data from the month exactly one year before. The effect of this process is to remove the trend. Therefore, at most all he can logically conclude is that temperature is responsible for the variations in CO2 concentration around the trend line. He is certainly unable to conclude from that that temperature is responsible for the trend in CO2, as he has removed all data about that trend from his analysis.
Further, when you examine the data you see a variation in temperature across a range of 1 C, and a variation of of CO2 concentration across about 3 ppmv. It follows that if we accept Humlum's analysis as he presents it, we would deduce (very roughly) a relationship in which each 1 C of temperature rise would result in 3 ppmv increase in CO2 concentration. We would then note that there has been approximately a 1 C increase in Global Mean Surface Temperature since 1900, and hence deduce that CO2 levels have only risen by 3 ppmv due to the increase in temperature, with the rest being due to some other factor. I have done that analysis more exactly using the full Mauna Loa record together with the BEST Land Ocean Temperature Index and found an expected increase of 0.56 +/- 0.32 ppmv of CO2 per degree increase in GMST. Humlum knows the implications of that data, and therefore carefully does not include the relevant analysis in his paper.
A big problem with Humlum’s claim is the period from 1940 to 1975.
Using SkS’s trend calculator I find the trend in this period to be -0.024oC/decade with data from NASA-GISS and -0.015oC/decade with data from Berkeley Earth, plus/minus some uncertainty for both.
In the same 35 year period the global mean CO2 concentration increased from 311 to 331 ppm. Where did those 155 gigatonnes of extra CO2 come from when both land and sea surface temperature trends were close to zero or slightly negative?
malpeli - Long story short with Humlum: if you remove the trend before analysis, then claim from what's left that the trend doesn't exist, you have done your analysis incorrectly. I won't speculate on why his analysis is so poor, but I'll point out that Humlum has a history of similar errors.
The link to "The ice-core record: climate sensitivity and future greenhouse warming by Claude Lorius (co-authored by James Hansen)" is broken. I found it here:
http://www.atmos.washington.edu/2009Q1/111/Readings/Lorius1990_ice-core.pdf
[PS] Thanks. Created link
I am just trying to understand this so please bear with me. Looking at the series of temperature changes (3 in all in Figure 1 Vostok ice core records) in the graph of CO2 versus global temperature, there seems to be a long-period cycle at work. Or there was perhaps if man has changed things. It seems the current peak is actually lower than the first, despite man's injection of CO2. It is hard to separate the CO2 from the temperature for this recent peak due to the long period in the graph and large time scale.
Is there a graph with the same axes covering a shorter period such as the width of the previous cycle? It would also be interesting to see each of the 3 cycles split out with better resolution to see if this time, as early in the cycle as it is, is different and, if it is, by how much and how it is trending. I suspect this might be available somewhere, but I am new here and not sure how to find it or even ask so please forgive my lack of information on this.
"Zero" on the graph is not really present day. At no time on that graph does CO2 ppm exceed 300pm. We are now over 400pm. The last time earth was at 400 was in the pliocene when it was too warm for ice age cycles.
And yes, there are long period cycles at work - the Milankovich cycles. A complex series of feedbacks accompany the ice age cycle. As ice extends down on NH, swamps freeze over, vegetation changes, sea level drops exposing more land for plant colonization, and as temperature of ocean drops, its ability to hold dissolved CO2 increases. All work to reduce CO2 in atmosphere. Works in reverse when orbital forcing changes the other way.
In summary you cannot change the temperature of the planet without also changing the CO2 concentration the atmosphere which then acts as a feedback to amplify that change (and to make NH driven changes into global changes). However, these are also very slow feedback systems, operating over 100s to 1000s of years (because it takes nearly a 1000 years for ocean to equilibrate). Eventually we will see these feedbacks cut in from our forced change to climate but not in this century to any great deal.
What do we know about the mechanisms that lead to cooling and reduction of carbon dioxide in the atmosphere and oceans?
[TD] Orbital cycles eventually reduce the insolation of the northern hemisphere, reversing their earlier increase of insolation that triggered warming that resulted in CO2 increase. Ice and snow in that region melt later and less, thereby increasing albedo, cooling the oceans, and the cooler oceans increase their CO2 by pulling it from the atmosphere. Also, as ice and snow retreat, more rocks are exposed, increasing the removal of CO2 from the atmosphere by rock weathering.
As this is my first post on this site I will explain that I am not yet convinced of human caused global warming. I am on this site to gain knowledge so that I can make an informed decision.
i noticed a couple of you discussing the subject of how to label those of us who have not been convinced and those of you who are. To be blunt, labels tick people off! Why do we need them. Call them for what they are...convinced and not yet convinced or some benign variation. What the situation tells me is that this community has done a terrible job of explaining the issue. Katharine Hayhoe is an exception. She and I have tweeted back and forth on this subject and she has never made me feel stupid for asking questions. Not to mention some great videos she has posted. All should learn from her example.
[PS] Welcome to skeptical science. We hope that you find the resources useful. While we discourage labels, there is a distinction between those weighing the evidence to understand scientific conclusions and those who ideological convictions cause them to deny scientific evidence altogether. If someone is skeptical about peer-reviewed science but swallow without question some garbage on a website that fits their convictions then they are well described as a pseudo-skeptics.
Please read and ensure you comply with the comments policy and you will find people here happy to answer questions. Dont make assertions without referencing evidence.
This has probably been said but the first graph looks cyclic to me. Also, the graphs have been correlated to two other scientific phenomena, oxygen isotope ratio variation and extinctions. The point is, climate change has happened before and likely will happen again. Check out the Mike Krichew theory of what causes ice ages on my facebook page. If my theory is correct and the IPCC has pretty much proved the first part of it, then unless you want to spend money on cooling the ocean and removing CO2 from the air then we are going to see what global warming is. I believe but could be wrong that the ocean is already warming and giving off more carbon dioxide than we do burning fossil fuels. Folks, the ship has sailed or the train has left the station. We are going to find out the results of what we started.
mkrichew - the first graph (Fig 1) is cyclic in sense that it is the superposition of the 3 Milankovich cycles. These orbital cycles affect climate by making large variation to insolation around 65N, affecting the albedo by changes in snow cover which in turn sets up other feedbacks. However, they only came to affect climate when CO2 dropped below 400ppm (long term geological sequestration). They dont do much in a warmer earth. Note also that those cycles are slow. A maximum change in forcing of around 0.25W/m2 per century at 65N compared with 1.66W/m2 per century from CO2 alone across entire whole globe.
"I believe but could be wrong that the ocean is already warming and giving off more carbon dioxide than we do burning fossil fuels"
Fortunately, you are wrong. The oceans are still net absorbers of CO2 and will continue to do so for centuries (ocean mixing takes a long time). Details in Ar5 chp 6.
mkrichew
To expand on pscadden's comment. If CO2 concentrations in the atmosphere were steady and temperatures were rising, then the ocean would be outgassing. That is basic chemistry from Henry's Law.
However, since we are adding lots of CO2 to the atmosphere, the need to equilibrate CO2 concentrations in the ocean and the atmosphere means that CO2 levels in the oceans need to rise. The temperature dependent aspect of Henry's Law is outweighed by the partial pressure dependency.
Above in the third listed point of the intermediate explanation, the statement is made “The Southern Hemisphere and its oceans warmed first, starting about 18,000 years ago.”
In a posting on RealClimate at http://www.realclimate.org/index.php/archives/2017/07/climate-sensitivity-estimates-and-corrections/ , Gavin Schmidt discusses methods of getting climate sensitivities from paleoclimatic data. He says that “Others have identified the lags in the southern ocean (which warms more slowly than the northern hemisphere, and northern land in particular) as the source of this time dependence of feedbacks, …” and so on.
Can someone please explain this difference in claim as to which hemisphere warmed first, or am I somehow asking the wrong question?
Tcflood @574 ,
if I am understanding Dana's point correctly, he means that the land surface (most land being in the NH) warmed faster than the ocean. This affected glacial ice, to melt and discharge fresh water into the northern Atlantic Ocean. The Atlantic Meridional Overturning Circulation was disrupted by the "flood" of fresh water, and impeded/handicapped the north Atlantic warming — allowing time for the Southern Ocean's warming to leapfrog ahead of the northern oceans (including, presumably, the north Pacific Ocean).
The Southern Ocean's warming being the major source of CO2 release (as oceanic CO2 solubility reduces) . . . fits in with the ~1000 year "lag" in the warming/CO2-rise relationship. Remembering that the initial small warming from Milankovitch orbital effect does trigger the much larger planetary warming from CO2.
So no actual discordance between the comments at SkS and RealClimate.