


 Arguments


CO2 lags temperature - what does it mean?
What the science says...
| Select a level... |
 Basic
Basic
|
 Intermediate
|
 Advanced
| ||||
|
CO2 didn't initiate warming from past ice ages but it did amplify the warming. In fact, about 90% of the global warming followed the CO2 increase. |
|||||||
Climate Myth...
CO2 lags temperature
"An article in Science magazine illustrated that a rise in carbon dioxide did not precede a rise in temperatures, but actually lagged behind temperature rises by 200 to 1000 years. A rise in carbon dioxide levels could not have caused a rise in temperature if it followed the temperature." (Joe Barton, US House of Representatives (Texas) 1985-2019) - Full Statement
At a glance
Antarctic ice-core data today provide a continuous record on temperature and atmospheric composition that goes back for some 800,000 years. The data track the last few glacial periods and their abrupt endings, with rapid transitions into mild interglacials. But in some of the ice-cores, temperature rises first and is followed, a few hundred years later, by rising carbon dioxide (CO2) levels.
Certain purveyors of climate-myths seized on this observation, claiming it to be “proof” that carbon dioxide doesn't cause climate change. Wrong, wrong, wrong. But how? The answer lies in a beer-can.
In fact, you can do this one yourself. You need two cans of any fizzy beer. On a nice summer's day, take one out of the fridge and place it outside in direct sunshine for a few hours. Leave the other where it is. Then open the two at the same time. The warm one will froth like mad, half-emptying the can and making a mess. What is left in the can will be horrible and flat. Conversely, the one straight from the fridge will just give a “pfft” noise and will be pleasant to drink, being cool and fizzy.
What's that got to do with this myth? Well, you have just demonstrated an important point about the solubility of CO2 in water. CO2 gives fizzy drinks their fizz and it is far more soluble in colder water. As the water warms, it cannot hold onto as much CO2 and it starts to degas. Hence that flat lager.
Exactly the same principle applies to the oceans. When global warming is initiated, both land and the oceans start to warm up. On land, permafrost starts to thaw out, over vast areas. Carbon dioxide (and methane) are released, having been trapped in that permafrost deep-freeze for thousands of years. At sea, that “warm beer effect” kicks in. Thanks to both processes, atmospheric CO2 levels rise in earnest, amplifying and maintaining the warmth. That rise in CO2 thereby caused more of the gas to be released, warming things up yet more in a vicious cycle, known as a positive feedback. Other feedbacks kick in too: for example as the ice-sheets shrink, their ability to reflect Solar energy back out to space likewise decreases, so that heat is instead absorbed by Earth’s surface.
The trigger for the initial warming at the end of an ice-age is a favourable combination of cyclic patterns in Earth's orbit around the Sun, leading to a significant increase in the solar energy received by Earth's Northern Hemisphere. That's no secret. Glacial-interglacial transitions are caused by several factors working in combination – triggers and feedbacks. We've understood that for a long time.
And when you think about it, saying CO2 lagged temperature during glacial-interglacial transitions so cannot possibly be causing modern warming is a bit like saying, “chickens do not lay eggs, because they have been observed to hatch from them".
Please use this form to provide feedback about this new "At a glance" section. Read a more technical version below or dig deeper via the tabs above!
Further details
That CO2 can lag behind but amplify temperature during a glacial-interglacial transition was in fact predicted as long ago as 1990. In the paper The Ice-Core Record: Climate Sensitivity and Future Greenhouse Warming by Claude Lorius and colleagues published in the journal Nature in 1990, a key passage reads:
"The discovery of significant changes in climate forcing linked with the composition of the atmosphere has led to the idea that changes in the CO2 and CH4 content have played a significant part in the glacial-interglacial climate changes by amplifying, together with the growth and decay of the Northern Hemisphere ice sheets, the relatively weak orbital forcing and by constituting a link between the Northern and Southern Hemisphere climates."
This was published over a decade before ice core records were accurate enough to confirm a CO2 lag. We now know that CO2 did not initiate the warming from past ice ages but it did amplify the warming. In fact, about 90% of the global warming followed the CO2 increase.
Antarctic ice cores reveal an interesting story, now going back for around 800,000 years. During this period, changes in CO2 levels tend to follow changes in temperatures by about 600 to 1000 years, as illustrated in Figure 1 below. This has led some to disingenuously claim that CO2 simply cannot be responsible for the current global warming. Unsurprisingly, such a claim does not tell the whole story.
Figure 1: Vostok ice core records for carbon dioxide concentration and temperature change.
The initial change in temperature as an ice-age comes to an end is triggered by cyclic changes in Earth’s orbit around the sun, affecting the amount of seasonal sunlight reaching Earth’s surface in the Northern Hemisphere. The cycles are lengthy: all of them take tens of thousands of years to complete.As both land and oceans start to warm up, they both release large amounts of CO2 into the atmosphere, from melting permafrost and from warming ocean water, since CO2 solubility in water is greater in cold conditions. That release enhances the greenhouse effect, amplifying the warming trend and leading to yet more CO2 being degassed. In other words, increasing CO2 levels become both the cause and effect of further warming. Once started, it’s a vicious, self-reinforcing cycle - an excellent example of what science refers to as a positive climate feedback.
Indeed, such positive feedbacks are necessary to complete the shifts from glacial to interglacial conditions, since the effect of orbital changes alone are too weak to fully drive such variations. Additional positive feedbacks which play an important role in this process include other greenhouse gases like methane - you may have seen videos of that gas bubbling up through icy lakes in permafrost country and being ignited. Changes in ice sheet cover and vegetation patterns determine the amount of Solar energy getting absorbed by Earth’s surface or being reflected back out to space: decrease an ice-sheet’s area and warming will thereby increase.
The detailed mechanisms for the above general pattern have of course been investigated. In a 2012 study, published in the journal Nature (Shakun et al. 2012), Jeremy Shakun and colleagues looked at global temperature changes at the commencement of the last glacial-interglacial transition. This work added a lot of vital detail to our understanding of the CO2-temperature change relationship. They found that:
1) The Earth's orbital cycles triggered warming in the Arctic approximately 19,000 years ago, causing large amounts of ice to melt, flooding the oceans with fresh water.
2) This influx of fresh water then disrupted ocean current circulation, in turn causing a seesawing of heat between the hemispheres.
3) The Southern Hemisphere and its oceans warmed first, starting about 18,000 years ago. As the Southern Ocean warms, the solubility of CO2 in water falls. This causes the oceans to give up more CO2, releasing it into the atmosphere.
4) Finally, CO2 levels may lag temperature in some ice-core records from Antarctica, but in some other parts of the world the reverse was the case: temperature and CO2 either rose in pace or temperature lagged CO2. Figure 2 demonstrates this graphically and shows how things are never as simplistic as purveyors of misinformation would wish.
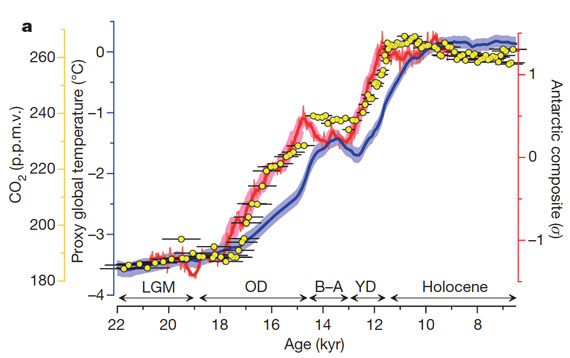
Figure 2: Average global temperature (blue), Antarctic temperature (red), and atmospheric CO2 concentration (yellow dots). Source.
Last updated on 14 February 2023 by John Mason. View Archives


Sorry if this has already been answered before.
How long do human GHG emissions namely CO2 remain in the atmosphere?
Let's ask ourselves:
"What would happen if we magically cease all CO2 emissions and hold them at zero, forever?"
What will happen is that the oceans and lakes will start "breathing out" the CO2 we are chemically overstuffing them with.
1. Normally, warming water holds less CO2. However, the partial pressure differential of CO2 in our atmosphere at the water:atmosphere interface (the thin skin layer of the waters) is such that our waters are forcibly having CO2 sequestered in them. This is the mechanism of action that is acidifying our waters.
2. As fossil fuel usages are eliminated, atmospheric levels of CO2 will stabilize. As levels then start to decline, the partial pressure differential of CO2 at the water:atmosphere interface will reverse...and the oceans and lakes will begin to give up the many gigatons of CO2 we have forced them to hold onto for us.
3. As a result, atmospheric CO2 levels will stay very stable for many decades before slowly declining. 300 years after the cessation of the usage of fossil fuels, more than 10% of the man-made rise in atmospheric CO2 will still be there. From the AR5, WG1, Box 6.1:
Per David Archer's Nature paper 'Carbon is forever':
https://www.nature.com/articles/climate.2008.122
At the end of The Long Thaw, David Archer calculates that the amount of energy that is trapped by the CO2 produced by burning gasoline today is, over its atmospheric lifetime, 40 million times the amount of fuel energy released today.
"Longer than nuclear waste"...savor that thought.
"Great question. Also an intellegent question. It's something that many Climate Scientists have tried to brush off with a "yes, but CO2 then becomes the forcing agent" as if autocorrelation is only done at the beginning of each interglacial phase. It isn't. It's done over the entire time series, including when CO2 is suppose to become the forcing factor."
Let's break this down. Firstly, do you accept that glacial cycle is orbitally forced? Further discussion makes no sense if this is not the case.
Assuming you accept orbital forcing, how do you explain why SH glaciation is synchronous with NH (since orbital forcing is anti-phased). Its easy if you accept known physics (GHE included) but you apparently want to deny that increasing CO2 will warm the planet.
Secondly, how about linking to some more actual detail about your "autocorrelation" stuff. I dont get your point and I certainly not clear to me what you think you are proving. The relationship between T and CO2 is still somewhat unconstrained but is clearly non-linear and involves multiple mechanisms operating on scales from years to millenia.
What is the basis for your understanding of "their ever decreasing estimates of how much CO2 impact climate". I certainly do not get that from successive IPCC reports.
You seem to be implying that papers on direct observation were arguments from correlation. This is not the case. The arguments in those are of the form, "fundimental physics allows us to predict what observations done by this method would show. Let compare model results with observation".
So from this, you compute how much much the radiation at the surface will change with GHG concentration change - and measure it. You look at how GHG changes would change the spectrum of outgoing or incoming radiation - and measure them. That is what those papers do. Hansen and Sato compute forcing from change in GHG using ice core bubbles as proxy for atmospheric concentration, and compute the change in albedo based on sealevel etc, and finally the global solar irradiation change from milankovitch. Climate theory would expect icecore temperature to be related to that forcing calculation extremely closely and that is what is observed. A failure to observe that would be evidence against.
Can I ask whether you accept Planck Law? ie, if irradiation of surface increases, then it temperature must rise.
Finally, climate change at present appears to be forced by GHG change. The feedback mechanisms that apply during ice ages wont cut in any significant way for 100s of years. The natural system is still moping up about half of our emissions which make 616 invalid (actually so many issues with this, its hard to know where to start. You need 30 year averages remove the internally variability, especially ENSO.)
Rats, arguing with sockpuppet. What a waste of time.
Scaddenp , thanks for your recent comments.
My sympathies, over the sockpuppet business.
At first glance, his comments were rather bizarre and halfway to word-salad. But I always remain hopeful that some Denialist (given enough rope) will one day come up with a decently valid point against AGW science.
But it hasn't happened yet !
Sorry indeed about the sockpuppetry. In any case, the argument made no sense whatsoever. It's not like there isn't a well known, precisely measured, accurately modeled physical mechanism...
So basically you are admitting, that there is influence on earth by the cosmos after all? "Several factors have affected past climate change, including solar variability, volcanic activity and changes in the composition of the atmosphere." yet you have on the "conspiracy theories" meter on the left most of them proven even by you facts? :D
[DB] You are off-topic. Cosmic Rays, The Sun, Volcanoes and Trace Gas, etc all have their own threads here examining what the actual science has to say about each. The Search function will find hundreds more.
Regulars here have many years of experience and education in these topics, so you will need to read every thread and the comments on them before commenting.
Szponiasty , your comment sounds a bit jumbled. Perhaps it has been distorted and sabotaged by cosmic conspiracists? :D
Try again, but more clearly!! (And perhaps you are in the wrong thread?)
Looking at figure 2 the global temperature shows an increase of 3.5C and a CO2 increase of about 1.5. This would indicate a higher climate sensitivity that the 3.0C per the IPCC. Is this just one of the calculations that shows a higher climate sensitivity?
Also the global temperature change is 3.5C while the Antarctic temperature change is 2.0C. Doesn’t temperature change increase as the area included decreases (global vs more local)?
Hi Folks! Great site, learning Kt of CO2 info!
On this particular topic, I do have some questions regarding CO2 solubility. CO2 solubility decreases with increasing temperature, we all know that. We also know it's in equlibrium with the ocean and atmosphere. However, I can't find any solid data indicating the actual soluble CO2 levels in the ocean.
However, CO2 solubility is quite high and is above 300 ppm even at elevated temperatures. So, shouldn't our oceans be constantly absorbing CO2 and never truly be releasing it? I mean, a small temp rise would only release CO2 if we were at saturation (and I don't believe we are otherwise the pH of the ocean would be much lower). Also, once CO2 enters the ocean, it converts to carbonic acid and then bicarbonate (alkalinity). So, My understanding is that in order to release CO2 below saturation you decrease pH to convert bicarbonate to CO2 per the carbonate equilibrium.
I guess what I am trying to figure out is why the ocean would release CO2 when it's aqueous concentration is well below it's solubility limits for the temperatures we are looking at? I have modelled it and it seems I can easily get seawater to accept CO2 concentrations up to 1000 mg/L at ocean temps
This brings me to my next question which is why the oceans would offgas when the concentrations never exceed 300 ppm historically (within the timeframe that is being considered in the graphic at the top of this topic) and the delta T never increased more than 4degC?
Does anyone have a link to any good papers describing this in more detail with actual CO2 solubility charts and references to ocean pH and such? I have scoured the web and haven't found anything that I would be willing to take to the bank. I really want to understand better how this small temp rise would have been capable of releasing this much CO2 into the atmosphere) when most of this CO2 is almost immediately converted to bicarbonate and would require a substantial pH shift to drive it out of solution. I'm not syaing for a minute that this is not the case but clearly I am missing something and just want to learn...
[PS] on short time frames (less than 800-1000 years), ocean/atmosphere chemistry is complicated. The OA is not OK series, starting here, takes you through the gritty detail. You are correct that oceans are currently absorbing CO2 (getting more acidic) and will continue to do so for hundreds of years.
Should also say that "The warming causes the oceans to release CO2" in article is simplistic. There are multiple CO2 reservoirs involved in ice-age cycle, especially asian wetlands and maybe clathrates. Determining the precise sources/sinks of CO2 is still an unconstrained problem as far as I am aware.
As always, the IPCC reports are a good summary and index into the literature. See Chp 6 of AR5 WG1, esp 6.2 forward
If temperature kicks of the CO2-temp feedback look then how come it keeps stopping? How come temp keeps dropping (followed by CO2 drops).. Why doesn't it just runaway?
in reality it seems that CO2 is far more tightly statistically correlated with temp than vice versa.
TomJanson @612,
I'm not sure what you mean by things being "statistically correlated" so cannot say more than that the usual statistical correlation is a two-way street and that possibly you are considering the idea of 'causality' rather than 'correlation'.
The CO2 feedback has more than a single source, the 'feedback' being the net result of a series of primary feedback, both positive and negative. Consider the rise in temperature out of an ice age which sees a net increase in CO2 - the ice melts adding 3% to ocean volumes which, now melted, will absorb CO2 to gain equilibrium with the existing ocean and atmosphere. The melt-water thus acts as a negative feedback, reducing the atmospheric CO2 levels.
For feedbacks to be strong enough to cause a 'runaway' temperature, they need to be at least as strong as the temperature rise/fall that they result from. If they are, for instance, just half as strong, the feedback temperature rise/fall would be 0.5+0.25+0.125+0.0625...=+1 x the temperature rise/fall that they result from, a long way from 'runaway'.
MARodger 613,
Yes I am talking about the causal relationship. There is far tighter correlation between temperature changes and subsequent CO2 changes than vice versa. And yet people continue to point to the correlation as proof that CO2 is THE driver of temperature.
No-one has managed to explain the fact that the correlation is primarily back to front in terms of causation.
[DB] Sloganeering snipped. Claims require evidence. Please start using actual citations to credible sources in lieu of unsupported assertions and making things up.
MARodger,
Thank you for the reference to the 2006 report in NASA's Earth Observatory, they do say 15F in 10 years. When I found their referenced source of the GISP2 temperature and accumulation data (file did not open on this computer, sorry for no link), the data is all sectioned off in 50-80 year sections so a 10 year claim is not supported. In addition, 15F would be about 8C and there is no change anywhere near that magnitude (in 50 years not 10) in the record. It seems to me that the NASA report has a typo in it.
To address Map's question, this is data for a single location on Greenland and not global data. The temperature change in Greenland was over 20C since the last ice age while Earth average was 4C according to the data in the OP. In addition. there is much more noise in data from a single location than from an average for the entire Earth. Conflating Greenland data for the Earth's average is simply incorrect.
You ask several questions in your last post. It is difficult to respond to several questions separated only by a question mark. Please ask one at a time. Start with the one that is most important to you.
In reply to commenter "Map" , from the other thread :-
Map, we must be careful to avoid semantic problems/confusions, so it is best if we all communicate in the standard scientific language (i.e. meaning of terms). You will mislead yourself if you use terms such as "minor ice ages" every 21000 years and "major ice ages" every 43000 years. For that is not what the well-established Milankovitch theory indicates. (See ice-albedo , CO2 feedback, etcetera.)
You haven't said exactly, but you seemed to be referring to Greenland ice cores (such as GISP2 from central Greenland). Their data comes from local conditions ~ not from global temperature changes.
There have been interestingly large/rapid swings in temperature shown in GISP2 data, but these are are mostly around the unusual event of the Younger Dryas . . . and do not reflect a basic global climate change (nor the inflow/outflow of heat energy which is the underlying cause of climate change).
For the sudden rise you mentioned, please permit me to quote climate expert Richard Alley :- "[temperature increase was] for Greenland, and applies moderately well around the North Atlantic, primarily as a wintertime change because there was a rapid shift from wintertime sea ice to wintertime open water in important regions. ... I can provide lots of chapters and verses on all of this, but the skinny version is that when the abrupt shifts happened, they primarily involved circulation rather than greenhouse gases, they didn't do a lot to global mean temperature, but they did do a lot to regional climates in many places, with large, rapid changes in North Atlantic temperatures, rapid shifts in monsoonal rains and in the edges of the tropical rain belts, smaller shifts in northern temperatures away from the North Atlantic, and lagged and opposite shifts in southern temperatures (so northern warming was followed by southern cooling)".
Map, I hope that provides you somewhat of a help. Please note that the big swings in the GISP2 proxy temperature data . . . are often displayed in the Deniosphere (of science-denying websites) ~ where it is implied that it's a world temperature chart. Worse, the GISP2 graph ends at 1855 (yes, eighteen fifty five ~ quite before the modern AGW temperature rise began) . . . and the chart scale is so compressed, that the casual reader is misled into believing past temperatures were much higher than modern times.
Denialist websites, such as WattsUpWithThat [WUWT] are well-known for these types of deceptions & falsehoods. Map, if that's where you've been getting some of your information/misinformation . . . then you have been handicapping yourself. WUWT contains all sorts of propaganda ~ and a lot of mutually contradictory crackpottery . . . and the comments sections there are half-filled with people who are still in complete denial of the basic physics of CO2 radiational properties. Really a snake-pit of intellectual insanity !
Map, you may want to look at my post on Abrupt Climate Change in Greenland, from which Eclectic pulled the quote from Richard Alley. (I thought I recognized that quote. :) )
Denialist websites will create noise in research when the internet is used, that's why I turned to a page that debunks excuses from 'nonbelievers'. I myself haven't made a decision as to my belief of it because I question why there is so much contradictory research when "90% of the science community agrees". Ok onto my next question, can u explain where I am misinterpreting milankovitch's theory? The data I have read on it mentions global orbit and axial tilt as having a significant bearing on ice ages ~ every 20k years with major events happening ~40 k years. If our last ice age was indeed around 20k years ago, then where is the earth currently positioned in milankovitch's theory? Have we just passed a 20k minor ice age or are will still supposed to be approaching it? If instead you choose to lean on the contradiction that iceages occur every 100k years, then was the last one truly 20k years ago? If it was then how were we in a slight cooling trend leading into the 1900s when the globe should be warming for the next 80000 years building into that next ice age?
[JH] Please document "The data I have read." If you do not and cannot, you will forfeit your right to comment on this site. Global statements with documentation is sloganeering which is prohibited by this site's Comment Policy.
Yes, David Kirtley, quite so. An excellent article.
Map , there is no denialist research. (If there were a chance of such denialists producing anything valid . . . then Exxon and others would pour vast sums into "anti-AGW" research But that doesn't happen, because the hard heads at Exxon know that the basic climate science is correct. Instead, they spend that money on propaganda to confuse & bamboozle people who haven't bothered to learn any of the science. (Sound familiar?)
Educate yourself, Map. Takes some time, but it's easily done ~ follow the links from the SkepticalScience Home Page, or select some of the Most Used Climate Myths. No-one wishes to spoonfeed you, if you have a dismissive attitude. Or simply accept the experts' advice ~ something which you normally do in almost every aspect of modern life. Be honest!
Seriously Map, would you dismiss the consensus opinion of a panel of leading surgeons & and medical researchers . . . because you didn't like their "tone" or because you read some flakey alternative view on a Homeopath website?
Map, it's hard to credit that you're not joking around. (Some call it being an agent provocateur ~ which sounds better than the T-word.)
Eclectic, sorry I confused you with "denialist research" when I misrepeated your phrase of "denialist websites". I came here to educate myself and once again you showed that you are incapable of answering the question part of my responses and only wish to divulge in your emotional responses. I was attempting to save time which I don't have on dredging through links of myths and having my particular questions answered but I apparently failed to find someone that can do more than emotionally regurgitate info. I will therefore choose to end this discussion and not care about global warming and just follow exxon's propaganda to bamboozle people beings you're unable to answer simple questions.
[JH] Argumentative sloganeering struck through.
I believe that I had read Map's initial comment correctly and that he is indeed referring to what some call the Mid-Pleistocene transition. This is an area of active research and, although his posts are poorly formulated, I do not see that map deserves scorn for enquiring about it.
The recent regime of 100,000 years interglacial was preceded in the paleo record by a longer period where the 41,000 years cycle dominated. Wikipedia has a good explanation and plenty of links to scientific literature, including some recent ones.
Citing the wiki page:
"There is strong evidence that the Milankovitch cycles affect the occurrence of glacial and interglacial periods within an ice age. The present ice age is the most studied and best understood, particularly the last 400,000 years, since this is the period covered by ice cores that record atmospheric composition and proxies for temperature and ice volume. Within this period, the match of glacial/interglacial frequencies to the Milanković orbital forcing periods is so close that orbital forcing is generally accepted (emphasis mine). The combined effects of the changing distance to the Sun, the precession of the Earth's axis, and the changing tilt of the Earth's axis redistribute the sunlight received by the Earth. Of particular importance are changes in the tilt of the Earth's axis, which affect the intensity of seasons. For example, the amount of solar influx in July at 65 degrees north latitude varies by as much as 22% (from 450 W/m² to 550 W/m²). It is widely believed that ice sheets advance when summers become too cool to melt all of the accumulated snowfall from the previous winter. Some believe that the strength of the orbital forcing is too small to trigger glaciations, but feedback mechanisms like CO2 may explain this mismatch."
Further down: "During the period 3.0–0.8 million years ago, the dominant pattern of glaciation corresponded to the 41,000-year period of changes in Earth's obliquity (tilt of the axis). The reasons for dominance of one frequency versus another are poorly understood and an active area of current research, but the answer probably relates to some form of resonance in the Earth's climate system. Recent work suggests that the 100K year cycle dominates due to increased southern-pole sea-ice increasing total solar reflectivity."
Worth noting:
https://agupubs.onlinelibrary.wiley.com/doi/full/10.1002/2016GL071307
There are plenty of other interesting references in the Wiki.
Map,
To have a productive exchange here, you can not be vague with statements like "I have read somewhere" and such. These are used all the times by people who argue in bad faith and trigger the corresponding response from other posters, for which you can not blame those who respond. Scientific references are a must. Specific inquiries and precise questions are helpful.
It should be noted that the regime in the paleo record has now been completely replaced and that we are in entirely new conditions because of the massive injection of CO2 in the atmosphere from the past 100 years.
[JH] For future reference, if Map posts comments containing undocumented assertions, please do not respond to them. They will be summarily deleted.]
Phillips chantreau you are correct, I just found another link on this site that states that somehow the 41000 year of milankovitch's theory changed around 800000 years ago and shifted the iceage timing to be around 100000 years now instead. I apologise for my vagueness in the "I read somewhere" but unfortunately that is due to the time that lapses between when I read articles and the number of articles I read in a night, I have good enough memory to quote exact phrases that I have read over the last year but unfortunately cannot swear to exactly which page I have received them from. However, the question that was avoided that kind of upset me was this.
If instead you choose to lean on the theory that iceages occur every 100k years, then was the last one truly 20k years ago? If it was then, how were we in a slight cooling trend leading into the 1900s when the globe should be warming for the next 80000 years building into that next ice age?
Phillips chantreau I should add, the comment in my question about a cooling trend was taken directly from a response from eclectic on a different article on this site about us temperature in 1934 before that conversation was forced to roll over into this article.
Map,
The graph I provided to you here clearly shows a 100,000 year cycle. Why do you have so many questions about something you have already been provided the data for? Do you ignore everyone elses posts or are you incapable of reading a simple graph?
When you claim to be really smart and then do not read the posts made to you it makes everyone else hostile to you.
[JH] For future reference, if Map posts comments containing undocumented assertions, please do not respond to them. They will be summarily deleted.]
Michael sweet this is why jumping multiple pages for a flowing conversation causes issues. I did respond to your graph and then in this comment section I had it pointed out when the timing for ice ages changed from 41000 years to 100000 years, which reinforces your post and made it more revalant to my discussion again but was on a different page. I do appreciate the answers you are giving me and am not trying to be rude.
Looking at your graph yet again, I also see that there does appear to be a very slight cooling trend over the last ~8000 years, and before that a fairly steady temperature rise over about a 4k year period. This is what lead me to ask why the cooling trend had occurred when that chart appears to be showing temperature rise to be expected, and why it is alarming for the temperature rise to resume when it would be expected for the trend to continue until the buildup of the next iceage ~80000 years from now?