


 Arguments


CO2 lags temperature - what does it mean?
What the science says...
| Select a level... |
 Basic
Basic
|
 Intermediate
|
 Advanced
| ||||
|
CO2 didn't initiate warming from past ice ages but it did amplify the warming. In fact, about 90% of the global warming followed the CO2 increase. |
|||||||
Climate Myth...
CO2 lags temperature
"An article in Science magazine illustrated that a rise in carbon dioxide did not precede a rise in temperatures, but actually lagged behind temperature rises by 200 to 1000 years. A rise in carbon dioxide levels could not have caused a rise in temperature if it followed the temperature." (Joe Barton, US House of Representatives (Texas) 1985-2019) - Full Statement
At a glance
Antarctic ice-core data today provide a continuous record on temperature and atmospheric composition that goes back for some 800,000 years. The data track the last few glacial periods and their abrupt endings, with rapid transitions into mild interglacials. But in some of the ice-cores, temperature rises first and is followed, a few hundred years later, by rising carbon dioxide (CO2) levels.
Certain purveyors of climate-myths seized on this observation, claiming it to be “proof” that carbon dioxide doesn't cause climate change. Wrong, wrong, wrong. But how? The answer lies in a beer-can.
In fact, you can do this one yourself. You need two cans of any fizzy beer. On a nice summer's day, take one out of the fridge and place it outside in direct sunshine for a few hours. Leave the other where it is. Then open the two at the same time. The warm one will froth like mad, half-emptying the can and making a mess. What is left in the can will be horrible and flat. Conversely, the one straight from the fridge will just give a “pfft” noise and will be pleasant to drink, being cool and fizzy.
What's that got to do with this myth? Well, you have just demonstrated an important point about the solubility of CO2 in water. CO2 gives fizzy drinks their fizz and it is far more soluble in colder water. As the water warms, it cannot hold onto as much CO2 and it starts to degas. Hence that flat lager.
Exactly the same principle applies to the oceans. When global warming is initiated, both land and the oceans start to warm up. On land, permafrost starts to thaw out, over vast areas. Carbon dioxide (and methane) are released, having been trapped in that permafrost deep-freeze for thousands of years. At sea, that “warm beer effect” kicks in. Thanks to both processes, atmospheric CO2 levels rise in earnest, amplifying and maintaining the warmth. That rise in CO2 thereby caused more of the gas to be released, warming things up yet more in a vicious cycle, known as a positive feedback. Other feedbacks kick in too: for example as the ice-sheets shrink, their ability to reflect Solar energy back out to space likewise decreases, so that heat is instead absorbed by Earth’s surface.
The trigger for the initial warming at the end of an ice-age is a favourable combination of cyclic patterns in Earth's orbit around the Sun, leading to a significant increase in the solar energy received by Earth's Northern Hemisphere. That's no secret. Glacial-interglacial transitions are caused by several factors working in combination – triggers and feedbacks. We've understood that for a long time.
And when you think about it, saying CO2 lagged temperature during glacial-interglacial transitions so cannot possibly be causing modern warming is a bit like saying, “chickens do not lay eggs, because they have been observed to hatch from them".
Please use this form to provide feedback about this new "At a glance" section. Read a more technical version below or dig deeper via the tabs above!
Further details
That CO2 can lag behind but amplify temperature during a glacial-interglacial transition was in fact predicted as long ago as 1990. In the paper The Ice-Core Record: Climate Sensitivity and Future Greenhouse Warming by Claude Lorius and colleagues published in the journal Nature in 1990, a key passage reads:
"The discovery of significant changes in climate forcing linked with the composition of the atmosphere has led to the idea that changes in the CO2 and CH4 content have played a significant part in the glacial-interglacial climate changes by amplifying, together with the growth and decay of the Northern Hemisphere ice sheets, the relatively weak orbital forcing and by constituting a link between the Northern and Southern Hemisphere climates."
This was published over a decade before ice core records were accurate enough to confirm a CO2 lag. We now know that CO2 did not initiate the warming from past ice ages but it did amplify the warming. In fact, about 90% of the global warming followed the CO2 increase.
Antarctic ice cores reveal an interesting story, now going back for around 800,000 years. During this period, changes in CO2 levels tend to follow changes in temperatures by about 600 to 1000 years, as illustrated in Figure 1 below. This has led some to disingenuously claim that CO2 simply cannot be responsible for the current global warming. Unsurprisingly, such a claim does not tell the whole story.
Figure 1: Vostok ice core records for carbon dioxide concentration and temperature change.
The initial change in temperature as an ice-age comes to an end is triggered by cyclic changes in Earth’s orbit around the sun, affecting the amount of seasonal sunlight reaching Earth’s surface in the Northern Hemisphere. The cycles are lengthy: all of them take tens of thousands of years to complete.As both land and oceans start to warm up, they both release large amounts of CO2 into the atmosphere, from melting permafrost and from warming ocean water, since CO2 solubility in water is greater in cold conditions. That release enhances the greenhouse effect, amplifying the warming trend and leading to yet more CO2 being degassed. In other words, increasing CO2 levels become both the cause and effect of further warming. Once started, it’s a vicious, self-reinforcing cycle - an excellent example of what science refers to as a positive climate feedback.
Indeed, such positive feedbacks are necessary to complete the shifts from glacial to interglacial conditions, since the effect of orbital changes alone are too weak to fully drive such variations. Additional positive feedbacks which play an important role in this process include other greenhouse gases like methane - you may have seen videos of that gas bubbling up through icy lakes in permafrost country and being ignited. Changes in ice sheet cover and vegetation patterns determine the amount of Solar energy getting absorbed by Earth’s surface or being reflected back out to space: decrease an ice-sheet’s area and warming will thereby increase.
The detailed mechanisms for the above general pattern have of course been investigated. In a 2012 study, published in the journal Nature (Shakun et al. 2012), Jeremy Shakun and colleagues looked at global temperature changes at the commencement of the last glacial-interglacial transition. This work added a lot of vital detail to our understanding of the CO2-temperature change relationship. They found that:
1) The Earth's orbital cycles triggered warming in the Arctic approximately 19,000 years ago, causing large amounts of ice to melt, flooding the oceans with fresh water.
2) This influx of fresh water then disrupted ocean current circulation, in turn causing a seesawing of heat between the hemispheres.
3) The Southern Hemisphere and its oceans warmed first, starting about 18,000 years ago. As the Southern Ocean warms, the solubility of CO2 in water falls. This causes the oceans to give up more CO2, releasing it into the atmosphere.
4) Finally, CO2 levels may lag temperature in some ice-core records from Antarctica, but in some other parts of the world the reverse was the case: temperature and CO2 either rose in pace or temperature lagged CO2. Figure 2 demonstrates this graphically and shows how things are never as simplistic as purveyors of misinformation would wish.
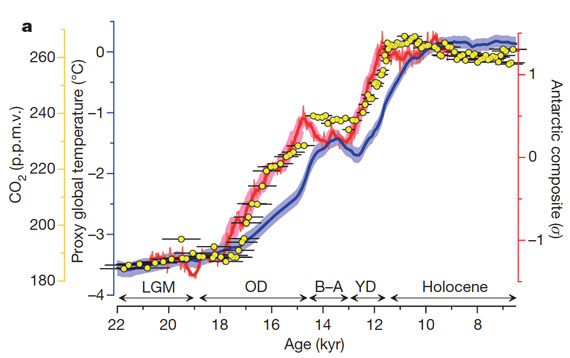
Figure 2: Average global temperature (blue), Antarctic temperature (red), and atmospheric CO2 concentration (yellow dots). Source.
Last updated on 14 February 2023 by John Mason. View Archives


I do not understand why no message arrived in my mail, I'm sorry for not responding before.
Daniel Bailey.
-It is a joy to see that the conclusions of your "BEST" team coincide with virtually all studies on Antarctic ice cores: "Data from ice core records strongly suggest that the prehistoric carbon dioxide changes were largely a response, ''not a cause'', of temperature changes ''. But, they say: '' However, [...] Seawater has high radiocarbon; Fossil fuels have none. "Forgive my ignorance but how do they know that the radiocarbon is not lost in the process? How do they know that CO2 does not come from other sources that also have low levels of radicarbon? Let me disagree with your best team, but I find their conclusions a bit forced. And they end: "it is clear that it is the CO2 that comes first, not the warming". Well, it is not what your own data show, but I could make some concession for the last century.
And I think I can rebut some of your 10 main statements:
1. The beginning of global warming coincides with the end of the small Ice Age, therefore natural;
2. The stages of higher industrial growth of mankind do not coincide with the increase in temperature.
3. That does not prove that CO2 produces global warming.
4. The same.
5. Again, that only says that the source of co2 has no volcanic origins, but it is not a proof that CO2 produces warming.
6. Same.
7. Same.
8. Same.
9. Same.
10. And Same.
Come on man, my original question was not difficult; Or is it that the basis of global anthropogenic warming is a coincidence?
Tom Curtis.
'' [...] Then it was driven by a feedback cycle of greenhouse gases (CO2 and methane) ''. Only? Where are the biggest greenhouse gases in the atmosphere? Like water vapor, for example. Secondly, these are correlations always based on recent times. But the only certainty is that ice cores are not subject to interpretations or complicated mathematical operations that can be manipulated. Anyway, allow me the freedom to doubt the credibility of those correlations you have shown.
John Hartz.
Again, how do you know that CO2 is responsible for the observed warming since the end of the small Ice Age? The only way CO2 can influence climate is through the greenhouse effect, but CO2 is only a minor gas between greenhouse gases and the amount of CO2 produced by man is an even smaller percentage. How do you know that the rest of the greenhouse gases have nothing to do with it?
Adri Norse Fire @526 :
I am sorry to hear that no message arrived at your mail. Is it possible that you have got your pen-names mixed up for this occasion?
On your point No. 1 (addressed to Daniel Bailey) :- Why do you think the present rapid global warming must be natural, simply because its beginning coincides (roughly) with the ending of the Little Ice Age ?
Your argument seems to be a logical non-sequitur.
Can you explain your thinking?
Eclectic I still do not know what the problem is, don't worry about that. (I think the web does not allow that option, but I'm not sure anyway)
Of course, given that the present interglacial period has had shorter phases of warm and cold periods occurring on a regular basis, it is very plausible that the centuries after the end of the small Ice Age the temperature would stabilize again. Does it seem very logical?
Adri... First of all, it seems as though you're working very hard to reject the established scientific understanding on these points, rather than working to try to actually understand them. Skepticism is a good thing when it's properly applied. That requires that you first learn the fundamental science.
Several folks have patiently explained the science and the article you posting on also explains it. But you've failed to acknowledge that you grasp what's being said and are, instead, compounding your misunderstanding with additional incorrect comments.
We see exactly this pattern over and over here at SkS. I'm very interested to get down to why this occurs.
Why do you think you're so dismissive of the science?
Adri Norse Fire @526, with respect to your response to Daniel Bailey, when introducing the list of 10 points to which you respond, he wrote:
It is quite clear, then, that he was discussing evidence that the CO2 increase over the 19th-21st century was anthropogenic in origin, not the distinct claim that the temperature rise was also anthropogenic in origin. As such, your repeated iterations of "That does not prove that CO2 produces global warming" or variants is simply non-responsive. You have conveniently shown his evidence to be "irrelevant" by treating it as addressing of something it was not adduced in support of.
What is worse, you ask, "How do they know that CO2 does not come from other sources that also have low levels of radicarbon?" But or course, Daniel Bailey has already answered that question with 10 lines of evidence. So, your misapplication of the 10 lines of evidence serves you two purposes - both to make them easy to refute as irrelevant to the question they did not address; but also to treat them as not having addressed that question so that you can still consider it open.
With regard to your response to me:
Of course not "only", but only those directly relevant to the discussion. You are directly denying that a CO2 and CH3 greenhouse effect can be a feedback on the glacial cycle. Evidence that the theory you are opposing without understanding incorporates such a feedback is, therefore, relevant, as is the evidence that such a feedback exists.
Actually, the correlations are not always based on recent times. If you want the correlations over 800,000 years of glacial cycle, see point 1 @520 above. You can ignore the correlations if you wish, but they are evidence, no matter how much you wish to not see it.
Finally, I will note that "recovery from the Little Ice Age" is a description of what the temperature does over a period ending about 1850. It is not an explanation of that warming. You do not explain things simply by redescribing them in different language. Now, if you ever come across a theory of what caused the general warming in the century prior to industiralization took of, you are welcome to try and show that it explains the warming in the 20th century as well. But absent that theory, your playing rhetorical games when you invoke a "recovery from the LIA". You are not practising, or expounding science.
@ Adri Norse Fire #526:
I accept the overwhelming and ever-growing body of scientific evidence about manmade climate change. Why do you deny it?
Well, I did not mean to sound pedantic. First of all I want to say that I am not a native speaker of English, I am using the translator to talk to you ... and that may cause some misunderstanding. Anyway, I apologize.
Rob Honeycutt
I am not working hard to deny anyone, what I say is what I have seen in documentaries and in magazines, that's all. I'm not an old scientist. But unlike you, Rob, I do not see that the establishment in which you believe has an indestructible foundation, this is not like the theory of gravity, there is a plenty of people who are also scientists who disagree with you In this subject or with the supposed orthodoxy to which you refer.
'' Why do you think you're dismissive of the science? ''
I do not despise science, I think that until now my arguments have not been ideological but scientific data that obviously are within the reach of all.
Tom Curtis
I want to remember that my first comment was a few months ago, having that in perspective; You're right when you say that my last answer does not exactly respond to his response, but I was thinking in the background of the whole conversation that was whether CO2 and therefore human industrial activity are causing the global rise in temperature.
''What is worse, you ask, "How do they know that CO2 does not come from other sources that also have low levels of radicarbon But or course, Daniel Bailey has already answered that question with 10 lines of evidence.'' He didn't and this answer was not addressed to him; That's why I said "sorry for my ignorance," because if you can not know how much low-radiocarbon CO2 comes from other natural sources due to lack of studies on the subject or for any reason, how can you faithfully calculate the amount Of CO2 emitted by human industrial activity? I mean, we can distinguish that something has different properties, but we do not seem to know how these properties work or whether they hold them through their natural cycles which is an imperative for the final calculation.
I did not say that CO2 or CH3 does not produce a greenhouse effect, but the feedback effect of CO2 and other minor gases is irrelevant to climate compared to other greenhouse gases.
If you like correlations so much why do not you look for some of the temperature and CO2 for the last 10,000 years? Does this correlation count as evidence?
http://www.lunarplanner.com/SolarCycles-images/Climate-Timeline-10000yrs.png
http://www.ferdinand-engelbeen.be/klimaat/klim_img/antarctic_cores_800kyr.jpg
And what about this chart?
http://kabarkampus.com/wp-content/uploads/2014/04/Dede-Prabowo-Wiguna_ilustrasi-1.jpg
http://s3.amazonaws.com/wboc-digital/production/sites/wboc-weather/wp-content/uploads/2016/04/28214154/Capture21.png
The question is whether we have the highest concentration of atmospheric CO2 in 800,000 years, without going further, why the current temperature is 1.5 ° lower than the medieval warm period?
''Finally, I will note that "recovery from the Little Ice Age" is a description of what the temperature does over a period ending about 1850. It is not an explanation of that warming.'' Indeed it is an assumption that the rise in temperature was related to the Little Ice Age. This also explains the warming of the 20th century. Someday I'll explain my crazy theory, but not right now. I apologize again.
John Hartz
Only me?
Adri Norse Fire @532.
You say you use "scientific data." The four graphs you present do not provide scientific data of temperature. Instead the one temperature graph you do present is schematic, and also flat wrong. It says it plots Northern Hemisphere temperatures yet shows less than 0.1ºC increase in NH temperature since 1850. HadCRUT4 (which is known to underestimate the warming due to poor Arctic coverage) puts the NH temperature increase since 1850 at 1.05ºC while GISTEMP (which provides a more realistic assessment of Arctic temperatures) puts the rise since 1880 as 1.25ºC. Note also that this graph you present does not support your assertion that "the current temperature is 1.5 ° lower than the medieval warm period."(And that stands whatever the º you intend.)
Adri... Well, unfortunately, man-made climate change is very much is like the theory of gravity in terms of how solid the science is.
The point I'm trying to make is this. You currently have a very poor understanding of the science. By your own admission, what you do believe is not based in actual scientific research, but is derived from documentaries and magazines.
What I'm trying to understand is, why?
Why would you believe non-scientific sources over actual published science?
Ardi, I would second RH comment. When you see conflicting information from various sources, what are your processes in determining what information you trust? What raises a red-flag when something comes from a science source?
Adri Norse Fire @532, first, let me say you are coping quite well with the language difference given that you are using a machine translator.
On the contrary, five of the ten lines of evidence falsify the theory that the increase in CO2 in modern times is a consequence of increased vulcansim; and a sixth renders it unlikely:
As fossil fuel and volcanic CO2 are the only C14 - free sources of carbon on the Earth, that precludes the origin being a C14 free source other than fossil fuels.
I am not sure what you meant by "this answer was not addressed to him" given that the sentence I quoted clearly came from the section of your comment headed "Daniel Bailey". I assume it is an inaccurate translation.
It is true that water vapour is a significant feedback on any warming. However, it contributes approximately 1C of warming for each 1 C contributed from another source. That means that for the glacial/interglacial cycle, including water vapour, albedo effects will have most likely contributed <30% directly, CO2 and CH4 <25%, with H2O most likely contributing <45%. Less than, because there are other short term feedbacks that are most likely to contribute about 0.5 C for each 1 C of direct warming, but may contribute 4 times that amount, but may have been a negative feedback.
Firstly, I will note that 6 - 25% contribution from CO2 and CH4 (once we account for the effect of water vapour) is not a negligible contribution.
Secondly, I will further note that H2O has a very short time to return to equilibrium in the atmosphere (weeks), so that its total atmospheric contribution is almost entirely governed by temperature. That means when we wish to determine the effect of an increase in CO2 concentration on the Earth's temperature, we can treat H2O as a feedback - and need not track it independently. That is particularly important for graphs such as this one:
It is well known that the direct temperature effect of a change in forcing is about 1 C to 1.2 C per 3.7 W/m^2 change, and hence about 0.8 to 0.9 C for the change in forcing from last glacial maximum to the holocene. The calculation of the implied sensitivity, therefore, is not an attempt to determine that direct effect, but to determine the result of the direct temperature effect plus all short term feedbacks, including H2O. That turns out to be about 2.8 C per 3.7 W/m^2.
Because I (and others) understand the purpose examining the causes of the difference in temperature between the last glacial maximum and the holocene, we do not bother mentioning the details about components of the short term feedbacks. I will grant that when talking with a popular audience, who are not aware of the reasons for focussing on CO2 and change in glacial ice extent, that is a mistake. We should clarrify the role of short term feedbacks, and why we are focussing on CO2 (as I have now done).
First, if you want to be taken seriously in a scientific discussion, don't source evidence from astrology sites, as you have done with that first chart. Granted the author of that site attributes the chart to a climate scientist (Schoenwiese) without specification as to year, or publication. Fortunately the chart has been examined as an example of the misuse of scientific charts by climate "skeptics" (Schneider et al 2014). The chart is from Schoenwiese 1995, and based on Daansgard (1984) (published online in 2013). Schneider et al (2014) comment:
Of course, in your version it is labelled Northern Hemisphere temperatures, not global temperatures. The point still stands, however. A Greenland ice core no more shows Northern Hemisphere temperatures by itself than does a thermometer in Moscow show temperatures in Tucson, Arizona. It can be used (as Daansgard used it) as an indication of North Atlantic temperatures, but beyond the North Atlantic, its accuracy as a temperature index will rapidly fall.
Schneider et al go on:
You should recognize that yourself. Taken at face value, the chart indicates that the Little Ice Age terminated 400 years ago. If we allow a more recent (circa 1850) termination then we must, according to that chart, acknowledge that for most of the LIA it was as warm as the peak of the Medieval Warm Period; and of course, that temperatures have since risen significantly above that peak.
Finally, here is a chart which has a fair claim to represent global holocene temperatures (but note caveats):
Note that 2004 is significantly warmer than any period prior to 1900, and that it has warmed appreciably since then.
All of this may be a side issue, but I am unsure as to what point you are trying to make with two charts of CO2 concentration over the last 800,000 years, or the chart of CO2 concentration over the Holocene.
It isn't. See chart above.
[PS] added obvious but important missing word.
Tom Curtis @536,
For completeness, the origin of the temperature graph linked by Adri Norse Fire@532 is (as you say) discussed by Schneider et al (2014) who trace the actual graphic back to Goreham, Steve. (2012) 'The Mad, Mad, Mad World of Climatism.' New Lenox Books. Note that an earlier origin of the actual graphic is the denialist web-paper Archibald, David. (2007) 'The Past and Future of Climate.'
And the Schoenwiese (1995) graphic on which it is based can be seen here.
MA Rodger @537, interesting. From the last link, the translated text after the figure says:
That is quited different from the text within the figure, and likely comes from a different source. The full spike up to 19 C is undoubtedly a projection, so that much is correct. It is unclear, however, what the temperatures represent. Nor is it clear that the full spike is projections. Taking the plateau before the spike as being the 1750-1900 average, then observed global temperatures were 0.6 C warmer than that at time of publication, and have since increased another 0.4 C. How much of that would show at the resolution of the chart I do not know. Ignoring resolution issues, it is warmer than the temperatures shown for the MWP and Roman Optimum. Further, the proxy used turns out to be the Camp Century ice core (from North West Greenland), and Greenland is almost unique across the globe in meing warmer than the 1961-1990 average:
Projecting a Greenland Ice Core temperature as a global, or even Northern Hemisphere average is completely unjustified.
It remains, however, that part at least of Schneider et al's critique that I quoted above is dubious at best. Trimming projections is certainly justifiable, and it is ambiguous how much of the spike is projection, and how much direct observation.
Tom Curtis @538,
The other point of note is how the graphic has slowly lost almost all the warming of recent decades as each denialist has manipulated the image.
In the 2006 Wehry version (this a different PDF version of the same thing) you display @538 (& we can but presume this is a faithful reproduction of the Schoenwiese (1995) graphic), the trace is four or five pixels broad which is about 100 years of horizontal axis and 0.025ºC vertically. But it does show an edge disappearing into the vertical post-2000 temperature rise which scales to 15.9ºC. By the time it appears in the 2007 Archibald paper, the edge has dropped to 15.75ºC. Then it features in the 2009 Denis Avery version by which tme it has dropped more to 15.6ºC and in the most recent version introduced @532, the 2014 NA Florenza version it has dropped again to 15.55ºC.
Strangely, that feature so loved by the Little Ice Age Revivaists maintains its top edge at 15.5ºC throughout this process of hidden decline.
MA Rodger
What I meant was that I am using scientific data in the sense that my arguments are exclusively in scientific terms, regardless of whether my claims are true or not.
Rob Honeycutt/scaddenp
Why do you say that I am not using scientific data? Do not scientific documentaries and scientific journals make scientific knowledge public? Is that knowledge invalid? So everything the public knows is a lie ... including global warming, right?
When I said that the current temperature was below about 1.5 ° I relied on a documentary where a gentleman, I think he was Norwegian who was in the Antarctic and claimed that the ice cores of his own research proved that the temperature was 1.5 ° higher to the present during the Medieval Warm Period. But also, it is known that historically the peoples of contemporaries of that time recorded that in Greenland agriculture was possible, among other things, etc. I think it is out of place to think that everything is part of a subtle conspiracy, of wich I am part, of course.
Tom Curtis
Thank you.
Okay, this is the kind of thing I said that misinterpretations were likely to occur. I have not said that the current increase in CO2 comes from volcanoes. And you're right, I thought it was a question I asked John Hartz, it's my fault. Sorry. Again you are right, I have no problem accepting that the recent increase in CO2 is due to human industrial activity, although there are other scientists who deny that conclusion with their own data, since from the beginning I said CO2 does not cause the current global warming by greenhouse effect or by feedback. I just do not see it likely. Sources I read some time ago claimed that water vapor is the main greenhouse gas and that it is responsible for two-thirds of the natural greenhouse effect. As you say very well it is a stable process, but the Earth makes all kinds of movements and we do not really know how much impact the orbital changes have on the greenhouse effect and Milankovich attributed the intervals of glacial periods and warm periods to the orbital changes. Which is no small thing in terms of climate.
Sorry for putting that graphic, I knew it was just a very nice graphic. I have taken note.
Well, as I said above the Antarctic data show also, that the temperature was higher than the current approximately 1.5 degrees during the Medieval Warm Period.
"All of this may be a side issue, but I am unsure as to what point you are trying to make with two charts of CO2 concentration over the last 800,000 years, or the chart of CO2 concentration over the Holocene." Why the current Temperature is 1.5 ° lower than the medieval warm period? " It is not. See chart above.'' Yes it was, why do you think it was called the Medieval Warm Period? Let's look at some recent research:
Working with a 2.5-foot-long core of peat in Penido Vello (Galicia, Spain) Martinez-Cortizas et al. (1999), a Mercury deposit record was extracted that extended until 4000 years ago. The work revealed that warm periods were characterized by a low accumulation of mercury. They also standardized the variables extracted and related them to the temperatures of the last 30 years. The work revealed that the medieval warm period in the northwest of Spain was 1.5 ° C warmer than the current one and that the average temperature of the warm Roman period was in no less than 2 ° C. Even a period of 80 years in the Middle Ages with average temperatures 3 ° higher than the current ones.
Desprat et al. (2003) studied the climatic variability of the last three millennia through the sediments of the Vigo estuary, clearly recognizing three warm periods and three cold periods, without seeming to be a relation between the variability and the increase of carbon dioxide. The authors concluded that the solar radiative balance and the ocean circulation seem to be the main mechanisms that force these cyclical variations in the Peninsula.
Pla and Catalan (2005) analyzing sediments of chrysophytes in more than 100 lakes of the Pyrenees reproduced a record of winter and spring temperatures during the Holocene. Warm and cold oscillations were recognized for these oscillations over the past few millennia. From the Medieval period it is deduced that the temperatures were then 0.25 ° higher than the current ones.
Here a chart: http://www.biocab.org/Holocene-Delta_T_and_Delta_CO2.jpg And as I liked the dissection you did to the other here is more: http://www.biocab.org/Boreholes_Reconstruction.jpg http://3.bp.blogspot.com/_H07QGNhZQzA/S_gGpyDlDQI/AAAAAAAAAHw/ADQvLwN-9U0/s1600/temperaturas+%C3%BAltimos+2000+a%C3%B1os.jpg http://www.biocab.org/Holocene_Delta_T_and_Delta_CO2_Full.jpg
''Of course, in your version it is labelled Northern Hemisphere temperatures, not global temperatures. The point still stands, however. A Greenland ice core no more shows Northern Hemisphere temperatures by itself than does a thermometer in Moscow show temperatures in Tucson, Arizona.'' The question then remains valid, but to avoid falling into the little trick of geography I will rephrase: Why the current temperature of Spain is lower (0,25º - 1,5º) than the Spain's Medieval Warm Period, if the current concentrations of atmospheric CO2 in Spain is higher without any doubt?
(Can we extend the geographical scope to the Mediterranean and even Europe? I do not know; http://science.sciencemag.org/content/291/5508/1497 , http://science.sciencemag.org/content/342/6158/617)
--And someone asked me why I'm so skeptical or something--
Well, it is not very difficult to be a skeptic of anything since we have been able to see everything from the millionaire Red Cross scam in Haiti after the earthquake to hear the Greenpeace co-founder say that this organization has become a corrupt gang and then you see scandals with emails and what some IPCC scientists say, and so on. When I saw the Al Gore's documentary I believed it and when I saw the documentary of The Great Scam of Climate Change, I also believed it. So we must be very careful not to be deceived by the official tone, as some have pointed out: http://joannenova.com.au/2010/10/is-the-western-climate-establishment-corrupt-part-4-past-temperatures/
MA Rodger
It's funny that you mention sidelong to the ''Little Ice Age revivalists'' because according to NASA members, this very century we can face a solar minimum such as the Maunder Minimum or the Dalton Minimum and presumably a new Little Ice Age. Here's a link: http://www.forbes.com/sites/peterferrara/2013/05/26/to-the-horror-of-global-warming-alarmists-global-cooling-is-here/#5c8c582669bb
[JH] Sloganeering snipped.
Tom Curtis
I'm a bit confused with the image you've shown me, the image is composed of a large map and a small one so what are the real data?
As far as I have been able to investigate the large image plots ice core data, covering the past 11,700 years, where does the small figure come from?
Because the main one points to periods of the Holocene with higher temperature than now. So?
Adri... From the warning snip portion of your comment at 540 I think we can gather that "dismissiveness" (as I framed it) is based in distrust of government. You can correct me if I'm wrong.
I can promise you, you're interpretting the science very wrong. Everyone here at Skeptical Science has been through this a 100 times before. What we find is, as we explain the science, people like you are generally driven further into denial. And as you get more and more frustrated with not getting the answers you prefer, you end up getting angry and frustrated, and we ultimately have to delete your access to comment.
We can start going through the science if you like, but if you want to avoid this predictable outcome, you would have to bring an open mind to the conversation.
I know it's probably very hard for you to see the difference, but many of the sources you're using are not about the science. Biocab.com, Jonova.com... These are websites that do not present the actual scientific research. They're designed to confuse. And they do a very good job of that.
Adri Norse Fire @541,
The graphics you present do not support your assertions of a toastie warm MWP. In truth, they are a bit of a joke.
The first graphic Change of T & Change of CO2 Holocene Epoch is not supported by the document it says it sources for temperature data - Broecker (2001). While this paper itself is old and in many respects speculative, it does set its position out that "Holocene temperature fluctuations ... were probably less than 1°C." So for this graphic you present to show fluctuations of 8°C puts it quickly in the bin.
The second graphic plots a tiny part of one of two a Greenland borehole temperature reconstruction from Dahl-Jensen (1998) but the graphic for some reason cites a secondary source (Bond et al 2001). The other trace on this graphic is called Yang-Delta T but what this is plotting is not entirely clear. I would assume it is the 'weighted' China trace from figure 3 in Yang et al (2002) but there appears to have been some fiddling with this data in the most recent period plotted.
The third graphic is simply figure 2 from Loehle & McCulloch (2008) which presents a global temperature reconstruction to 1935. Note the peak of the MWP sits just 0.5°C above the 1935 level. Thinks - I wonder what has happened to global temperatures since 1935?
The final graphic is another stab at Holocene temperature & CO2 levels with various temperature reconstructions presented (including the borehole data used in the first graphic above) citing Bond et al (2001) again. It certainly is plotting out the bottom two traces from fig 5A in the paper but using the wrong x-axis. Of the other two traces presented, one does seem to be using the x-axis properly but where it is sourced is not at all evident. And as a parting shot at this rubbish, note that the CO2 trace in this graphic is saying CO2 topped 300ppm in about 1780AD, assuming the grapher managed to plot it against the x-axis correctly. If the x-axis is wrong, the y-axis is also up the spout as well.
Adri Norse Fire @541, the graph (not map) that I showed as the third image @536 is the simple mean of:
The following data sources were used in constructing the main plot:
It shows the individual proxies in the background.
The inset shows the following temperature reconstructions over the last 2000 years:
Over the last 2000 years, the reconstructions are to be preferred, as each uses more than 8 proxies, but there is little difference between the mean of those reconstructions and the mean of the 8 proxies over that period.
Further details about the graph are here.
Almost any modern multi-proxy temperature reconstruction is preferable to taking the value of a single site, or just a few. The one exception is Loehle and McCulloch (which you use). That is because they use a heavilly biased sample of proxies but then take a simple mean of those proxies. As I explain elsewhere, this is equivalent to assuming that "...that 66.7% of the Earths Surface is in the NH extratropics, 22.2% in the tropics, and just 11.1% in the SH extratropics". Probably the best, and certainly the one using the most proxies, is that from the PAGES2000 consortium, shown here compared to four recent reconstructions (top of panel):
I find it worrying that you would uncritically accept a comment from a TV documentary and assume that it invalidates the science. Misinformation organisations make documentaries to confuse eg "Great global warming swindle", and "climate hustle" which misrepresent science for the gulliable. As has been shown above by Tom and MA Rogers, the sources you have been trusting are not reliable and in fact are doctoring the truth. And you and many others have fallen for it. It is extremely hard to have a discussion when misinformation is uncritically accepted and hard-core, peer-reviewed, widely accepted science papers are treated as unreliable. As Rob says, it implies a strong bias against science. You must have searched some very dubious sources to find these and yet trust them rather than the IPCC expert review of published science.
When shown that your evidence is invalid, do you change your mind or go frantically searching for confirmation of your bias from yet more dubious sources?
Is there actually any point in us discussing data with you? In your own mind, what data would cause you to change your position?
Also, just make sure that you do understand the extent of agriculture in Greenland.
Adri Norse Fire @540
You mention a New little ice age, coming in the next few years and decades. That is the assertion by Mr Peter Ferrara in Forbes Magazine in 2013 (the link supplied by you).
Since 2013, the world has had its three hottest years in recorded history ( 2014 / 2015 / 2016 ). And there is absolutely no sign that Mr Ferrara's assertion could become true. His assertion is total Unsinn (as the Germans say). Total nonsense.
Adri, you should not be surprised to find Unsinn coming from Mr Ferrara. He is a lawyer and a professional propagandist and an Amerikaner . . . a truly toxic combination!! Mr Ferrara is paid to give you Dreck instead of Wahrheit / Sanningen / Truth. And it is the same with JoanneNova.
Adri, please attempt to be scientific with your thinking. When you wish to assess the health of a forest, then you should look at the health of all the trees - not simply look at the healthiest 4 trees which you can find to please you.
Rob Honeycutt
You're right. I simply answered a question that alluded to my convictions or motivations, but I understand the censorship, I do not set the rules, much less want to change them. And I can assure you that I am not confused, annoyed or angry with any of you who are answering me and I think the conversation so far has been very correct. We are going through the path of science, you believe that what I say is not science because they are sources with which you are not familiar, I will not deny that some of the data I have mentioned come from sources that are openly against anthropogenic climate change and may be biased, but you can not deny that you are using an ad hominem fallacy as the truth of their arguments does not imply a direct relationship with their personal convictions.
It's like saying, the sky is not blue because Stalin said it was blue. In the end we refer to scientific research, as I put above.
MA Rodger
I do not know if it's a good way to discredit me by supposing that those graphics are maliciously manipulated, that they are biased or that they are directly garbage.
<I wonder what has happened to global temperatures since 1935?> Me too.
Tom Curtis
<Probably the best, and certainly the one using the most proxies, is that from the PAGES2000 consortium,>
As you say about the reconstruction of Loehle and McCulloch, the reconstruction of PAGES2000 consortium is also a biased reconstruction since it has many more proxies in some areas than others as we can see. It is true that for the average global temperatures it is necessary to perform tests on different continents, but it is not necessary when we are talking about a particular region. So I wonder where the investigations of the four reproductions above were made, (whether global or regional) because they are closer to me than to you. And according to the graph of PAGES2000 consortium, you must recognize that in the last 2,000 years there have been periods, at least as warm as the current one.
scaddenp
<I find it worrying that you would uncritically accept a comment from a TV documentary and assume that it invalidates the science.>
Is it not science? When Jane Goodall is talking in a documentary about the behavior of chimpanzees is not science?
The IPCC review? Is it not true that there are a large number of non-scientific personnel among the IPCC? And then, why only the IPCC?
<Is there actually any point in us discussing data with you? In your own mind, what data would you change?> Of course, you can convince me if what you say can be scientifically tested directly and not based on an assumption. Because if we agree that the truth of this subject depends on assumptions because it can not be scientifically demonstrated directly, then as long as we both have different assumptions we have become believers of our own conclusions. So when you can raise the temperature of a huge biosphere box by adding CO2, I'll believe you.
<Also, just make sure that you do understand the extent of agriculture in Greenland.> I find the link very interesting, but I think you have not noticed some comments below.
Eclectic
<Since 2013, the world has had its three hottest years in recorded history ( 2014 / 2015 / 2016 ).>
Really? Can you tell me the degree of difference between those years? Can you give me more information about these investigations? I would appreciate it. I have never been a detractor of global warming, but I did not know that it was so marked, especially by the cold waves that have lashed Europe lately.
But going back to the subject, I do not really know what an 'Amerikaner means', but these statements do not come from Mr. Ferrara, (by the way you were making the ad hominem fallacy an art) come from NASA scientists and others. And especially of Russian scientists of whom I can not remember the name now. The theory is essentially that solar observations are increasingly recording fewer sunspots and it is thought that solar cycle 25 or 26 will practically have no stains, a event that has precedents +200 years ago where especially the Maunder Minimum coincided with the colder phase of the Little Ice Age. They believe that something like a new short cold period can happen between 2030 and 2050 and it seems to me, that nobody should be underestimated, even though they have worked as lawyers and 'propagandists'.
1.- Link, NASA: http://www.thedailysheeple.com/nasa-admits-solar-cycle-is-the-weakest-in-200-years-the-link-between-sunspots-global-cooling-and-agenda-21_112013
2.- Link, (independent?): https://www.vencoreweather.com/blog/2016/6/23/1015-am-the-sun-goes-blank-again-during-the-weakest-solar-cycle-in-more-than-a-century
And Tom Curtis, thanks for the info. I almost forget it.
Adri Norse Fire @548, when you have different numbers of proxies in different areas, you can either take a simple mean (as did Loehle and McCulloch), or you can divide the globe into different areas, determine the temperature for each individual area from the proxies within it, and then determine the global temperature by taking an area weighted mean of the reconstructed temperatues for each area. There are a variety of other techniques which approximate to the effects of one or the other. If you do the first of these, you get a biased temperature record. If you do the second, you get an unbiased temperature record, but with some regional temperatures being more reliable than the other. What was done by the PAGES 2000 project approximated to the second method.
Adri Norse Fire @549, your discussion is becoming increasingly wide ranging, and off topic. I am sure the moderators would appreciate your taking the various points to their most appropriate threads. In particular, where you say,
You should read, and take further discussion to this article.
Discussion of the MWP should be taken to one of numerous threads devoted to it, or that on Pages 2k. That includes discussion of farming in Greenland, although this thread would be more apt. Discussion of Holocene temperatures should probably be taken to a thread on Marcott et al.