Climate Science Glossary

Term Lookup

Enter a term in the search box to find its definition.

Settings

Use the controls in the far right panel to increase or decrease the number of terms automatically displayed (or to completely turn that feature off).

Term Lookup

Settings


All IPCC definitions taken from Climate Change 2007: The Physical Science Basis. Working Group I Contribution to the Fourth Assessment Report of the Intergovernmental Panel on Climate Change, Annex I, Glossary, pp. 941-954. Cambridge University Press.

Home Arguments Software Resources Comments The Consensus Project Translations About Support

Bluesky Facebook LinkedIn Mastodon MeWe

Twitter YouTube RSS Posts RSS Comments Email Subscribe


Climate's changed before
It's the sun
It's not bad
There is no consensus
It's cooling
Models are unreliable
Temp record is unreliable
Animals and plants can adapt
It hasn't warmed since 1998
Antarctica is gaining ice
View All Arguments...


Username
Password
New? Register here
Forgot your password?

Latest Posts

Archives

Sun & climate: moving in opposite directions

What the science says...

Select a level... Basic Intermediate Advanced

The sun's energy has decreased since the 1980s but the Earth keeps warming faster than before.

Climate Myth...

It's the sun

"Over the past few hundred years, there has been a steady increase in the numbers of sunspots, at the time when the Earth has been getting warmer. The data suggests solar activity is influencing the global climate causing the world to get warmer." (BBC)

At a glance

Thankfully for us, our Sun is a very average kind of star. That means it behaves stably over billions of years, steadily consuming its hydrogen fuel in the nuclear reaction that produces sunshine.

Solar stability, along with the Greenhouse Effect, combine to give our planet a habitable range of surface temperatures. In contrast, less stable stars can vary a lot in their radiation output. That lack of stability can prevent life, as we know it, from evolving on any planets that might orbit such stars.

That the Sun is a stable type of star is clearly demonstrated by the amount of Solar energy reaching Earth's average orbital position: it varies very little at all. This quantity, called the Total Solar Irradiance, has been measured for around forty years with high accuracy by sensitive instruments aboard satellites. Its average value is 1,362 watts per square metre. Irradiance fluctuates by about a watt either way, depending on where we are within the 11-year long sunspot cycle. That's a variation of no more than 0.15%.

From the early 1970s until today, the Solar radiation reaching the top of Earth's atmosphere has in fact shown a very slight decline. Through that same period, global temperatures have continued to increase. The two data records, incoming Solar energy and global temperature, have diverged. That means they have gone in opposite directions. If incoming Solar energy has decreased while the Earth continues to warm up, the Sun cannot be the control-knob of that warming.

Attempts to blame the sun for the rise in global temperatures have had to involve taking the data but selecting only the time periods that support such an argument. The remaining parts of the information - showing that divergence - have had to be ditched. Proper science study requires that all the available data be considered, not just a part of it. This particular sin is known as “cherry-picking”.

Please use this form to provide feedback about this new "At a glance" section, which was updated on May 27, 2023 to improve its readability. Read a more technical version below or dig deeper via the tabs above!


Further details

Our Sun is an average-sized main sequence star that is steadily using its hydrogen fuel, situated some 150 million kilometres away from Earth. That distance was first determined (with a small error) by a time consuming and complex set of measurements in the late 1700s. It led to the first systemic considerations of Earth's climate by Joseph Fourier in the 1820s. Fourier's number-crunching led him to realise a planet of Earth's size situated that far from the Sun ought to be significantly colder than it was. He was thereby laying the foundation stone for the line of enquiry that led after a few decades to the discovery of what we now call the Greenhouse Effect – and the way that effect changes in intensity as a response to rising or falling levels of the various greenhouse gases.

TSI Solar cycles

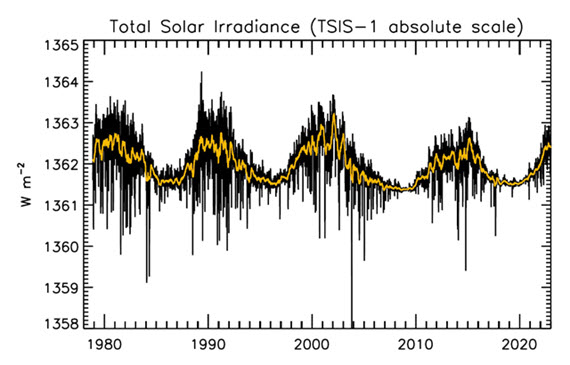
Figure 1: Plot of the observational record (1979-2022) on the scale of the TSIS-1 instrument currently flying on the space station. In this plot, the different records are all cross calibrated to the TSIS-1 absolute scale (e.g., the TSIS1-absolute scale is 0.858 W/m^2 higher than the SORCE absolute scale) so the variability of TSI in this plot is considered to be its “true variability” (within cross calibration uncertainties). Image: Judith Lean.

The Sun has a strong magnetic field, but one that is constantly on the move, to the extent that around every 11 years or so, Solar polarity flips: north becomes south, until another 11 years has passed when it flips back again. These Solar Cycles affect what happens at the surface of the Sun, such as the sunspots caused by those magnetic fields. Each cycle starts at Solar Minimum with very few or no sunspots, then rises mid-cycle towards Solar Maximum, where sunspots are numerous, before falling back towards the end. The total radiation emitted by the Sun – total solar irradiance (TSI) is the technical term – essentially defined as the solar flux at the Earth's orbital radius, fluctuates through this 11-year cycle by up to 0.15% between maximum and minimum.

Such short term and small fluctuations in TSI do not have a strong long term influence on Earth's climate: they are not large enough and as it's a cycle, they essentially cancel one another out. Over the longer term, more sustained changes in TSI over centuries are more important. This is why such information is included, along with other natural and human-driven influences, when running climate models, to ask them, “what if?"

An examination of the past 1150 years found temperatures to have closely matched solar activity for much of that time (Usoskin et al. 2005). But also for much of that time, greenhouse gas concentrations hardly varied at all. This led the study to conclude, "...so that at least this most recent warming episode must have another source."

TSI vs. T
Figure 2: Annual global temperature change (thin light red) with 11 year moving average of temperature (thick dark red). Temperature from NASA GISS. Annual Total Solar Irradiance (thin light blue) with 11 year moving average of TSI (thick dark blue). TSI from 1880 to 1978 from Krivova et al. 2007. TSI from 1979 to 2015 from the World Radiation Center (see their PMOD index page for data updates). Plots of the most recent solar irradiance can be found at the Laboratory for Atmospheric and Space Physics LISIRD site.

The slight decline in Solar activity after 1975 was picked up through a number of independent measurements, so is definitely real. Over the last 45 years of global warming, Solar activity and global temperature have therefore been steadily diverging. In fact, an analysis of solar trends concluded that the sun has actually contributed a slight cooling influence into the mix that has driven global temperature through recent decades (Lockwood, 2008), but the massive increase in carbon-based greenhouse gases is the main forcing agent at present.

Other studies tend to agree. Foster & Rahmstorf (2011) used multiple linear regression to quantify and remove the effects of the El Niño Southern Oscillation (ENSO) and solar and volcanic activity from the surface and lower troposphere temperature data.  They found that from 1979 to 2010, solar activity had a very slight cooling effect of between -0.014 and -0.023°C per decade, depending on the data set. A more recent graphic, from the IPCC AR6, shows these trends to have continued.

AR6 WGI SPM Figure 1 Panel p

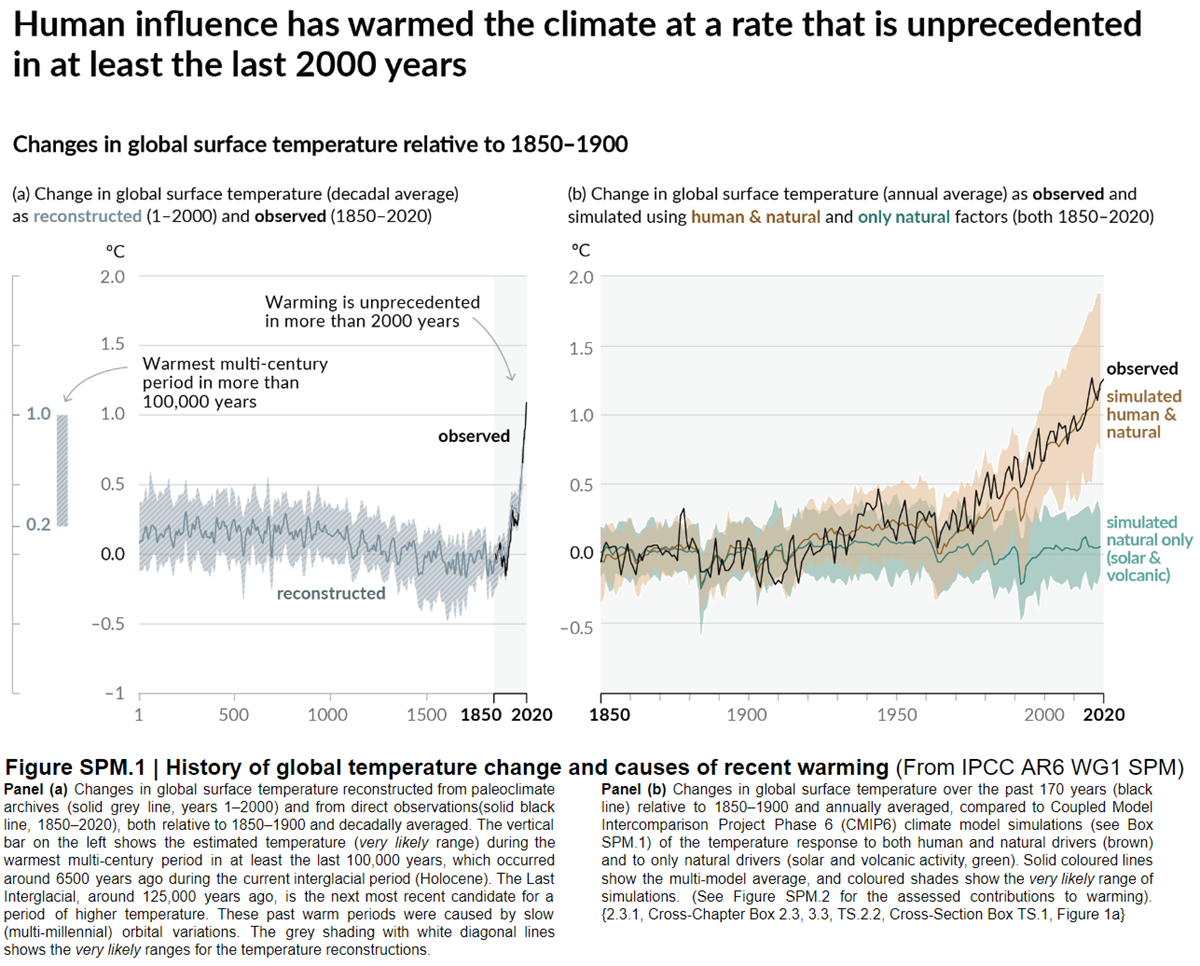
Figure 3: Figure SPM.1 (IPCC AR6 WGI SPM) - History of global temperature change and causes of recent warming panel (b). Changes in global surface temperature over the past 170 years (black line) relative to 1850–1900 and annually averaged, compared to Coupled Model Intercomparison Project Phase 6 (CMIP6) climate model simulations (see Box SPM.1) of the temperature response to both human and natural drivers (brown) and to only natural drivers (solar and volcanic activity, green). For the full image and caption please click here or on the image.

Like Foster & Rahmstorf, Lean & Rind (2008) performed a multiple linear regression on the temperature data, and found that while solar activity can account for about 11% of the global warming from 1889 to 2006, it can only account for 1.6% of the warming from 1955 to 2005, and had a slight cooling effect (-0.004°C per decade) from 1979 to 2005.

Finally, physics does not support the claim that changes in TSI drive current climate change. If that claim had any credence, we would not expect to see the current situation, in which Earth's lower atmosphere is warming strongly whereas the upper atmosphere is cooling. That is exactly the pattern predicted by physics, in our situation where we have overloaded Earth's atmosphere with greenhouse gases. If warming was solely down to the Sun, we would expect the opposite pattern. In fact, the only way to propagate this myth nowadays involves cherry-picking everything prior to 1975 and completely disregarding all the more recent data. That's simply not science.

Longer-term variations in TSI received by Earth

It's also important to mention variations in TSI driven not by Solar energy output but by variations in Earth's orbit, that are of course independent of Solar activity. Such variations, however, take place over very long periods, described by the Milankovitch orbital cycles operating over tens of thousands of years. Those cycles determine the distance between Earth and the Sun at perihelion and aphelion and in addition the tilt the planet's axis of rotation: both affect how much heat-radiation the planet receives at the top of its atmosphere through time. But such fluctuations are nothing like the rapid changes we see in the weather, such as the difference between a sunny day and a cloudy one. The long time-factor ensures that.

Another even more obscure approach used to claim, "it's the sun" was (and probably still is in some quarters) to talk about, "indirect effects". To wit, when studies can't find a sufficiently large direct effect, bring even lesser factors to the fore, such as cosmic rays. Fail.

In conclusion, the recent, post 1975 steep rise in global temperatures are not reflected in TSI changes that have in fact exerted a slight cooling influence. Milankovitch cycles that operate over vastly bigger time-scales simply don't work quickly enough to change climate drastically over a few decades. Instead, the enormous rise in greenhouse gas concentrations over the same period is the primary forcing-agent. The physics predicted what is now being observed.

Last updated on 27 May 2023 by John Mason. View Archives

Printable Version  |  Offline PDF Version  |  Link to this page

Argument Feedback

Please use this form to let us know about suggested updates to this rebuttal.

Related Arguments

Further viewing

Related video from Peter Sinclair's "Climate Denial Crock of the Week" series:

Further viewing

This video created by Andy Redwood in May 2020 is an interesting and creative interpretation of this rebuttal:

Myth Deconstruction

Related resource: Myth Deconstruction as animated GIF

MD Sun

Please check the related blog post for background information about this graphics resource.

Denial101x videos

Related lecture-videos from Denial101x - Making Sense of Climate Science Denial

and

Additional video from the MOOC

Expert interview with Mike Lockwood

Comments

Prev  28  29  30  31  32  33  34  35  36  37  38  39  40  41  42  43  44  45  46  47  Next

Comments 926 to 950 out of 1302:

  1. KR: Or one could use actual physics, which gives the earth's magnetic field's westward drift at 0.2 deg/yr. Mr. Gaddes' "migrating longitudinally around the planet,(30 degrees/month with the westward drift of the Earth's Magnetic Field,)" would be quite noticeable - and could hardly be called 'drift'.
  2. Muoncounter - Agreed. A 30°/month shift of the Earth magnetic field would not be a "drift", but more of a "spin". And as someone who quite frequently uses magnetic compasses in navigation, I'll point out that this would be more than noticeable. It would render compasses useless...
  3. "I now present the work for 'peer review.' " Good luck on that - however a question. The problem with this kind of forecasting, is that it doesnt forecast. If the fitted cycles have no physical meaning, then the real world will drift away from forecast in accordance with real physics. So when this happens, will you be writing an apologize to climate change victims for helping to mislead - or just redoing the fitting and publishing another prediction? Ie is there some point when you would realise the folly and stop fitting? Of course, should you be right, I would stand behind a nobel prize nomination.
  4. Don Gaddes, I will confess that I have not read all of your father's work, but I perused all of it and read much of it in what little time I had to spare. Forgive me if this is offensive, but I believe you are doing your father a great, great disservice both in the way that you present his material and what you yourself have taken from it. Your father wrote, at the very beginning of his book:
    In this work the author has not attempted to persuade, merely to explain how he went about his study, and what those studies revealed. It will be for the reader to make his or her own judgment as to the correctness of the findings. Greenhouse or ice age, the answer may well be with us before we realise that our planet is a fragile, living form, constantly changing, and demanding respect, study and understanding, if we want our species to survive.
    He was humble enough to recognize his own limitations, but more importantly, he demonstrated a tremendous investment in getting people to recognize the importance of climate and climate change. He did explicitly (in his book) understand and accept the realities behind CO2 and greenhouse gas theory. His only disadvantage was that events had not begun to truly play out when his book was written and before he passed away. In fact, he said:
    Weighing the pros and cons of dust and other cooling factors, against the “Greenhouse Effect,” I believe, at this stage, that the former is holding sway.
    And that may well have been the case, to the casual observer, in 1990, and was indeed a factor in holding temperatures down until 1979. We know that since then this has become much clearer, and aerosols no longer dominate greenhouse gases in changing the climate. He goes on to say:
    I wholeheartedly agree with Professor R. Bryson, that if we are indeed facing an imminent climate/weather change (and the weight of evidence seems to indicate very strongly that such is highly likely,) then we ought to be earnestly and diligently marshalling our options now.
    Of course, your father's concern was with an imminent glacial period, not warming, but the sentiment rings true, regardless. And I am sure that, faced with the weight of evidence against his theory and for the impact of greenhouse gases, he would at least admit that whatever influence his natural cycles had had until this point in time, mankind's burning of fossil fuels was overwhelming those forces and making his theories inconsequential in the scheme of things. From his book:
    Arthur Koestler (The Ghost in the Machine) put it down to “.....the streak of insanity running throughout mankind.” Omah said: “.....only a fool benefits from his own mistakes, the wise man benefits from the mistakes of others.” Bryson said: “.....mankind should benefit from the lessons of the past.” I, and I daresay by far the majority of thinking people, would agree wholeheartedly with the above conclusions. Why, then, do we not embrace Socrates’ philosophy of equating thinking with doing? Man’s tardiness in this regard is reminiscent of an ordinary land-slide (which has no brain at all!) They are both firmly enshackled to the principle of the line of least resistance (Newton’ First Law) and only Nature’s law of conservation is powerful enough (in man’s case) to exert enough’ force’ to cause us to ‘pull up our socks.’ So the nature of man must also be considered by the future writers of an equation for survival.

    I will post a separate comment with what I consider to be the failings in his efforts, but I don't want to diminish them. He was an intelligent and yet uneducated (formally) man who took wholeheartedly to his hobby, pursued it with intelligence and diligence, and whether correct in his conclusions or not he demonstrated both a humility and an investment in the importance of the subject which now deserves respect, not derision. But I would ask you to read his book a little more closely, and to read between the lines, imagining what he might say today, faced with the mounting evidence, rather than what you perceive that he had said back then. He is at a disadvantage in having you as his only advocate. I believe you owe it to him to consider all of his words, and what he himself seemed more than ready to accept, which is the idea that he might be wrong, that it is frighteningly important to be right about this, and that doing so -- being right -- means being willing to always keep an open mind, and to always adjust your reasoning to the facts as they become available.
  5. Don Gaddes, On the veracity of your father's work, I have a few points to make. First, despite the great length of the book, the vast majority (more than 99%) is mere discussion. He talks of the repercussions of droughts and climate change. He quotes extensively from the passages of other works, all of which predate 1978, which means they lack a lot of modern tools, theories and observations that simply were not available then. But, in his body of work, he does little more than do as he said he would in his introduction, which is to explain how he arrived at his cycles, without going the important next step and proving how those intricate, interwoven cycles in fact tie to any climatic events, either past or present. [I would suggest at this point that if you want to promote this work you must take that next step, to compute and graph his cycles and show them in parallel with the temperature record, past, present and future. Make a prediction, so that the work can be evaluated on its actual merit rather than its presumed value.] The first problem I see in his work is that he tied his cycles, as far as I can tell, only to records of rainfall in Australia and nothing else (and of course, he lived in Australia). His cycles are not tied to global records (rainfall, drought, or temperatures) of any sort. They are also not tied to global temperatures, but only to rainfall records. His entire theory hinges on tying drought -- Australian drought -- to his cycles, but not temperature changes, and certainly not global temperature changes. He never, ever introduces temperature records at any point. As such, his work very simply does not apply. The connection of cycles to drought to temperature is quite simply too vague to be given any weight whatsoever, especially when no such connection has even been presented by him. There is no evidence -- no effort yet -- to show that his cycles translate into a prediction that mirrors either past or future temperatures. There is no reason whatsoever (lack of physical mechanisms aside) to apply any of his work to the climate changes that we clearly see today. Beyond this, there were also clear gaps in his knowledge. I imagine that he would have been a whirlwind today, with access to the Internet to help him close those gaps. But he did not understand the Hadley cells and their effects on the arid regions of the globe and transport of moisture. This is clearly evidenced in his Appendix 4. That section also begins with this backwards understanding of the relationship between temperature and moisture
    Raising of climatic temperature to a mean, specific, critical point, somehow dissociates moisture from lower atmosphere. The more moisture used up, the drier and hotter the climate, the more dry air -­‐cooled air delivered at the Poles.
    He was, I suspect, confused by the fact that hot deserts are dry, and so presuming that one was the cause of the other, when in fact the two are intertwined and, in fact, the daytime heat of the desert is a result of the lack of humidity rather than its cause. He also suffered from the limitations of the science of the day, such as this tidbit (which we know to be not entirely correct, as evidenced by the mounting build up of CO2 in both the oceans and the atmosphere):
    According to Rankama and Sahama (Ref. No. 14) the oceans act as a sink for any build-up in carbon dioxide above a partial pressure (PP) in the atmosphere; that once the critical PP in the atmosphere is reached, the excess carbon dioxide is taken into solution by the oceans.
    He also includes a fair of discussion of volcanoes in his theory. Modern climate science has this pretty well nailed down, to a much greater extent than your father achieved and now at a level from which he might have benefited. But his volcanic theories go out the window as "the" driver of climate. We know this to be a fact, and there is no way to argue it, even if he had included any hard numbers to substantiate his position, which he failed to do. I'll close with this quote from your father's book:
    Should it so happen that the carbon dioxide content of the atmosphere were to become greater or lesser, then it would follow that the ”Greenhouse Effect” must vary in direct proportion. The former is just what has been found to have taken place. Man is the culprit, for during the past 50 years, due to our ever increasing use of fossil fuel. The mean carbon dioxide content in our atmosphere has increased by about 13.5 percent, which some scientists believe, will, by the turn of the century, produce a dangerous rise in world temperatures with severe consequences, such as melting of the ice caps and subsequent flooding of the world’s lowlands. Such a scenario doesn’t bear thinking about, when one takes into account the elevation of the countless low-lying cities and towns of the world!
    Your father cared very, very much not about being right, but about avoiding the distress that climate change will cause. Above all else, I think that legacy needs to be taken forward.
  6. Wow! There's one I've not seen before. "There are no peers in the field of research that I have invented therefore no one is qualified to review it." [paraphrased] Think Spencer will pick up on this line any time soon?
  7. Well-said, Sphaerica.
  8. I thank Sphaerica for his indulgence (though he has missed quite a bit. I wont say 'cherry-picked' because I think he has made a genuine effort.)There is no mention of the development of the basic tenet of the book (ie. The Ratios Principle)or its subsequent and future application. The assertion that A S Gaddes only depended on Australian Rainfall records is erroneous.He very much used Deep Ice Core And Tree-ring data to generate his tables. His discussion of the importance of volcanic activity has not been 'nailed down' by current Climate Science, it is in fact ignored or considered irrelevant. What caused the so called 'La Nina' events in Southern Australia at the time of the eruption of Mt Pucon in Mexico 2011? Or the bitterly cold Northern Hemisphere winter at the time of the eruption of Eyjatjallajokull in Iceland? Finally,(for the moment,) are the forecasts generated by the Ratios Principle correct? If they are then the 'method' must have had something to do with it. It took me many readings to 'understand' this work, I expect it will take those more astute and qualified than myself more than one reading.
    Response:

    [DB] Again you continue to prosecute your agenda of curve-fitting without plausible, physical mechanisms for support nor do you provide testable references.  As such you are a practitioner of climastrology.

    As noted earlier, pick the element you feel strongest about & post on it on the most appropriate thread.  Further comments of this nature constitute Gish Gallop and will perforce be deleted.  Failure to follow this guidance is cause for a rescinding of posting privileges. 

    No further warnings shall be given.

  9. 933, Don, While I admitted from the start that I skimmed much of it, I missed nothing. The Ratios Principle is irrelevant to the stated applicability. It does not matter if he used super computers or fairy dust, alien calculus or a child's arithmetic. The bottom line is that he must demonstrate some ability to both mirror past and to predict future global temperature trends, and I see no effort whatsoever to do so, when it should in fact be the centerpiece of everything (not some "Ratios Principle"). I did see frequent reference to the ice cores and tree rings to create his tables (i.e. to identify the "cycles"), but he does not test his cycles against any temperature record of any sort (and, to some extent, testing the output against the input would be cheating and of no value -- I could do the exact same thing with any history of stock exchange records, but with no chance of making a future killing from the results). I did not say that his method depended on Australian Rainfall, I said that his method was used to correlate to it. Either way, it is useless in the climate debate if it is not in some way tied to global climate change, and it is not. If it is, please identify the pages, lines, tables and words that do so. As far as volcanic activity ("ignored and considered irrelevant"), you are simply wrong and you need to do more research. As far as the "forecasts generated by the Ratios Principle"... exactly where are they? They aren't in the book that I could see. That's my major complaint. Where is the testable prediction? Appendices 1 and 2 contain some bizarre and utterly vague forecasts of "dry cycles" in Australia. By what measure? Where are the real world observations that match the truth of the predictions? Where is the math that shows that the predictions are anything more than fabricated data to match some (unrevealed, unclear) observations? And who cares? How does this in any way presume to predict climate change, or the steady rise in temperatures since 1979?
    It took me many readings to 'understand' this work, I expect it will take those more astute and qualified than myself more than one reading.
    I have no intention of reading it again. There is nothing there of value. Again, you are doing your father a grave disservice by using his work to thwart true climate science and forestall action, rather than vice versa.
  10. 933, Don, Your material has now been peer reviewed. You have been given specific areas wherein it fails. The next step in the peer review process is to do the hard part, accept and address those errors, and resubmit it to review.
  11. 933, Don, 21,400 peer reviewed papers on volcanic activity and climate change since 2000
  12. 933 - Don Really! Sphaerica has clearly put substantial effort into looking at the work presented; unlike I who glibly dismissed it as gibberish based soley on your posts. You - I and others - should be thankful, show appreciation for the work, thought and time spent; You should let the work either rest where it is or progrss it as advised. to post faint thanks, then faint accusation and then just continue where you left off is not only impolite, but is failing to take advantage of the excellent assistance you have been offered. Neither polite nor scientific.
  13. Don Gaddes privilege to post comments on the SkS website should be revoked. SkS is under no obligation to provide him with a forum to publish his pseudo-science.
  14. I might suggest a bit of care in posts - While D. Gaddes has pushed moderation limits in repeating ads for downloading his PDF, he has since attempted to put at least some of his theories up for consideration. That said, they (IMO) lack explanatory power, fall into the general category of 'curve-fitting' while bypassing physics, and are not going to provide predictive power. They have not been submitted to, nor evaluated by, any peer-reviewed journals (where peer-review acts as a filter for a minimal level of quality). And now, thanks to the discussion here, that should be clear to unbiased readers as well. Don Gaddes - I believe the objections raised here hold. Without a testable physical mechanism for these cycles to influence climate in some fashion, nor a clear set of testable predictions, these 'ratios' and cycles have little scientific value. With those (if you can for example supply some mechanism wherein the "Metonic Cycle of the Moon's Nodes" affects climate, and/or testable climate predictions), it can at least be evaluated. But that said - the posters on this site have very little patience for hand-waving.
  15. Sphaerica#936: And strangely enough, there are 29 papers in G.Scholar for "ratios principle." Unfortunately, none of them have anything to do with climate, sun, moon or the price of tea.
  16. See (921) for my answer to the queries on temperature readings (or lack of them.)The Ratios Principle predicts 'Dry Cycles' not Heat Fluctuations.I suspect the current predilection for temperature fixation is just an attempt to 'prop up' AGW. For the queries on Drift of Magnetic Field. It is my understanding that the Earth revolves around the Sun once every Earth/Solar Year, 360 degrees, 30 degrees/month. I believe we are accompanied on this journey by our Magnetic Field. Does the Magnetic Field 'drift, undulate, waft or cavort?' Probably all of the above. I stand by the 'Ratios Principle' and the methods used to obtain it. Apart from my own observations it should be perfectly simple for anyone to check the veracity of the forecasts from 1976 (or before,)to 2011. KR(939) I appreciate your 'moderate approach' The Metonic cycle of the Moon's Nodes is an important 'Constant' in the Ratios Principle calculation. It appears to affect the severity and duration of 'Dry Cycles.' (see where the Metonic Cycle appears in the Forecast Tables, and accompanying comments.)Perhaps you can use Sphaerica's copy,(apparently he wont be using it any more.) It is now cold and dry in America, 'physically indicating' the predicted passage of the 'Dry Cycle' due to reach Australia in early January 2012.
    Response:

    [DB] "Does the Magnetic Field 'drift, undulate, waft or cavort?' Probably all of the above."

    Now you resort to trolling by argumentarium.  If you honestly cannot understand what you are talking about in this point you must then also summon the intellectual honesty to admit it and then get more knowledge.

    "Apart from my own observations it should be perfectly simple for anyone to check the veracity of the forecasts from 1976 (or before,)to 2011."

    Eyecrometers do not cut it in science.  You must perform statistical significance tests to provide a scientific basis for your claims.  You still practition climastrology as a result.

    "It appears to affect the severity and duration of 'Dry Cycles.'"

    IBID.

    "It is now cold and dry in America"

    Winter approaches.  For many parts of America this means rain, not drought.  Or do include the seasons in your collection of semimythical cycles?

    Either step it up and provide real scientific evidence (via significance testing) to support your extraordinary claims (which bear the burden of proof of extraordinary evidence to support them) or take your agenda elsewhere.  Many "alternatives-to-science" blogs exist that will gladly welcome you.

    Evasion struck out.

  17. Modirator DB "Now you resort to trolling by argumentarium" regarding "Does the Magnetic Field 'drift, undulate, waft or cavort?' Probably all of the above." I think you are being unfair. This understanding of magnetic fields, along with the above statements regarding gravity, clearly belong in the comments section of the 2nd law thread - just based on the quality of the physics.
    Response:

    [DB] Point taken.  ;)

  18. Don Gaddes#941: "I believe we are accompanied on this journey by our Magnetic Field." That is not what geomagnetism folks mean when they speak of 'drift.' Why not include the 'ratios' based on the earth's daily rotation: 360 degrees per day! "Does the Magnetic Field 'drift, undulate, waft or cavort?'" If you base your ideas on magnetic 'drift,' it would be wise to take a serious approach to that concept - beginning with using the word drift as it is understood.
  19. Don,
    ...the current predilection for temperature fixation is just an attempt to 'prop up' AGW.
    You must be kidding. Not only do you want to supplant all of climate science with your own vague, incomplete and unsupported hypothesis, but you even want to supplant the metric that global mean temperature is a good (the best) criterion on which to evaluate global climate, and to instead replace it with total precipitation? Except in your case you have only evaluated this based entirely on a simple binary wet/dry interpretation of rainfall in unspecified areas of Australia alone? Are you serious? I would very strongly suggest that if you want to supplant climate science with your own theories, you begin first by learning more about the theories that you believe are wrong but everyone else accepts, rather than focusing all of your energy on the one theory that you believe and everyone else rejects. Of course, sticking to what you know and blindly pushing it with complete and total dismissal of what other people say is the easy course. It's also unlikely to be remotely effective. You would like everyone (thousands and thousands of scientists) to abandon all of climate science based on hand waving about magnetic fields and pages and pages of this (which, again, simply ties magical cycles to yet-to-be-clarified "wet/dry" measurements of rainfall in Australia): Your paper has been "peer reviewed." Address the issues or accept that you have failed. Continuing to push failure is not advancing science, it's just being a PITA.
  20. For muoncounter(943) The daily Rotation Rate of the Earth is included in the Ratios Principle equation as No. 1 Constant (Earth Period) For DB [Response] Yes, the Seasons (Obliquity) are included in the Equation as No.2 Constant. If the Forecasts (Past and Future) are proven to have veracity, then I am obviously not 'Pushing Failure.'
  21. Sphaerica @944, and interesting if vague set of rainfall hindcasts/forcasts for Australia. As noted in the text, the hindcast of 1982 failed emphatically. What is more, the purported explanation of the failure (the intensity of the cycle) sits uncomfortably with predicted "minor cycle". How catastrophically the hindcast failed is seen below: Further, the 1991-1993 predictions also fail as a prediction for Australia (as opposed to Victoria), lining up as it does with the 1991 to 1995 drought:
    "By late 1991/92, very dry conditions were developing over parts of eastern Australia, though the southeast had some very wet spells and flooding in the winter of 1991 and summer of 1991/92. The 1991/92 Wet season failed over most of northern Australia -it was the driest Wet season on record in the Northern Territory. Generally dry conditions persisted through the first half of 1992. But between late 1992 and late 1993, El Niño conditions waned, waxed, then waned again, with heavy rain and flooding over southeastern Australia during the two waning phases. Over Queensland, however, the drought continued unabated through this period, and extended south over eastern New South Wales, setting the scene for disastrous bushfires in January 1994."
    Indeed, looking at a chart of Australian rainfall, it is very hard to see any evidence of Gaddes' cycles at all: In more detail, here are the years covered by the predictions: 1978 wet 525.6 mm 1979 dry 455.6 mm 1980 np 433.0 mm 1981 dry 535.1 mm 1982 wet 421.4 mm 1983 dry 499.2 mm 1984 wet 555.2 mm 1985 dry 398.8 mm 1986 wet 391.9 mm 1987 wet 453.4 mm 1988 dry 459.8 mm 1989 wet 483.7 mm 1991 wet 469.2 mm 1990 dry 417.6 mm 1992 dry 452.4 mm 1993 wet 499.3 mm The mean over that period is 465.7. I have indicated wet years under the mean, and dry years over the mean by bolding. As can be seen, by this 1/3rd of predictions are false, and some by very large margins. (The probability is slightly worse if 1980 was supposed to be a wet year, as is likely.) Assuming all years where predictions, the probability of achieving that result by chance was 9.2%, so the results are not statistically significant. Given that at least half the results are retrodictions, the performance is singularly unimpressive.
  22. In other words, Don, you're pushing failure.
  23. Oops, seems like it's now operating,excuse my Paranoia. For Tom Curtis (946) Firstly Tom, you are on shaky ground quoting El Nino and BOM 'records' to me! I think Victoria is still part of Australia? I suggest you read the rest of the Forecast to the end of the century and the accompanying notes (if not the whole work.) (-snip-)
    Response:

    [DB] You were warned here to provide significance testing to support your claims.  Failing that, to provide links to peer-reviewed articles published by working scientists in the field in scientifically relevant papers (in this comment here). 

    The comments that you posted that failed to follow this course of action were deleted.  As will subsequent comments, unless you step it up with the requisite testing and citations.  Nothing you have presented thus far meets those standards.

    Your practice thus far is to employ circular reasoning: 

    "Read the book to see what the book says; questions can be answered by studying the book more."

    A continuation of this course of action is simply wasting everyone's time.

  24. 949, Don,
    Whoever decides to further research and expand this work will be in for an exciting ride.
    Go do it. As it stands now, there is no value or substance whatsoever to the work, and trying to sell something that is 1/10th baked is never going to work. Why do you appear to be pleading for someone else to pick this up and finish it? That job falls to you. No one else is going to spend the time, and this site does not exist to help you find someone else to pursue your fantasies for you.
  25. Don Gaddes @948, Victoria is part of Australia, but the retrodictions/predictions where for Australia, not for Victoria. Ad Hoc alteration of the prediction after the event to avoid falsification is no reason for confidence in the theory. Defending your father's theory on the basis that he did not have enough information develop an accurate theory impresses still less. Consequently the only information I am interested in from you is, what was the date of the predictions listed by Sphaerica? Where they all, as I suspect, hindcasts?

Prev  28  29  30  31  32  33  34  35  36  37  38  39  40  41  42  43  44  45  46  47  Next

Post a Comment

Political, off-topic or ad hominem comments will be deleted. Comments Policy...

You need to be logged in to post a comment. Login via the left margin or if you're new, register here.

Link to this page


The Consensus Project Website

THE ESCALATOR

(free to republish)


© Copyright 2024 John Cook
Home | Translations | About Us | Privacy | Contact Us