Climate Science Glossary

Term Lookup

Enter a term in the search box to find its definition.

Settings

Use the controls in the far right panel to increase or decrease the number of terms automatically displayed (or to completely turn that feature off).

Term Lookup

Settings


All IPCC definitions taken from Climate Change 2007: The Physical Science Basis. Working Group I Contribution to the Fourth Assessment Report of the Intergovernmental Panel on Climate Change, Annex I, Glossary, pp. 941-954. Cambridge University Press.

Home Arguments Software Resources Comments The Consensus Project Translations About Support

Twitter Facebook YouTube Mastodon MeWe

RSS Posts RSS Comments Email Subscribe


Climate's changed before
It's the sun
It's not bad
There is no consensus
It's cooling
Models are unreliable
Temp record is unreliable
Animals and plants can adapt
It hasn't warmed since 1998
Antarctica is gaining ice
View All Arguments...


Username
Password
New? Register here
Forgot your password?

Latest Posts

Archives

Sun & climate: moving in opposite directions

What the science says...

Select a level... Basic Intermediate Advanced

The sun's energy has decreased since the 1980s but the Earth keeps warming faster than before.

Climate Myth...

It's the sun

"Over the past few hundred years, there has been a steady increase in the numbers of sunspots, at the time when the Earth has been getting warmer. The data suggests solar activity is influencing the global climate causing the world to get warmer." (BBC)

At a glance

Thankfully for us, our Sun is a very average kind of star. That means it behaves stably over billions of years, steadily consuming its hydrogen fuel in the nuclear reaction that produces sunshine.

Solar stability, along with the Greenhouse Effect, combine to give our planet a habitable range of surface temperatures. In contrast, less stable stars can vary a lot in their radiation output. That lack of stability can prevent life, as we know it, from evolving on any planets that might orbit such stars.

That the Sun is a stable type of star is clearly demonstrated by the amount of Solar energy reaching Earth's average orbital position: it varies very little at all. This quantity, called the Total Solar Irradiance, has been measured for around forty years with high accuracy by sensitive instruments aboard satellites. Its average value is 1,362 watts per square metre. Irradiance fluctuates by about a watt either way, depending on where we are within the 11-year long sunspot cycle. That's a variation of no more than 0.15%.

From the early 1970s until today, the Solar radiation reaching the top of Earth's atmosphere has in fact shown a very slight decline. Through that same period, global temperatures have continued to increase. The two data records, incoming Solar energy and global temperature, have diverged. That means they have gone in opposite directions. If incoming Solar energy has decreased while the Earth continues to warm up, the Sun cannot be the control-knob of that warming.

Attempts to blame the sun for the rise in global temperatures have had to involve taking the data but selecting only the time periods that support such an argument. The remaining parts of the information - showing that divergence - have had to be ditched. Proper science study requires that all the available data be considered, not just a part of it. This particular sin is known as “cherry-picking”.

Please use this form to provide feedback about this new "At a glance" section, which was updated on May 27, 2023 to improve its readability. Read a more technical version below or dig deeper via the tabs above!


Further details

Our Sun is an average-sized main sequence star that is steadily using its hydrogen fuel, situated some 150 million kilometres away from Earth. That distance was first determined (with a small error) by a time consuming and complex set of measurements in the late 1700s. It led to the first systemic considerations of Earth's climate by Joseph Fourier in the 1820s. Fourier's number-crunching led him to realise a planet of Earth's size situated that far from the Sun ought to be significantly colder than it was. He was thereby laying the foundation stone for the line of enquiry that led after a few decades to the discovery of what we now call the Greenhouse Effect – and the way that effect changes in intensity as a response to rising or falling levels of the various greenhouse gases.

TSI Solar cycles

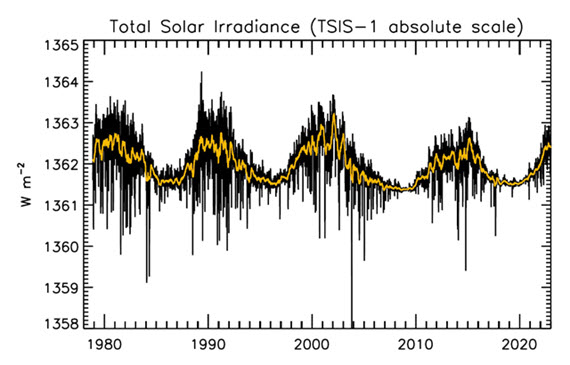
Figure 1: Plot of the observational record (1979-2022) on the scale of the TSIS-1 instrument currently flying on the space station. In this plot, the different records are all cross calibrated to the TSIS-1 absolute scale (e.g., the TSIS1-absolute scale is 0.858 W/m^2 higher than the SORCE absolute scale) so the variability of TSI in this plot is considered to be its “true variability” (within cross calibration uncertainties). Image: Judith Lean.

The Sun has a strong magnetic field, but one that is constantly on the move, to the extent that around every 11 years or so, Solar polarity flips: north becomes south, until another 11 years has passed when it flips back again. These Solar Cycles affect what happens at the surface of the Sun, such as the sunspots caused by those magnetic fields. Each cycle starts at Solar Minimum with very few or no sunspots, then rises mid-cycle towards Solar Maximum, where sunspots are numerous, before falling back towards the end. The total radiation emitted by the Sun – total solar irradiance (TSI) is the technical term – essentially defined as the solar flux at the Earth's orbital radius, fluctuates through this 11-year cycle by up to 0.15% between maximum and minimum.

Such short term and small fluctuations in TSI do not have a strong long term influence on Earth's climate: they are not large enough and as it's a cycle, they essentially cancel one another out. Over the longer term, more sustained changes in TSI over centuries are more important. This is why such information is included, along with other natural and human-driven influences, when running climate models, to ask them, “what if?"

An examination of the past 1150 years found temperatures to have closely matched solar activity for much of that time (Usoskin et al. 2005). But also for much of that time, greenhouse gas concentrations hardly varied at all. This led the study to conclude, "...so that at least this most recent warming episode must have another source."

TSI vs. T
Figure 2: Annual global temperature change (thin light red) with 11 year moving average of temperature (thick dark red). Temperature from NASA GISS. Annual Total Solar Irradiance (thin light blue) with 11 year moving average of TSI (thick dark blue). TSI from 1880 to 1978 from Krivova et al. 2007. TSI from 1979 to 2015 from the World Radiation Center (see their PMOD index page for data updates). Plots of the most recent solar irradiance can be found at the Laboratory for Atmospheric and Space Physics LISIRD site.

The slight decline in Solar activity after 1975 was picked up through a number of independent measurements, so is definitely real. Over the last 45 years of global warming, Solar activity and global temperature have therefore been steadily diverging. In fact, an analysis of solar trends concluded that the sun has actually contributed a slight cooling influence into the mix that has driven global temperature through recent decades (Lockwood, 2008), but the massive increase in carbon-based greenhouse gases is the main forcing agent at present.

Other studies tend to agree. Foster & Rahmstorf (2011) used multiple linear regression to quantify and remove the effects of the El Niño Southern Oscillation (ENSO) and solar and volcanic activity from the surface and lower troposphere temperature data.  They found that from 1979 to 2010, solar activity had a very slight cooling effect of between -0.014 and -0.023°C per decade, depending on the data set. A more recent graphic, from the IPCC AR6, shows these trends to have continued.

AR6 WGI SPM Figure 1 Panel p

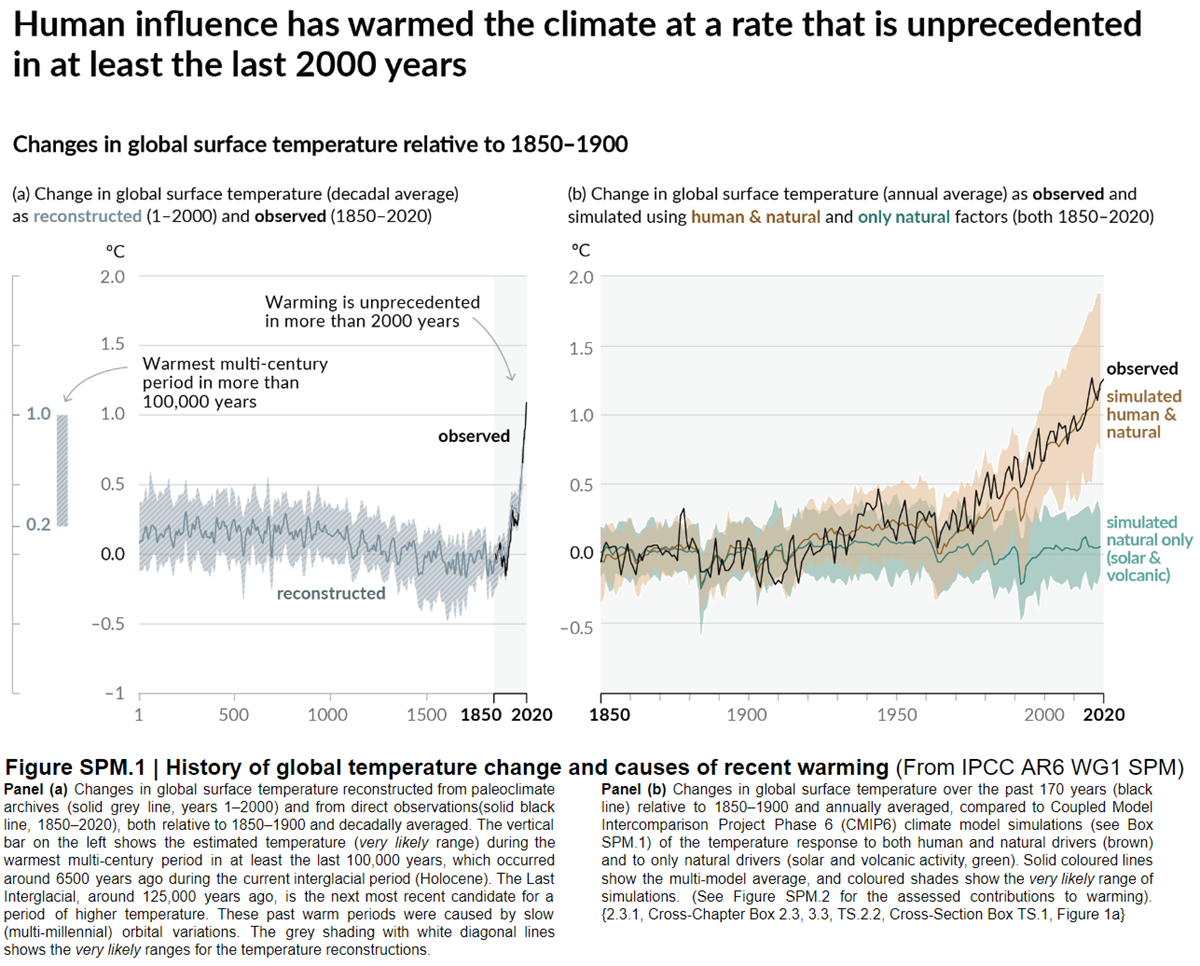
Figure 3: Figure SPM.1 (IPCC AR6 WGI SPM) - History of global temperature change and causes of recent warming panel (b). Changes in global surface temperature over the past 170 years (black line) relative to 1850–1900 and annually averaged, compared to Coupled Model Intercomparison Project Phase 6 (CMIP6) climate model simulations (see Box SPM.1) of the temperature response to both human and natural drivers (brown) and to only natural drivers (solar and volcanic activity, green). For the full image and caption please click here or on the image.

Like Foster & Rahmstorf, Lean & Rind (2008) performed a multiple linear regression on the temperature data, and found that while solar activity can account for about 11% of the global warming from 1889 to 2006, it can only account for 1.6% of the warming from 1955 to 2005, and had a slight cooling effect (-0.004°C per decade) from 1979 to 2005.

Finally, physics does not support the claim that changes in TSI drive current climate change. If that claim had any credence, we would not expect to see the current situation, in which Earth's lower atmosphere is warming strongly whereas the upper atmosphere is cooling. That is exactly the pattern predicted by physics, in our situation where we have overloaded Earth's atmosphere with greenhouse gases. If warming was solely down to the Sun, we would expect the opposite pattern. In fact, the only way to propagate this myth nowadays involves cherry-picking everything prior to 1975 and completely disregarding all the more recent data. That's simply not science.

Longer-term variations in TSI received by Earth

It's also important to mention variations in TSI driven not by Solar energy output but by variations in Earth's orbit, that are of course independent of Solar activity. Such variations, however, take place over very long periods, described by the Milankovitch orbital cycles operating over tens of thousands of years. Those cycles determine the distance between Earth and the Sun at perihelion and aphelion and in addition the tilt the planet's axis of rotation: both affect how much heat-radiation the planet receives at the top of its atmosphere through time. But such fluctuations are nothing like the rapid changes we see in the weather, such as the difference between a sunny day and a cloudy one. The long time-factor ensures that.

Another even more obscure approach used to claim, "it's the sun" was (and probably still is in some quarters) to talk about, "indirect effects". To wit, when studies can't find a sufficiently large direct effect, bring even lesser factors to the fore, such as cosmic rays. Fail.

In conclusion, the recent, post 1975 steep rise in global temperatures are not reflected in TSI changes that have in fact exerted a slight cooling influence. Milankovitch cycles that operate over vastly bigger time-scales simply don't work quickly enough to change climate drastically over a few decades. Instead, the enormous rise in greenhouse gas concentrations over the same period is the primary forcing-agent. The physics predicted what is now being observed.

Last updated on 27 May 2023 by John Mason. View Archives

Printable Version  |  Offline PDF Version  |  Link to this page

Argument Feedback

Please use this form to let us know about suggested updates to this rebuttal.

Related Arguments

Further viewing

Related video from Peter Sinclair's "Climate Denial Crock of the Week" series:

Further viewing

This video created by Andy Redwood in May 2020 is an interesting and creative interpretation of this rebuttal:

Myth Deconstruction

Related resource: Myth Deconstruction as animated GIF

MD Sun

Please check the related blog post for background information about this graphics resource.

Denial101x videos

Related lecture-videos from Denial101x - Making Sense of Climate Science Denial

and

Additional video from the MOOC

Expert interview with Mike Lockwood

Comments

Prev  20  21  22  23  24  25  26  27  28  29  30  31  32  33  34  35  36  37  38  39  Next

Comments 726 to 750 out of 1302:

  1. OK, so your graphs show basically nothing. They either cover too short of time so that a supposed correlation or lack there of is most likely a figment of one's imagination... OR ... they lack a 'key' as is the case with the graph labeled "reconstructed temperatures" which makes it a bunch of squiggly lines... one marked 2004 one marked medieval warming. If the lines represent different ways of measuring the temperature of the past? why the difference? Shouldn't we be focusing on data that has been reliably taken... not theoretically? Can't we agree that regardless of how steep the upward trend of some graph is that our actions are not helping?
  2. If you're interested in reading the opposing viewpoint, Nir J. Shaviv, Isreali Astrophysicist, writes about Solar Forcing. He is quite readable. Carbon Dioxide or Solar Forcing? http://www.sciencebits.com/CO2orSolar Chris Shaker
  3. CO2 believers attempt to squash consideration of solar forcing, while other scientists keep raising its validity. This one is from Australia, and was actually published by the AGU: http://www.agu.org/pubs/crossref/2010/2010GL042918.shtml Chris Shaker
  4. cjshaker - Regarding the cosmic ray argument you presented here, you should read the Could cosmic rays be causing global warming page. No statistically significant correlation between cosmic rays and global temperature has ever been established, unlike the clear correlation between temperature rises of the last 150 years and CO2 concentrations. Dr. Shaviv is expressing a viewpoint not supported by the data. The link you present here, on solar forcing, discusses the last 6500 years, not the present, and states "We present evidence to support physical links between variability in solar irradiance and change in the hydroclimate of southeast Australia and suggest that the effects of global warming and solar maxima on atmospheric circulation over extra-tropical regions may exacerbate these impacts" (emphasis added). This is hardly a critique of AGW. You should read CO2 is not the only driver of climate - CO2 has a dominant effect now, but hasn't been the driver for most climate changes in the past.
  5. cjshaker "CO2 believers" do not "squash consideration of solar forcing". Unfortunately, it's bad news for our friends living Down Under: "As a result, the effects of possible synergies occurring between global warming and solar maxima on atmospheric circulation over extra‐tropical regions could result in severe drought becoming the typical climate state in regions such as southeast Australia."
  6. Regarding claims that CO2 is the dominant driver of the current global temperature, I don't even see the IPCC making that claim. I haven't seen them claim over 1 C temperature rise from man's CO2. The glacial cycle would seem to have made a much bigger difference than that over the past 14,000 years. Chris Shaker
  7. #731: "The glacial cycle would seem to have made a much bigger difference " The 'glacial cycle' is a result, not a cause. Increased atmospheric CO2 is a causative agent (aka 'forcing') of increased warming. See CO2 is not the only driver. Please find the appropriate threads for further comments about whatever you refer to as 'cycles' -- this is 'its the sun'.
  8. Far be it for me a mere mortal to criticise scientists but if you are looking for the effects of CO2 on heat retention you should be comparing the daily maximum temperature with the daily minimum and compare one year another. i.e the daily heat loss. If the rise in temperature is due to the sun then the days maximum will be high but the amount of heat lost over the night will be constant. If it's due to CO2 then less heat will be lost at night.
  9. #733: "you should be comparing the daily maximum temperature with the daily minimum " Yes. See the post here.
  10. In another thread, Norman writes: From information I had, it was not the TSI that effected the Earth's climate but Sunspot number (from the Maunder minimum). They were not measuring the TSI at that time. I was looking for information on sunspot number to correlate with Global temps and that sight had the graph I was looking for. Obviously, the sunspot number itself doesn't influence the earth's climate -- it has to be modulated through some physical process. So if you're not using sunspots as a proxy for solar irradiance, how do you suggest that sunspots affect the climate?
  11. #735 Ned, "Obviously, the sunspot number itself doesn't influence the earth's climate -- it has to be modulated through some physical process. So if you're not using sunspots as a proxy for solar irradiance, how do you suggest that sunspots affect the climate?" This writer believes an atmospheric electrical circuit can explain how an active sun will change climate other than the TSI. Sun's effect on electrical properties of the atmosphere and how these may cause Climate Change. I am not saying this writer's theory is correct but it does answer your question about how sunspot number can cause changes in climate.
  12. Hi, Norman. So how does "an active sun" and "an atmospheric electrical circuit" change the climate? What is the physical mechanism? Can you give me a summary, or do I have to read the manuscript?
  13. #737 Ned, A quote from the article: "Despite the difficulty in identifying cause and effect in a chaotic system such as the atmosphere, it remains possible that the global atmospheric electrical circuit provides a neglected feedback in the climate system, and with it, an amplification of the solar variability signal in the climate records. This is the principal reason why the topic now deserves further exploration." The basic point was cloud formation physics and how the electrical circuit effects this phenomena. Clouds are what cause the Earth's albedo to be around 0.3. If not for clouds the albedo would be around 0.1 (ocean's make up 70% of the surface) and the Earth would be much warmer.
  14. Re: Ned (737) Based upon my (admittedly) skimming through of the paper, I saw some data cherry-picking, chance correlations and gibberish (to use some technical descriptors). Maybe I'm under-selling it, but no physical mechanism postulated in the study also postulates why the physical processes of GHG's work for the remainder of the paleo record, but not for the past 30 years. Hence my gibberish descriptor. Maybe if it had been written in Yooperese:
    "Aino went down by da crick where he'd seen dat 8-pointer da year gone by, eh? And what da ya know, der was da biggest cayoat standin' next to da still! Next time mebbe der will be a bare! - Toivil"
    The Yooper
  15. Ned, On a previous thread I posted a albedo calculator. Located on the page I will link to. It is a calculator that will determine temp with no GHG, just the two variables. TSI and albedo (basically to simplify so you can see relative contribution to temp). If you play with this calculator a bit you will see TSI has little effect at the ranges during sunspot cycles. But alter the albedo a few %points and you can see it has a rather large effect on global temps. If sunspot cycles alter the Earth's albedo even a few percent points, they can have a large effect on global temps. Not saying that is the cause but if sunspot number does effect cloud formation via the Earth's electrical circuit then that is a mechanism to explain how sunspot number can alter climate.
  16. Sorry Ned, I neglected to link to the albedo calculator. albedo and TSI calculator.
  17. Norman, firstly, your calculator is too simplistic. Clouds both warm and cool. Secondly, noone doubts changing albedo (with no other change) will affect temperature. So magical fairy dust might increase albedo but "electrical connection between sun-earth" is in same category until someone presents some believable physics to show how this could work instead of gobbledegook. You appear to preferring wild speculation backed by dodgy "facts" in preference to a working model, conforming to known physics.
  18. Ray Ladbury just offered up this juicy bit which aptly describes the focus on GCR's and magical other postulated electric-thingy's:
    "First, you have to look at ALL the evidence. There is no way you get simultaneous stratospheric cooling and tropospheric warming without a greenhouse forcing. And increased tropospheric water vapor ain’t gonna give you that. Second, one cannot simply posit a mystery forcing and say it will behave like a greenhouse gas without specifying the candidate mechanism. If they were saying the mechanism were increased insolation, then perhaps you would see warmed nights, but it is very unlikely you’d see the seasonal effect (WV persists only on a timescale of days). I cannot emphasize this second point enough. I mean ferchrissake, they could posit Martians with heat rays sending in IR photons to exactly mimic greenhouse forcing by CO2. They need to propose a mechanism and see what sort of signature it would give. Simply saying, “Well, it could be something else” ain’t science."
    I love it when PHd's get riled... The Yooper
  19. scaddenp writes: Secondly, noone doubts changing albedo (with no other change) will affect temperature You obviously haven't been keeping up with the thread on the second law of thermodynamics, where someone just wrote: "The idea that planetary temperature is affected by its albedo is quite mistaken."
  20. Ned, I had kind of (lost interest really in someone determined not to understand physics) so perhaps "noone" was optimistic. Let try "no physicist doubts..."
  21. #743 Daniel Bailey, Ray Ladbury may make statements with vigor and certainty but that does not make them correct. "First, you have to look at ALL the evidence. There is no way you get simultaneous stratospheric cooling and tropospheric warming without a greenhouse forcing. And increased tropospheric water vapor ain’t gonna give you that." NASA may disagree. An active Sun can destroy ozone in the stratosphere (the primary cause of warming in that region). An active sun can warm the Troposphere by adding more heat to the surface and by destroying the ozone it can at the same time cool the stratosphere. No greenhouse forcing is needed in this case. You have two possible causes for an observed effect. It is possible (I am not saying it is likely, just questioning the claim made by Ray Ladbury) that the troposphere can warm at the same time the stratosphere cools via active sun without GHG forcing (in an atmophere with no GHG that is). Supporting evidence for the above claim. Active Sun can destroy ozone in stratosphere.
  22. Norman @746, you ought to read your sources more carefully. Specifically, from your link above,
    "If you look at the total atmospheric column, from your head on up to the top of the atmosphere, this solar proton event depleted less than one percent of the total ozone in the Northern Hemisphere."
    A 1% reduction of NH ozone (less from the SH) would represent at most a 1% reduction of incoming UV energy, and a 0.25% reduction in temperature. To put that into perspective, chlorofluorocarbons reduced stratospheric ozone by about 30%, an effect which contributes around 30% of the observed cooling of the stratosphere. As the event causing this reduction was episodic (the one observed being the third largest in 30 years) and as the Ozone recovers between episodes, it is doubtfull that such events would compensate for the warming effect in the stratosphere of increased insolation. They certainly would not reverse that effect and give as large a cooling as has been observed.
  23. The figure (and referenced data) show a de-coupling of solar output from Earth's surface temperatures, starting in the mid 1970s. The conclusion is that there must be another causative agent that overwhelms solar influences, starting around that time (greenhouse gases). But the data's weakness is that the prior correlation only goes back a few hundred years. If the data was traced back a few thousand years, then would it show any other periods of uncoupling? Or is the recent uncoupling unique in the holocene?
  24. Re: TheCaz (748) Short answer? In the paleo record, CO2 acted as a feedback to temperatures, with orbital factors being a primary driver of climate change (with the exception of methane burps [think PETM]). What is different today is the immense bolus, or carbon slug, of CO2 mankind has injected into the atmosphere. By doing so, we have changed the game: instead of CO2 acting as a feedback, it now acts as forcing, causing a cascade feedback reaction of warming that also drives more CO2 and CH4 release, causing further warming. The warming will continue until CO2/CH4 emissions stablize + about 40 years for the thermal lag of the oceans to catch up. Once radiative balance is then achieved, temps and resulting large and micro-scale climate patterns will stabilize. And that was the short answer. The Yooper
  25. Although that is interesting, it does not actually anser the question about the correlation between solar activity and surface temperatures.
    Response: [Daniel Bailey] I addressed everything in your original comment that had a question mark attached. As to your question in this comment, did you read the original post? How about the Intermediate version? Or the Advanced version?

Prev  20  21  22  23  24  25  26  27  28  29  30  31  32  33  34  35  36  37  38  39  Next

Post a Comment

Political, off-topic or ad hominem comments will be deleted. Comments Policy...

You need to be logged in to post a comment. Login via the left margin or if you're new, register here.

Link to this page


The Consensus Project Website

THE ESCALATOR

(free to republish)


© Copyright 2024 John Cook
Home | Translations | About Us | Privacy | Contact Us