


 Arguments


Is extreme weather caused by global warming?
What the science says...
| Select a level... |
 Basic
Basic
|
 Intermediate
| |||
|
Global warming amplifies the risk factors for extreme weather events - and that is all that Climate Science claims. |
|||||
Climate Myth...
Extreme weather isn't caused by global warming
"The 30 major droughts of the 20th century were likely natural in all respects; and, hence, they are "indicative of what could also happen in the future," as Narisma et al. state in their concluding paragraph. And happen they will. Consequently, the next time a serious drought takes hold of some part of the world and the likes of Al Gore blame it on the "carbon footprints" of you and your family, ask them why just the opposite of what their hypothesis suggests actually occurred over the course of the 20th century, i.e., why, when the earth warmed - and at a rate and to a degree that they claim was unprecedented overthousands of years - the rate-of-occurrence of severe regional droughts actually declined." (source: CO2 Science)
At-a-glance
Have you experienced an extreme weather event?
The answer to that question first requires a definition for 'extreme' weather. What threshold must be passed for 'bad' weather to take on the distinction of being 'extreme'?
The IPCC Sixth Assessment Report (AR6) defines an extreme weather event as, “an event that is rare at a particular place and time of year”. So we're getting somewhere now, although we're still left with 'rare', which is not a precise term. But we have to be pragmatic about such things. It's fair to say that torrential rain, for example, is common enough seasonally in the world's Monsoon belts but infrequent in deserts, so 'rare' in that latter case is a justifiable word to use.
When those Monsoon-affected parts of the world experience torrential rain sufficient to submerge vast areas of a country beneath flood-waters, we can agree that's pretty extreme, too. Basic physics tells us that for every degree Celsius of extra warmth, air can carry 7% more moisture. So the potential for heavier rains in a warming world is obvious. The IPCC use strictly-defined categories of probability. In AR6, the probability of an increase in heavy precipitation events is given as "Likely on a global scale, over a majority of land regions". That probability is described in terms of their, "increased frequency, intensity, and/or amount of heavy precipitation". 'Likely' means they are 66-100% certain this will happen.
National weather agencies are able to compare weather events against a baseline for which they have good data-coverage. In most countries, such coverage has been in place since the mid 20th Century, but in some, such as the UK, the data go back for another 100 years. So if a record in terms of heat or daily rainfall amount does get broken, that's significant.
In July 2022, for example, the UK saw extraordinarily high temperatures with a daily maximum of 40.3°C recorded at Coningsby in Lincolnshire. This was the first time 40°C had ever been recorded in the UK. But more astonishingly, a total of 46 other weather stations exceeded the previous UK record of 38.7°C. In addition, overnight minimum temperatures widely exceeded anything recorded before. That scorching heat wave, coming on top of drought conditions, had tremendous impacts both in terms of lives lost and fire-related damage. Again, that's significant.
The problem is that in a warming world, 40°C days in the UK can be expected to become more frequent as the decades pass by. In a world where global warming continues unabated, yesterday's extreme becomes next century's normal. The trend of, "warmer and/or more frequent hot days and nights over most land areas", is described in AR6 as, "virtually certain". In the strictly-defined categories of probability adopted by the IPCC, 'virtually certain' can only be used where there is 99-100% probability.
So the take-home is that some, but not all weather-types are liable to be amplified in their severity and frequency by global warming. Heat, drought, fire-weather and long-duration heavy rains: surely that's enough to be dealing with.
Please use this form to provide feedback about this new "At a glance" section. Read a more technical version below or dig deeper via the tabs above!
Further details
Whenever there is an extreme weather event such as a flood or drought, the media will tend to feature it and the question that is often raised is whether that event was caused by global warming. Unfortunately, there is often no quick answer to this question. That is because weather is highly variable and extreme weather events have always happened. The attribution-studies required to determine whether a global warming signal is detectable are complex. They take a lot of time. Detecting trends also takes time, particularly in cases where observational records are rare or even missing in certain regions.
An increase in some categories of extreme weather is nevertheless expected with global warming, because rising temperatures affect weather phenomena in several ways. Appropriately and in a timely fashion, the working group one (WG1) section of the IPCC’s Sixth Assessment Report (AR6) includes a chapter specifically dedicated to discussing weather extremes. That's a first, assessing how such things have changed both regionally and globally, in recent decades. A key conclusion is that it is an “established fact" that human greenhouse gas emissions have “led to an increased frequency and/or intensity of some weather and climate extremes since pre-industrial times”.
How global warming affects weather
Rising temperatures can have several effects on the weather. For example:
- They increase the rate of evapotranspiration, which is the total evaporation of water from soil, plants and water bodies. This can have a direct effect on the frequency and intensity of droughts.
- A warmer atmosphere can hold more water vapour, potentially increasing the severity of intense or prolonged rainfall events. According to AR6, "combined satellite and reanalysis estimates and CMIP6 atmosphere-only simulations (1988–2014) show global mean precipitable water vapour increases of 6.7 ± 0.3 % °C–1, very close to the Clausius–Clapeyron rate (Allan et al. 2020)".
- Changes in sea-surface temperatures (SSTs) also have an effect by bringing about associated changes in atmospheric circulation and precipitation. This has been implicated in some droughts, particularly in the tropics.
These changes don't automatically generate extreme weather events but they change the odds that such events will take place: it has often been said that, "climate trains the boxer but the weather throws the punches". It is equivalent to the loading of dice, leading to one side being heavier, so that a certain outcome becomes more likely. In the context of global warming, this means that rising temperatures increase the odds of certain kinds of extreme events occurring.
Changes in extreme weather events are already being observed
In the US, for example, the Global Changes Research Program published a report in 2018 entitled Fourth National Climate Assessment Volume II: Impacts, Risks, and Adaptation in the United States. It reports the following findings for recent decades:
- Some climate-related impacts, such as increasing health risks from extreme heat, are now common to many regions of the United States.
- Many places are subject to more than one climate-related impact, such as extreme rainfall combined with coastal flooding, or drought coupled with extreme heat, wildfire, and flooding.
- Annual precipitation since the beginning of the last century has increased across most of the northern and eastern United States and decreased across much of the southern and western United States. Over the coming century, significant increases are projected in winter and spring over the Northern Great Plains, the Upper Midwest, and the Northeast.
- The frequency of drought has increased in areas such as the Southeast and the West, and decreased in other areas. Rising temperatures make droughts more severe and/or widespread, and also lead to the earlier melting of snowpacks, which can exacerbate problems in vulnerable areas.
- Atlantic hurricanes have increased both in power and frequency, coinciding with warming oceans that provide energy to these storms. In the Eastern Pacific, there have been fewer but stronger hurricanes recently. More research is needed to better understand the extent to which other factors, such as atmospheric stability and circulation, affect hurricane development.
Similarly, Australia has seen the odds of both heavy rainfalls and droughts (and consequent wildfires) increase, and similar patterns are being observed worldwide, coinciding with rising temperatures over the past 50 years. Heat waves are also occurring more frequently as temperatures shift upwards. The same goes for Europe and parts of Asia.
Carbon Brief has an interesting interactive extreme weather map. It lets you see whether attribution studies have been completed for any single event - well worth a look when you have some spare time.
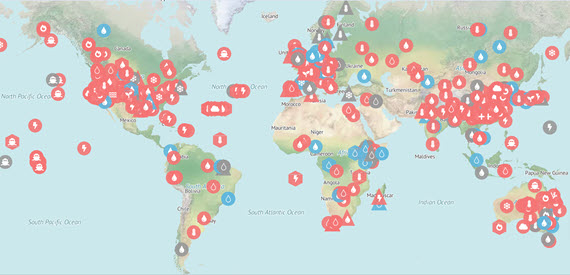
Figure 1: Screenshot of Carbon Brief's interactive map of extreme events. Red icons indicate that human influence was found, blue icons where that is not the case, grey icons where it's inconclusive. Full map with links to the studies available here.
In conclusion, although it isn't possible to state that global warming is causing a particular extreme event at the same time that event is wreaking havoc, it is wrong to say that global warming has no effect on the weather. From the record-breaking “heat dome” of 2021 in the Pacific north-west and the accompanying catastrophic wildfires to the devastating flooding in Europe of July 2021; from the record July 2022 UK heatwave to the disastrous series of atmospheric rivers that struck California from late 2022 to early 2023, extreme weather is occurring all around the planet and records are not just being broken, they are being smashed.
Last updated on 6 August 2023 by John Mason. View Archives


dvaytw, in my experience the fact that Lomborg wrote something is in and of itself a solid indicator that it is unlikely to be true.
More specifically on the IPCC, see this article on how the leaked draft of the impact report actually shows dire consequences indeed, rather than the low impact being falsely claimed by Lomborg and other climate fiction writers.
Unfortunately, I haven't seen a point by point rebuttal of that particular article. However, all his claims are all fairly generic denier talking points which have been debunked on this site and thus rebuttals can be found in the 'most used myths' or via the search box.
My suggestion would be to ask your 'skeptic' to quote the IPCC report itself saying that there is a scientific consensus that AGW is not increasing extreme events.... rather than Lomborg falsely making that claim. There is no such conclusion in the IPCC reports. It's fiction.
Please excuse a very basic question, prompted by the flooding here in the UK and a report on it at <http://www.metoffice.gov.uk/research/news/2014/uk-storms-and-floods>. I understand (a) CO2 etc will raise the temperature and moisture content of warm air; (b) precipitation generally occurs when warm moist air meets colder air. Is the strength of precipitation proportional to the difference in temperature between the two air masses (that causes water vapour to condense)? If so, will not the colder air mass on average also be warmer, so the differential remains roughly constant with rising SST, and precipitation is not necessarily heavier? (If the answer requires maths, please include.) Thanks.
Cedders - the simple answer is that there isn't a linear relationship between the two - the moisture-holding capacity of the air increases faster for any given increase in atmospheric temperature. See the Clausius-Clapeyron relation.
Of course! There's a roughly exponential factor besides the difference in temperatures. "water holding capacity of air increases by about 7% per 1°C warming" Trenberth KE (2011) Changes in precipitation with climate change. Clim Res 47:123-138
Thanks for sorting that out for me, Rob.
Hey SkS'ers. I've been engaging in my guilty hobby of debating denialist trolls again. Have been having a pretty lengthy one on Quora. Basically the only point he continues to give me trouble on is on the question of definitions. He claims that in "real science", terms are defined precisely. He then goes on to say that this doesn't happen in climatology; he uses the example of "extreme weather". If one goes to SREX, 3.1.2., one gets the following definition:
It goes on to explain a lot of issues, advantages, disadvantages etc with the different methods of determining threshold values. His argument is that with such a broad definition (he refuses to even call it a definition), they can basically call anything they want "extreme weather".
I have responded that the IPCC isn't dictating definitions to scientists; further that the broadness of the definition isn't a problem with the science but a feature of reality that scientists must deal with. He claims that it should be easy to come up with a clear and precise definition (he suggests the standard deviation of the index). He asks me how, for example, the IPCC can give a probability that ACC is affecting extreme precipitation when they can't even precisely define what extreme precipitation is.
Can anyone offer help on this? An example in another science where a definition is range migh be very helpful, or anything else y'all can offer.
Dvaytw, it is interesting that your "friend" demands that climate change should have an "all or zero" effect on extreme weather events, and that extreme weather events themselves be "all or zero" extreme/non-extreme, with no fuzziness of inbetween status.
Your "friend" is playing word-games to deceive you and/or himself. Some things can be defined precisely, but some (just as valid in concept) can only be defined with fuzzy logic.
When is sunset exactly - when the sun first touches the horizon / when it is halfway below the horizon / or when the final bright limb of the sun is occluded by the horizon? And mean sea-level horizon? : viewed from what altitude? Five-foot or fifty-foot eye-point?
When does full night start? At sunset, or after the "civil" twilight finishes - or after the "astronomical" twilight? It is all rather arbitrary and imprecise, to a greater or lesser degree. Fuzzy. But it is crazy to deny the real usefulness of concepts such as sunset and twilight.
Does your "friend" think that men and women are separate concepts? Can he tell them apart? Always? How precisely does he define the difference? Appearance is sometimes confusing or deceptive. Sometimes in rare cases for a newborn, the expert paediatricians can be perplexed in making the male/female decision - even with the closest examination of the genitals. Blood hormonal levels can be indecisive. Even when the genome is clearly XX or XY, the outcome can sometimes be apparently "wrong".
Or does your "friend" maintain there is no difference between man and woman?
Well said, Eclectic. And this person isn't my friend.
PS - I'm wondering, though: can anyone show me where to find the definition the IPCC uses for actual calculation of its probabilities regarding the contribution of ACC to extreme precipitation? Or if not that, at least, how to find this definition on one particular study of extreme precipitation?
I took Eclectic's point back to the argument, but he maintains that nevertheless a definition must be chosen if calculations are going to be made from it, and this makes sense to me with my child's understanding of the topic, at least.
And in case anyone is wondering, no, I am not a denialist troll trying to covertly advance these arguments myself. Personally I think the argument is ridiculous; I am just trying to solve the puzzle of how to defeat it without simply dismissing it out of hand.
dvaytw @83, you might find that individual studies use their own statistical cutoff points for what counts as "extreme weather". As the IPCC itself does not do research, they must rely on those studies, and therefore cannot use a specific cut off point, but must rely on those that exist in the literature. If you look at Box 3.1 in the SREX, the IPCC says:
This does not mean that "extreme values" are not precisely defined in original research. Nor does it mean the IPCC treats the issue imprecisely. However, to not overstate the case, they cannot use a precise common definition where one does not exist in the literature. What they do do is take the relative rigour of the statistical cut offs used in individual studies in weighing the evidence from the literature.
As noted on the bottom of the quoted section above, there are often very good reasons for the different cutoffs in different studies. Specifically, if the phenomenon in question has a limited data set, using a 2.5% cut off may result in insufficient data for normal statistical methods. EVT can be used in these cases sometimes, but is not as robust. Droping the cut off may allow the scientists to note, and discuss changes in frequencies that actually exist even when the change is not yet robustly detectable in "extreme extremes".
On top of that, some events are extreme events, and known to be extreme events even when no precise statistical criteria is defined. An example is any hurricane/cyclone/typhoon. Any such is an extreme event with regard to wind speed, and probably precipitation and storm surge as well. To expect the IPCC's discussion of extreme events to exclude all cyclones except the 5% of strongest cyclones would be absurd, but the statistical cut off based just on wind speed for cyclones will not be precisely known (even though clearly it will meet any reasonable such cutoff). The IPCC definition, by not specifying precise values allows discussions of the frequencies and strengths of all cyclones (and tornadoes, and floods) without arbitrary cutoffs being used to exclude relevant data.
Thanks, Tom. I appreciate the immense patience you folks have with my endless queeries. Your answer is very informative, but can you help me with a specific point? The guy has this inane idea that extremes are defined nowhere in the literature. He asks,
"So, what is the threshold variable for extreme rain events in Sydney? How would that be calculated?"
Can you answer this, or at least point me to a definition of "extreme rain" in an individual study? It sounds ridiculous, but he seems to think this is all just smoke and mirrors. I want to point him to something very concrete and graspable.
dvaytw @85:
In my opinion, the World Meterological Organization (WMO) sets the "gold standard" with respect to meterological terms. You can access the definition of "extreme weather" and other terms by going to the WMO's Metroterm* webpage.
*METEOTERM is WMO terminology database. It contains specialized terminology in six languages: Arabic, Chinese, English, French, Russian and Spanish. It includes the International Meteorological Vocabulary, the International Glossary of Hydrology and terms from related sciences that appear in WMO documents.
John Hartz @86, I find the IPCC glossaries sufficiently exact and easy to access. In the case of "extreme weather event", so also did meteoterm:
davytw @85, for precipitation, extreme events are typically defined in terms of the return interval for a certain amount of precipitation over a given time period. Consider the following examples of return intervals from four meteorological stations in South West Western Australia:
The charts show the one day rainfalls for various return intervals for data from 1930-1965 (black) and 1966-2001 (red). A return interval of 0.1 means, approximately, that you would average 10 such events a year. A return interval of 50 means that, on average you would experience only 1 such event every 50 years. You may not think of an event with a return interval of 0.1 years as an extreme event, but it means that the chance of experiencing such a rainfall event on any given day is 2.74%, ie, well within a 5% threshold, and almost within a 2.5% threshold. Of course, such events are not likely to cause anything more than local flooding if that - but they have the great virtue of being sufficiently frequent as to lend themselves to statistical analysis of changes in the return interval.
You can see that above. For return interval below 0.5-1 (depending on the station), there are statistically significant changes in the return interval for a given quantity of rainfall. Above that, even though the rainfall events become more extreme, because they become rarer the change ceases to be statistically significant, at least for individual values.
These charts show a decline in return interval, ie, a lower frequency of extreme rainfall events and hence likely a lower frequency of local or more extreme flooding. As this is for South West Western Australia, climate models predict such a reduction as a result of global warming (with a consequent increased frequency of drought); although the paper from which this analysis comes attributes it to other causes.
A similar calculation could be done for Sydney, and would be done by the same methods. Problems do arise. The return interval for very high rainfall events (>100 years) are predicted from best fit curves such as shown on those graphs. They are, however, unreliable.
The Brisbane region, for example, has experienced at least 4 extreme rainfall events with a purported return interval >500 years in the last 150 years, most recently in the 2011 flood. Two of those events were in the 1890s, and it is possible that two such events occurred within weeks of each other in the 1890s. Clearly the best fit curve is not a reliable predictor at the top of the range. The 2011 flood was unique among these events on a number of grounds, including that it occurred at the time of the greatest flooding of Queensland by arial extent on record, it occurred in the run down from an El Nino (with the second greatest flooding of Queensland by extent occurring earlier the previous year in El Nino conditions). All, or nearly all other major floods in Brisbane have been associated with La Ninas. Further, it occurred without the involvement of any cyclone, unlike the others among the 4 or 5 rainfall events with >500 year notional return intervals, which all occurred when a cyclone, or the remnants of a cyclone tracked along the South East Queensland coast (either just off shore as in 1974) or in the Brisbane valley as in other occasions. Naturally, these unique features suggest global warming was a significant factor in the size of the flood; but because of the low return intervals (notional or actual), that cannot be shown statistically. That is why studies of extremes in precipitation concentrate on the much lower impact, higher return rate events.
dvaytw @85:
You may also want to recommend that your debating partner check out the recently released report, Attribution of Extreme Weather Events in the Context of Climate Change, National Acadamies Press.
The report was authored by the Committee on Extreme Weather Events and Climate Change Attribution; Board on Atmospheric Sciences and Climate; Division on Earth and Life Studies; National Academies of Sciences, Engineering, and Medicine.
Description
As climate has warmed over recent years, a new pattern of more frequent and more intense weather events has unfolded across the globe. Climate models simulate such changes in extreme events, and some of the reasons for the changes are well understood. Warming increases the likelihood of extremely hot days and nights, favors increased atmospheric moisture that may result in more frequent heavy rainfall and snowfall, and leads to evaporation that can exacerbate droughts.
Even with evidence of these broad trends, scientists cautioned in the past that individual weather events couldn't be attributed to climate change. Now, with advances in understanding the climate science behind extreme events and the science of extreme event attribution, such blanket statements may not be accurate. The relatively young science of extreme event attribution seeks to tease out the influence of human-cause climate change from other factors, such as natural sources of variability like El Niño, as contributors to individual extreme events.
Event attribution can answer questions about how much climate change influenced the probability or intensity of a specific type of weather event. As event attribution capabilities improve, they could help inform choices about assessing and managing risk, and in guiding climate adaptation strategies. This report examines the current state of science of extreme weather attribution, and identifies ways to move the science forward to improve attribution capabilities.
BOOM!!! Direct hit!!! THAT'S what I'm talking about, guys!!! Thanks!!!
Hallo, this is my first post. I am Giancarlo Pace, ex- astronomer. I am spending some time checking some deniers' arguments. Most of them are easily debunked and do not deserve scientifical attention.
However, I did find something that still sounds reasonable to my non-expert ears. Bjorn Lomborg (who is not exactly a deniers but seems to be not too worried about climate change) shows in a video of a terrible youtube channel, a plot that seems to indicate that droughts are decreasing. Misteriously, he does not indicate the name of the authors of the paper, he says that it is a Nature paper of 2014. However, the paper exists: Hao et al. 2014
http://www.nature.com/articles/sdata20141
The paper does not state any decline in droughts, but actually their Figure 5 shows what definitely seems to be a decline in number of droughts since the 80s.
If you want to watch the video, here it is:
https://www.youtube.com/watch?v=3PWtaackIJU
I read here that collectively, the number of extreme weather events is declining, but I only get an insurance company as source. Do you have some scientific research on it?
Thanks a lot
I searched for some info on USS storm trends and how they relate to temperature change. But I couldn't find anything pertinent, so I decided to put together something myself that compares storm frequency to temperatures.
The NOAA Storm Database has records of "Thunderstorm Wind" events going back to the 1950s, so I downloaded the years 1975-2015 (380,026 events in total).
For temperature, I chose the NASA GISTEMP annual means for the Northern Hemisphere.
Here's the graph of storm counts and temperatures for the past 35 years, showing a strong correlation between the two (97.35%):
[RH] Adjusted image size. Please limit your images to 500px in width.
Some non-expert comments to Giancarlo and Terry, in lieu of a more informed response.
Giancarlo - yes, it'd surprise me a litle if increased drought hasn't been unambiguously detected, although it has been unambiguously projected. Would be interested to take that figure 5 in Hao up to present and see if the trend is positive yet. I find examples of projections in the USA in the National Climate Assessment, and in Cook, B. I., Ault, T. R. & Smerdon, J. E. Sci. Adv. 1, e1400082 (2015) covered here and here. Cook also detects extreme drought in the Levant. It does seem there has been differences of emphasis in the literature recently. Sheffield et al 'Little change in global drought over the past 60 years' seems like a downward estimate compared to the usual measure (PDSI) of past drought, and is put in context by John Holdren in an article reproduced on this site. He also refers to a summary in research by Schwalm et al that 'severity and incidence of climatic extremes, including drought, have increased'. Spinoni et al (2013) finds a small increase in each of global drought frequency, duration and severity from 1951-2010, but big regional variations that are disruptive.
Responding to Terry's graph, this is nice work, but I'm sure someone must looking at this professionally, who you may be able to contact. The increase in thunderstorms you show is so dramatic it must surely be an artefact, maybe of increased reporting? Secondly, a correlation between two time series each of which are increasing may well come to >90% (even more so if smoothed), but be misleading since both are dependent on time.
It strikes me that new measures may be useful for examining trends in 'extreme' weather rather than total weather, for example, maximum hourly rainfall, variance of rainfall, or collating data on water tables and aquifers. Not sure how realistic or expensive that would be.
How does Green-house-gas driven warming effect the diurnal temperature cycle and what impact would that be expected to have on weather?
My understanding is that one would expect night-time lows to rise more than day-time highs. I believe this has been observed and stated as evidence for AGW. Thus, the difference between daily highs and lows should actually be reduced by AGW, which in turn presumably would tend to moderate extreme weather events (winds and precipitation).
Of course, I'm not a weather expert, so I may be missing some important effect. For example, the changes in surface temperatures may be different from those at higher altitudes, driving cloud formation.
SemiChemE,
It is more complicated that just the change in diurnal temperature. The US Climate Change Assessment (from 2014) is the best source of scientific information about changes in the USA. If you are not from the USA, the information there will generally be similar to other parts of the world. Effects vary a lot from region to region.
The most consistent predictions are that heat waves, drought and flooding will increase. During the winter that means heavy snows (like they currently are having the the USA). Significant increases in heavy precipitation have been measured across the entire USA but are most pronounced in the North East where there has been a 70% increase in the heavist precipitation events. (Heavy precipitation = more floods). Hurricanes like Sandy are more common already. Indeed, Sandy was the latest hurricane in recorded history in the North East by several weeks. Record heat waves are already common.
It is unclear if the total number of Hurricanes will increase or decrease, but the strongest hurricanes are expected to be more common. Already hurricanes average about 15mph stronger than 50 years ago. Since the power of the wind goes up with the cube of the speed, 15 mph is a big effect. Some models suggest that the melting Greenland Ice sheet will cool off the North Atlantic so much that super storms start to occur. Hopefully those models will turn out to be incorrect.
We may get lucky and less diural difference means less extreme weather. Or we may not be lucky and more energy in the system means more and stronger storms. In either case we expect more floods and more drought. Meters of sea level rise are also a given. The question is how fast the sea level will rise. Don't buy land in Miami.
The report I cited is much less biased than I am. See what they say.
Watts Up With That is a site well known for misleading and outright false reports. If you want to understand the science be careful about who you trust on the internet. Scientists recommend Skeptical Science.
Weather extremes are often not a direct thermodynamically-driven consequence of increasing temperatures and humidity, but often indirectly driven by global warming via associated changes in the dynamics of weather systems. A prominent example is the projected poleward shift of the storm tracks under global warming scenarios (Ref. 1). The storm tracks are the accumulated footprint of the pathways of numerous extratropical cyclones, which then can cause, among others, extreme precipitation events. If the storm tracks shift poleward, storm frequencies change from one location to another. Storm intensities must be treated distinct from storm frequencies and their clustering.
One related example are weather fronts, along which most precipitation in an extratropical cyclone is formed. Forecasters may use slightly different definitions of what exactly a weather front is, but it is clear that extreme precipitation events (or hail) are often triggered ahead of cold fronts, due to the related forced vertical motion, for example during a hot summer day with high convective potential. It is known that the intensity of weather fronts scales with the precipitation during the following hours.
Consequently, changes in extreme events are often linked to changes in weather systems and related changes in their local frequencies and their intensities. This acts as an additional dynamical driver of changes in extreme weather, in tandem with the more direct thermodynamic change, i.e., the increase in the atmosphere's water holding capacity, due to global warming. Trends in the frequency of weather fronts and their intensity changes are presented for example in Ref. 2.
Selected references:
(1) Chang, E. K. M., Y. Guo, and X. Xia (2012), CMIP5 multimodel ensemble projection of storm track change under global warming, J. Geophys. Res., 117, D23118, doi:10.1029/2012JD018578.
(2) Schemm, S., M. Sprenger, O. Martius, H. Wernli, and M. Zimmer (2017), Increase in the number of extremely strong fronts over Europe? A study based on ERA‐Interim reanalysis (1979–2014), Geophys. Res. Lett., 44, 553–561, doi:10.1002/2016GL071451.
[Nature Climate Change, V7, page 96 (2017): https://doi.org/10.1038/nclimate3218]
Please note: the basic version of this rebuttal has been updated on August 6, 2023 and now includes an "at a glance“ section at the top. To learn more about these updates and how you can help with evaluating their effectiveness, please check out the accompanying blog post @ https://sks.to/at-a-glance