


 Arguments


Has Arctic sea ice returned to normal?
What the science says...
| Select a level... |
 Basic
Basic
|
 Intermediate
| |||
|
Thick arctic sea ice is in rapid retreat. |
|||||
Climate Myth...
Arctic sea ice has recovered
"Those who have been following NSIDC and JAXA sea ice plots have noted that this has been an extraordinary year so far, with Arctic sea ice hitting the “normal” line on some datasets. ...
As of today, JAXA shows that we have more ice than any time on this date for the past 8 years of Aqua satellite measurement for this AMSRE dataset." (Anthony Watts, 22 April 2010)
At a glance
One of the great metrics of climate change, because it is easy to visualise, is sea-ice in the Arctic. Every year, the ice margins retreat in the northern summer, reaching a minimum extent some time in September. It then refreezes through the long, dark cold winter months, until its maximum extent is reached in March.
Arctic sea-ice has a seasonal component - so-called 'first year ice' - and the more perennial 'multi-year ice'. First-year ice is relatively thin - 30-40 centimetres is typical. Multi-year stuff is thicker - 2-4 metres and much of it is situated between the north coast of Greenland and the North Pole.
Most of the annual, seasonal decline in ice extent, observed by satellites for more than 40 years, is due to first-year ice melting: the more robust multi-year ice takes more energy to remove, but nevertheless it is in decline, too. Calculations of sea-ice volume reveal that trend.
How does sea-ice form? We all know the freezing temperature of saltwater is lower than that of freshwater, hence the spreading of rock salt on the roads on frosty winter nights. Similarly, the ocean temperature needs to fall below -1.8°C (28.8°F) for sea-ice to form. In the freezing season it starts freezing over once the upper 150 metres or so of the ocean are close to that temperature.
Melt varies a lot from one year to another. This should come as no surprise: sea-ice, being on an ocean, moves about a fair amount. Variations in ocean-currents are particularly important since if sea-ice can be 'exported' out of the Arctic, it enters what is basically a hostile environment, where it melts away to nothing. Incidentally, such floes are a lot smaller than icebergs like the one that famously destroyed the Titanic in April 1912. Such ice behemoths originate where glaciers 'calve' upon reaching the sea.
Weather is a highly variable driver of sea-ice melt. Prolonged strong winds from the right direction can cause mass-export of ice into warmer waters. Then again, winds from the south transport warm air over the Arctic Ocean, causing the melting to intensify. But they may also bring in extensive cloud-decks, blocking a lot of incoming Solar energy. No surprise then that melt seasons vary a lot from one season to another.
As in most things related to climate change, it's the multidecadal trend that is key and that is unequivocally downwards, both in terms of extent and volume. Sudden spurts of growth are interesting, as are record meltdowns such as that in 2012. But that's it. Trend is the critical bit. The data clearly show that since 2010, when the statement in the box above originated, eight out of the ten lowest Arctic sea-ice minima have occurred. The only two melt-seasons outside of that time-frame were in 2007 and 2008. For the big picture regarding Arctic sea-ice, ignore the noise from one year to the next and look at all the data. It's heading one way - down.
Please use this form to provide feedback about this new "At a glance" section. Read a more technical version below or dig deeper via the tabs above!
Further details
Discussions about the amount of sea ice in the Arctic often confuse two very different measures of how much ice there is. One measure is sea-ice extent which, as the name implies, is a measure of coverage of the ocean where ice covers 15% or more of the surface. It is a two-dimensional measurement; extent does not tell us how thick the ice is. The other measure of Arctic ice, using all three dimensions, is volume, the measure of how much ice there really is.
Sea-ice consists of first-year ice, which is thin, and older ice that has survived one or more melt seasons, so that it has accumulated volume. This thicker multi-year ice is particularly important because it makes up most of the volume of the sea-ice. Volume is also the important measure when it comes to climate change, because it is the volume of the ice – the sheer amount of the stuff – that science is concerned about, rather than how much of the sea is covered in a thin layer of ice*.
Over time, sea ice reflects the fast-changing circumstances of weather. It is driven principally by changes in surface temperature, forming and melting according to the seasons, the winds, cloud cover and ocean currents. In 2010, for example, sea ice extent recovered dramatically in March, only to melt again by May.
Because sea-ice is subject to such powerful short-term effects, we cannot conclude anything about the health of the ice from just a single year’s data. It is over multiple decades that an obvious trend emerges. According to the National Snow and Ice Data Center, the overall trend in Arctic sea-ice minimum extent from 1979 to 2022 is down - by 12.6 percent per decade, relative to the 1981 to 2010 average (fig. 1). The average loss of sea ice works out at about 78,500 square kilometres per year. That's like losing an area the size of the state of South Carolina or the country of Austria - every year!
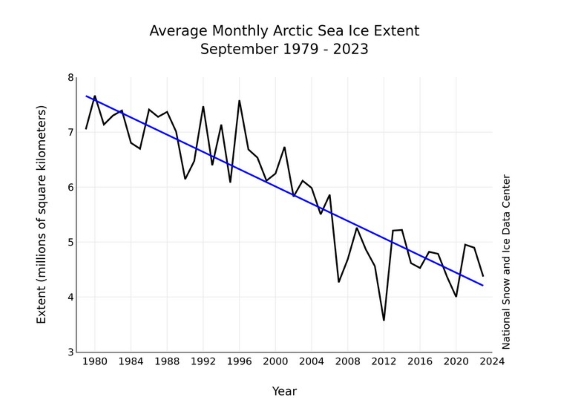
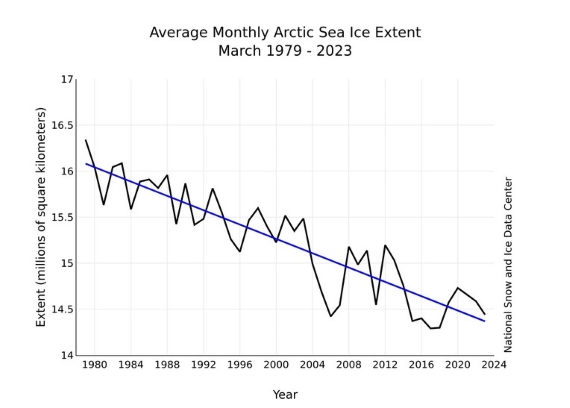
Fig. 1: Sea-ice extent in a) September, at the seasonal minimum (top panel) and b) March, at the annual maximum (bottom panel), for the period 1979-2023, . The trend is clear. Source: NSIDC
Multi-year ice volume is in steep decline. As you might imagine, thick ice takes a lot more heat to melt, so the fact that it is disappearing so fast is of great concern (fig. 2).
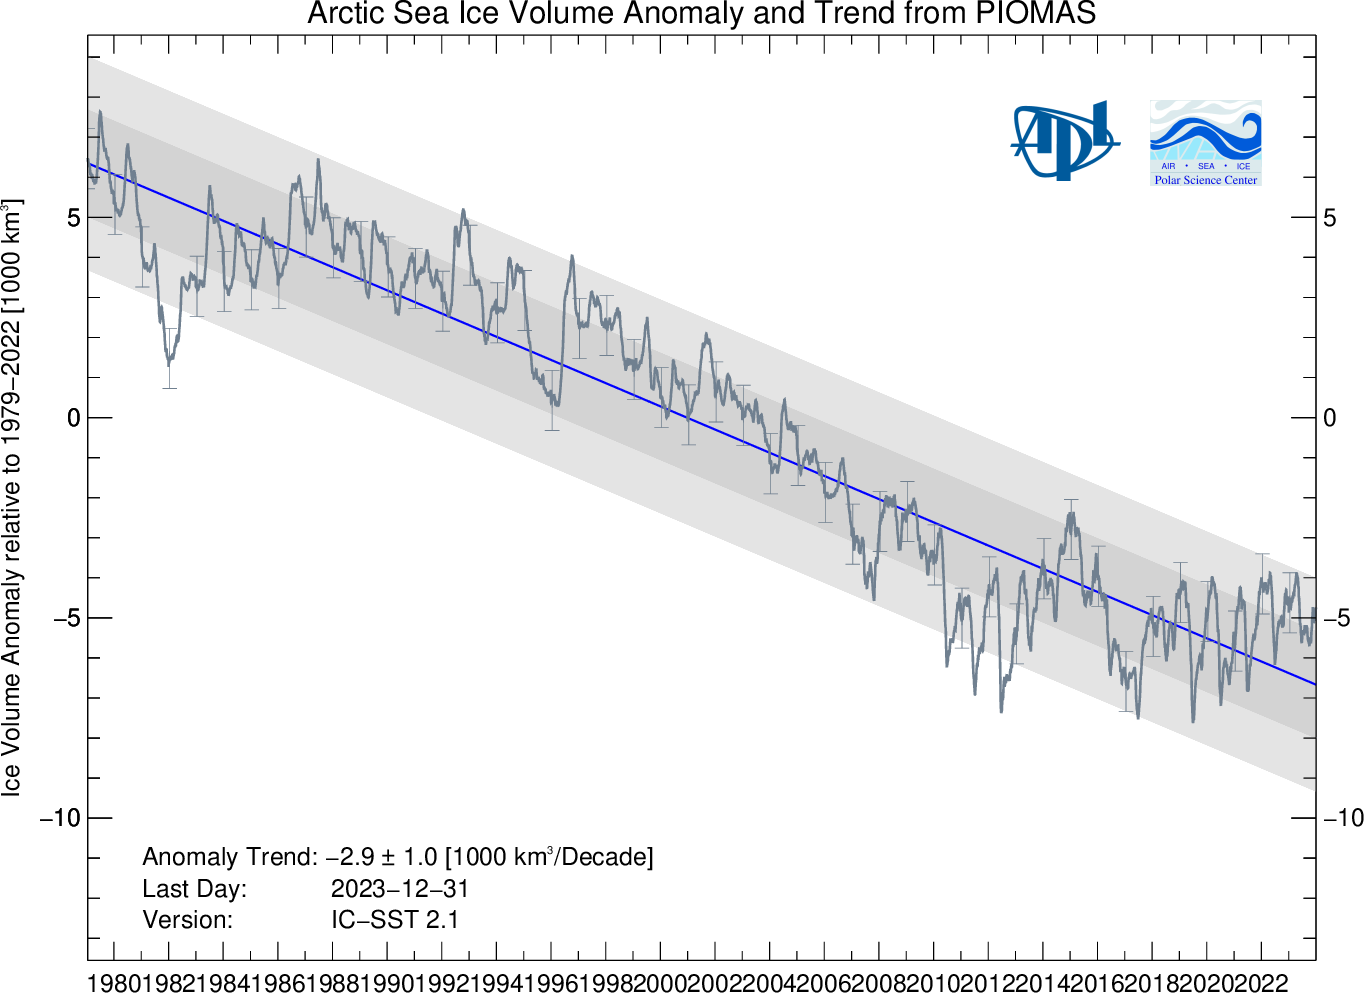
Fig. 2: Arctic sea-ice volume anomaly from PIOMAS. Daily sea-ice volume anomalies for each day, computed relative to the 1979 to 2022 average for that day of the year. Tick–marks on the time axis refer to the first day of each year. The trend for the period 1979- present is shown in blue. Shaded areas show one and two standard deviations from the trend. Error bars indicate the uncertainty of the monthly anomaly plotted once per year. Source: Polar Science Center, University of Washington.
It is clear from the various data sets, terrestrial and satellite, that both the sea ice extent and multi-year ice volume are reducing decade by decade. The full extent of annual ice reduction is seen in September of each year, at the end of the Arctic summer, and is on a long-term downward path. Multi-year ice volume has not recovered at all, and is showing a steeply negative multidecadal trend.
* Footnote: Although a thin layer of ice doesn’t tell us much about the overall state of ice loss at the Arctic, it does tell us a great deal about Albedo, the property of ice to reflect heat back into space. When the sea ice diminishes, more heat passes into the oceans. That heat melts the thick ice and speeds up the melting of thinner sea ice, which in turns allows more heat to accumulate in the oceans. This is an example of positive feedback.
Last updated on 4 February 2024 by John Mason. View Archives


I note that in the Footnote to this article it is stated that, " When the sea ice diminishes, more heat passes into the oceans." Science seems to be at odds with this statement. I think that the absence of explanation as to where the heat comes from that passes into the oceans can cause confusion. A layperson might argue that the reason for putting ice cubes in a drink is to cool the drink by removing heat from it that results in the ice cubes melting. Clearly, the heat passes from the drink to the ice cubes, yet it is stated that the analogous oceans have heat passing into them. The layperson is left to assume that this heat must come from the melting ice which is a conundrum.
@KAllan,
No. That's just the change in albedo. Ice reflects more sunlight, and water absorbs it instead.
To Michael Sweet
Excuse me Michael but I have a little problem with your logic. You said that a decade of relative stability is not enough to contredict the mathematical models. But you refer to the 70 years as a ''long term decline''. Excuse me, but 70 years, it's a blink of an eye compare to the climatologic history of the planet. It's a very short term. With all the datas on climatologic history of the earth, how can you be so convinced about the accuracy of the models? All in nature is related to cycle, oscillation, pulsation and variation. Linearity is pretty rare in nature and climatology is not an exception!
I was a believer (10 years ago), but now I have to admit that I'm Skeptical. Mainly because of the cyclic behavior of the earth. For me, the question is not to determine if climat change exhist, it does. The question is; What part the human activity is responsible of. In my point of view, just a few.
And with the actual low solar activities cycles, Arctic sea ice should continue to recover. But it's just my point of view!!!
[DB] "You said that a decade of relative stability is not enough to contredict the mathematical models"
Statistical significance testing shows that, for climate related changes, 17 years (Santer et al) are the bare minimum, with 30 years or more being typically used.
"70 years, it's a blink of an eye compare to the climatologic history of the planet. It's a very short term"
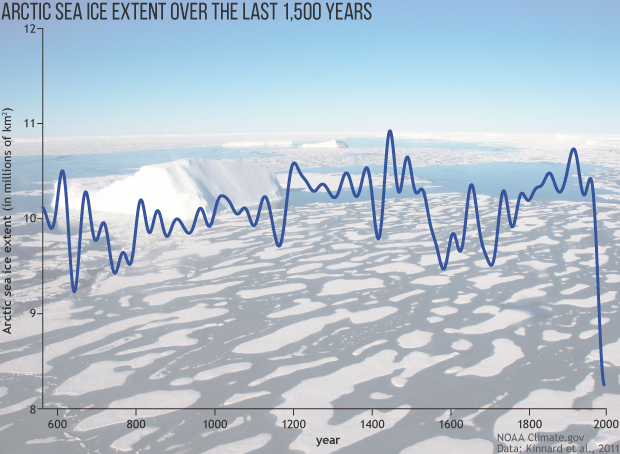
Here's over 1,450 years of Arctic Sea Ice Extent:
"the cyclic behavior of the earth"
The Earth's climate only changes in response to warming or cooling forcings. No known natural forcing fits the fingerprints of observed warming except anthropogenic greenhouse gases. See here for more.
"What part the human activity is responsible of"
All of the observed warming since 1950 is due to human activities. See here for more discussion.
Please keep your comments constructed to adhere to the topic of the post on which you place them. Thousands of posts exist. Use the Search function to find the best post on which to place your concerns. Thanks!
Lowisss13 @103 ,
you seem to be trying to pull Michael Sweet's leg.
You offer some vague fluffy rhetorical comments, but you offer nothing based on factual evidence & scientific understanding.
Perhaps you could start by showing the (alleged) significant reduction in solar activity [ TSI ] which you claim has caused a reduction in arctic temperatures and hence a long term "sea ice recovery".
Then demonstrate all the other factors which you say are proving all the scientists wrong. Or will you retreat into another dose of empty rhetoric?
Lowiss13,
If you read my post you will see that I spported my claims with actual data and links to scientific studies. Please provide links to data and scientific studies to support your ridiculous claims.
Lowisss13 "Arctic sea ice should continue to recover." In order to continue, it would have to start. There is absolutely no sign of a recovery on the NSIDC data. The trend over the satellite record is down for every month of the year. No recognizable sign of a reversal is visble in the data. The trend in ice volume in PIOMAS is even more pronounced. See applicable sites for reference.
Right now, NSIDC is showing over 500,000 sq.km below median, far below the interdecile range and below 2012 levels; interestingly, Antarctic sea ice is also quite low, close to a million square kilometers below median, with enormous missing chunks in the Weddell, Amundsen and Ross seas. Someone facetious could use a typical denier method and draw a line between the beginning of the record and the latest data point to show a tremendous decrease in Antarctic sea ice.
Perhaps Lowisss13 wants to use only a few years of Arctic data following the 2012 record low summer Arctic ice, which would be ironic following his remark that 70 years is a blink of an eye. A funny variation on the defunct "no warming since 1998" nonsense.
To substantiate my previous post, the trend for September Arctic sea ice, when the minimum extent takes place, is -12.8% per decade, plus/minus 2.3%. 2017 and 2018 were above the trend line but within, or very close to the margin, not significant. Not a single month has 5 or more consecutive years above the trend line, within the margin or not. The trends for summer months are the higest. There is no way to interpret any of this data as even a beginning recovery.
https://nsidc.org/data/seaice_index/compare_trends
WOW! You're all so agressive!!!
Please keep your mind open.
-Recovery is maybe not the right term to use at these point. In my eyes, the last decade is more a stabilisation on term of arctic sea ice extend. There is always an stabilisation before a change of slope in an oscillation.
psc.apl.uw.edu/wordpress/wp-content/uploads/schweiger/ice_volume/BPIOMASIceVolumeAnomalyCurrentV2.1.png
You all seem to see a strait line in the graphic of ''Arctic sea ice volume anomaly from PIOMAS''. For me it's a curve or rather the 1/4 of an oscillation.
Here's one source of reflection:
notrickszone.com/2017/03/02/new-paper-indicates-there-is-more-arctic-sea-ice-now-than-for-nearly-all-of-the-last-10000-years/
-Yes, 30 is the ''magic'' number in term of statistic. But considering the long climatic history of earth, we should consider a sample of 30 years, 30 centuries, 30 milleniums, etc. If you study the climat of the last century, 30 years is effectively more than sufficient. But the point is to determine what's the best gap of time to consider for climate variability.
-Solar activity is slowing and sunspot # 24 was smaller than expected. Now they have made a prediction for the next sunspot:
www.nature.com/articles/s41467-018-07690-0
Small Solar Activity variation can have huge effect on earth climate.
To me it's sound logical considering the size of the sun vs the size of the earth.
arxiv.org/ftp/arxiv/papers/0706/0706.3621.pdf
Co2 is certainly part of the climate change. But at what level?
[DB] Off-topic and baiting snipped. Note that Stein et al 2017 supports that the recent loss of Arctic sea ice extent is unusual in the context of the Holocene, and does not detract from the anthropogenic nature of the current warming and the ongoing losses from the Cryosphere.
If you wish to discuss other aspects of climate change, such as solar levels and/or CO2, numerous other, more appropriate threads exist here. Use the Search function to find a more appropriate thread to discuss those. Also, please review the Comments Policy and ensure that comments adhere to it. Thanks!
My remarks are entirely warranted. What's in your eyes is irrelevant, and most likely what you want to see. Proper statistical analysis is what allows to determine whether there is a stabilization, a recovery or a continued trend. There is no stabilization in the PIOMAS data, the period you are considering is too short to yield any trend without a margin of error so large that no information can be extracted. There are multiple periods in the data where there appears to be a stabilization, and even increases, but the trend remains, as it does in the temperature escalator. There is no sign of stabilization in the sea ice extent either. Having an open mind does not equate to fooling oneself with wishful thinking.
https://www.nature.com/articles/s41467-017-00552-1 is where the acutal Stein paper is located.
I'll elaborate on the Stein et al (2017) paper since it is relevant to Arctic sea ice. Lowisss13 did not refer to the paper itself but to a blog post about the paper. A few things are surpsising in the blog post. There is a graph of sea ice that I could not locate anywhere in the paper. The blog post mentions solar activity but the paper has very little about that, only a mention of obliquity in the conclusion section. It uses a fairly novel proxy analysis and ther eare inconsitencies with already existing work. The authors are very careful to qualify the scope of the results. They point to summer sea ice coverage in conditions significantly warmer than today and ascribe it to major differences in the AMOC, not solar activity.
Here is part of their conclusion:
"Finally, we have compared the Arctic sea ice conditions of the LIG and simulated future climate projections for 2100 and 2300, based on two different IPCC scenarios2, the RCP4.5 (583 ppm CO2eq) and the RCP6 (808 ppm CO2eq) (Fig. 8). Both scenarios show a severe reduction in sea ice coverage in the late summer, i.e., summer sea ice concentrations are significantly lower than those of the LIG. With increasing atmospheric CO2, however, the reduction of sea ice in the central Arctic Ocean is more rapid and disproportionately high in comparison to its margin. Whereas the mid-LIG summer sea ice concentrations were still around 60 to 75% in the central Arctic Ocean, but only around 20% or less along the Atlantic-Water influenced Barents Sea continental margin, nearly ice-free conditions might be reached in the entire Arctic Ocean in 2300. The number of ice-free summer months is increasing with higher atmospheric CO2. Under these high CO2 concentrations, the winter sea ice may start to melt as well (Fig. 8). Furthermore, the higher obliquity during the LIG (Supplementary Table 6) may suggest an insolation forcing during the LIG, whereas for the climate scenarios RCP4.5 and RCP6 the additional heat fluxes are induced by increased greenhouse gas concentrations in the atmosphere."
Not much ground for optimism there.
Philippe Chantreau: The graph in the blogpost Lowisss13 linked to:
seems to be derived from this graph from the Stein study (figure 6, rightmost):
https://onlinelibrary.wiley.com/doi/full/10.1002/jqs.2929
That blog also references two other studies which it claims contradict the NOAA finding: Yamamoto et al (2017) and Moffa-Sanchez & Hall(2017). The graphs the blogger uses are derived from Yamamoto (figure 8, pg 1121) and Moffa-Sanchez (figure 2) respectively.
In total these findings appear to cover the Chukchi Sea, East Siberian Sea and Eastern Labrador Sea and to be fair do seem to detail periods of the last 10k years when these areas had far less ice than today.
My question is rather simple: do these studies contradict the NOAA findings or are they easily explainable as regional variations consumed by a much greater overall trend?
I ask not as a skeptic but as someone who lacks the necessary expertise to interpret such studies with any degree of confidence.
[DB] Please limit image widths to 450.
Gsmakin @111 , readers such as myself would be grateful if you clarified the point that you are interested in.
The graph you posted ( of Holocene Sea-Ice Cover Variations ) is very broad-brush indeed. It runs up to 1950 A.D. [the paleo definition of "the Present" or Time Zero ] . . . and the last 500 years have such minimal detail, that it seems close to useless for assessing what is happening in modern times.
I am completely unsure of what the validity of its proxy estimate of sea-ice cover would be ~ but, assuming it is of some value, I do think it is interesting in that it demonstrates a lower level of cover during the warm period of the Holocene Maximum (roughly 5-10 thousand years Before Present). And that the known gradual global cooling since then (i.e. over the most recent 5 thousand years) is also reflected in a gradual increase in sea-ice cover. But that is entirely as might be expected. However, the relevant question (for this thread) is ~ what is the cover doing during the last 50-100 years, and especially in recent decades, during which the global surface temperature has soared upwards enormously [and is now higher than the Holocene Maximum].
It would be "passing strange" if the modern high temperatures were not causing more ice-melt, as a definite strong trend. (Doubtless you will also be aware that the arctic ice summer volume has decreased by about 70% in the past 40 years.)
For perspective, Arctic sea ice extent, from NOAA's 2017 Arctic Report Card, shows recent extents to be the lowest in the past 1,500 years. Not a surprise, as it also shows recent temperatures there to be the wamest in the past 1,500 years:
Interestingly, it also shows that the development of sea ice in the Arctic over 40 million years ago to be closely coupled with the fall in global atmospheric carbon dioxide concentrations and global temperatures (unsurprising, given that both are tightly intercorrelated over geologic time):
Given that actually reading Stein 2017 shows it to be in support of the anthropogenic nature of the current warming and the ongoing losses from the Cryosphere, especially WRT the Arctic and its diminishing sea ice, it's hard to give any credence to skeptics that misquote it.
Eclectic: Sure. Basically you have the NOAA graph posted in response to 103 which quite clearly depicts the terrific drop in the amount of Arctic sea iice over the past century and then you have Lowisss13's blogger pointing to various regional studies he claims contradict that finding. Since I figured some sort of sleight of hand was afoot i nosied around the studies themselves, found the original figures and found not one of them displayed the great cliff shown at the end of the NOAA graph. I then wondered why this should be the case.
I guess you've sufficiently answered my query by pointing out what the blogger didn't - that these studies end in 1950, thus missing the great bulk of the current warming trend.
Daniel Bailey - Those were indeed the findings i was familiar with and i do not doubt them but it's always worth examining the arguments of others to see if they hold any credence and if not, understand their weakness so others don't fall prey to them.
In this case the opposing arguments seem to be that although current ice loss looks huge to us it is actually a mere nothing when looked at over centuries and millenia. There are then displayed a variety of graphs depicting great hillocks from the past to little bumps in the present with a little arrow saying "you are here."
All this can get a bit confusing to a layman such as myself and although I try to educate myself I'm very grateful i can come to a site like this and be able to have my questions answered.
gsmakin @111,
You say:-
The graph set out data from a single location in the Chukchi Sea (73N,166W), the ARA2B-1A bore hole (labelled A1 on the maps set out in the paper). This is a location that was marked in Atlases as being permanently frozen, but not any more.
But note that the paper (Stein et al 2017) does set out that their findings of increased ice in the Chukchi Sea over the last 2ky are reflected by results from elsewhere in the Arctic.
But the assertion @115 which you attribute to "opposing arguments", that "although current ice loss looks huge to us it is actually a mere nothing when looked at over centuries and millenia", such an assertion seems to be saying that the Arctic had entirely ice-free summers during the Holocene Thermal Maximum. This was not so. Arctic summer ice was not greatly different to the situation of the early 21st century and probably more icy that we will be seeing in coming decades.
MA Rodger: Yeah, the first bit you quote is a summary of the locations from which the data across all three of the referenced papers was derived (Stein, Yamamoto and Moffa-Sanchez). Maybe I was overly broad.
As to the "opposing arguments" section I'm not here referring to the studies themselves but rather to the blogger's presentation and the manner in which he intends his audience to imbibe it. To quote from said blog:
"Further to NOAA’s claim that Arctic sea ice extent is at its lowest for at least 1500 years, Kenneth Richard highlighted three studies last year that show the claim to be bunkum."
The clear intention is to erode confidence in the NOAA findings by presenting a series of graphs which depict a "present" with much more arctic sea ice than at multiple points in the past (not just the Holocene Thermal Maximum). Presented in that way the author clearly seeks to reverse the alarm that the NOAA graph must surely cause by depicting its cliff face as a little kink in otherwise wildly undulating trend lines.
At least that's the way I saw it.
Gsmakin @117 ,
thank you for the link to "the blogger's presentation" [ = WUWT blog ] of 22 February 2018.
If you scroll down about halfway on the comments section there, you see an interchange between Nick Stokes and the guy who calls himself "Kenneth Richard" (who is a major propagandist at "No Tricks Zone"). Quite informative. Continue through to the final post, which is by Kristi Silber (who is also one of the handful of commenters worth reading on WUWT).
Gsmakin, I am unsure of your degree of familiarity with WUWT. My take on that blog, is that the usual articles are worth a quick glance (but are typically puerile propaganda spin) and the comments columns are mostly filled by posters who are (A) political extremists somewhere to the right of Genghis Khan, and/or (B) crackpots who maintain that CO2 has negligible effect on terrestrial climate, and/or (C) tinfoil-hat conspiracists.
~ So, please do not waste too much of your valuable time in detailed reading of the articles at WUWT . . . and as for the comments columns, best just to scroll down at high speed, but pausing to read anything by Nick Stokes, Steven Mosher, and Kristi Silber. (NB: up until recent times, the WUWT site allowed commenters to give each other a vote of thumbs-up or thumbs-down. It was highly noticeable, how the above three persons always received a heavy downvote ~ but with that system gone, the other commenters simply express their vitriol verbally . . . when they can spare time from berating the general science community.)
As for Kenneth Richard ~ oh what a blackened conscience he must have, from the persistent way his output is brimful of mendacities, doctorings, and misrepresentations. A propagandist, in the most pejorative sense. (To quote from Nick Stokes on 22 Feb 2019 there : "There is no truth in Kenneth Richard's misrepresentations" )
Looks like various blogger fear a "blue water" event in the arctic and are preparing their public for idea that it isnt bad, could be natural, no need to support any climate action.
Arctic ice volume has been trending upwards since 2012
https://ocean.dmi.dk/arctic/icecover_30y.uk.php
Albert @121,
I don't think it is true to say "Arctic ice volume has been trending upwards since 2012," certainly not on the basis of PIOMAS data. The 12-month averages (Apr-to-Mar, so bang up-to-date) run like this:-
2011 - 2012 ... ... 13.83 M sq km
2012 - 2013 ... ... 13.44 M sq km
2013 - 2014 ... ... 14.57 M sq km
2014 - 2015 ... ... 15.62 M sq km
2015 - 2016 ... ... 15.00 M sq km
2016 - 2017 ... ... 13.07 M sq km
2017 - 2018 ... ... 13.22 M sq km
2018 - 2019 ... ... 14.11 M sq km
2019 - 2020 ... ... 13.47 M sq km
2020 - 2021 ... ... 13.40 M sq km
2021 - 2022 ... ... 13.98 M sq km
2022 - 2023 ... ... 14.24 M sq km
And a regression through that lot, even starting 2012-13**, gives a negative (thus decreasing) trend although lacking statistical significance. The PIOMAS anomaly graph you link-to @120 is using the same data. Mind, you could get an upward trend (still statistically insignificant) for a different 12-year period (again Apr-Mar); 1982-93 +0.050M/y +/- 0.125M/y.
(**2012 to 22 -0.064M/y +/- 0.156M/y)
Albert @121, 122, 123,
I would be curious to learn what you believe explains the observed Arctic Sea Ice Mass changes since 2012.
In addition to MA Roger's clarification that Arctic Sea Ice volume is not 'trending up', the lack of statistically significant decline since 2012 needs to be considered along with other evidence like the continued significant decline of Antactic Ice Mass (NASA presentation here) and Greenland Ice Mass (ESSD Article here - see figure 4).
The lack of significant continued decline of Arctic Sea Ice Mass (volume) requires an explanation. But the explanation is unlikely to be that 'global warming impacts of human activity have not been significant since 2012'.
Albert @ 120 is doing an Arctic sea ice volume analysis using the standard "skeptic" analysis techniques that go into The Escalator: