


 Arguments


Has Arctic sea ice returned to normal?
What the science says...
| Select a level... |
 Basic
Basic
|
 Intermediate
| |||
|
Thick arctic sea ice is in rapid retreat. |
|||||
Climate Myth...
Arctic sea ice has recovered
"Those who have been following NSIDC and JAXA sea ice plots have noted that this has been an extraordinary year so far, with Arctic sea ice hitting the “normal” line on some datasets. ...
As of today, JAXA shows that we have more ice than any time on this date for the past 8 years of Aqua satellite measurement for this AMSRE dataset." (Anthony Watts, 22 April 2010)
At a glance
One of the great metrics of climate change, because it is easy to visualise, is sea-ice in the Arctic. Every year, the ice margins retreat in the northern summer, reaching a minimum extent some time in September. It then refreezes through the long, dark cold winter months, until its maximum extent is reached in March.
Arctic sea-ice has a seasonal component - so-called 'first year ice' - and the more perennial 'multi-year ice'. First-year ice is relatively thin - 30-40 centimetres is typical. Multi-year stuff is thicker - 2-4 metres and much of it is situated between the north coast of Greenland and the North Pole.
Most of the annual, seasonal decline in ice extent, observed by satellites for more than 40 years, is due to first-year ice melting: the more robust multi-year ice takes more energy to remove, but nevertheless it is in decline, too. Calculations of sea-ice volume reveal that trend.
How does sea-ice form? We all know the freezing temperature of saltwater is lower than that of freshwater, hence the spreading of rock salt on the roads on frosty winter nights. Similarly, the ocean temperature needs to fall below -1.8°C (28.8°F) for sea-ice to form. In the freezing season it starts freezing over once the upper 150 metres or so of the ocean are close to that temperature.
Melt varies a lot from one year to another. This should come as no surprise: sea-ice, being on an ocean, moves about a fair amount. Variations in ocean-currents are particularly important since if sea-ice can be 'exported' out of the Arctic, it enters what is basically a hostile environment, where it melts away to nothing. Incidentally, such floes are a lot smaller than icebergs like the one that famously destroyed the Titanic in April 1912. Such ice behemoths originate where glaciers 'calve' upon reaching the sea.
Weather is a highly variable driver of sea-ice melt. Prolonged strong winds from the right direction can cause mass-export of ice into warmer waters. Then again, winds from the south transport warm air over the Arctic Ocean, causing the melting to intensify. But they may also bring in extensive cloud-decks, blocking a lot of incoming Solar energy. No surprise then that melt seasons vary a lot from one season to another.
As in most things related to climate change, it's the multidecadal trend that is key and that is unequivocally downwards, both in terms of extent and volume. Sudden spurts of growth are interesting, as are record meltdowns such as that in 2012. But that's it. Trend is the critical bit. The data clearly show that since 2010, when the statement in the box above originated, eight out of the ten lowest Arctic sea-ice minima have occurred. The only two melt-seasons outside of that time-frame were in 2007 and 2008. For the big picture regarding Arctic sea-ice, ignore the noise from one year to the next and look at all the data. It's heading one way - down.
Please use this form to provide feedback about this new "At a glance" section. Read a more technical version below or dig deeper via the tabs above!
Further details
Discussions about the amount of sea ice in the Arctic often confuse two very different measures of how much ice there is. One measure is sea-ice extent which, as the name implies, is a measure of coverage of the ocean where ice covers 15% or more of the surface. It is a two-dimensional measurement; extent does not tell us how thick the ice is. The other measure of Arctic ice, using all three dimensions, is volume, the measure of how much ice there really is.
Sea-ice consists of first-year ice, which is thin, and older ice that has survived one or more melt seasons, so that it has accumulated volume. This thicker multi-year ice is particularly important because it makes up most of the volume of the sea-ice. Volume is also the important measure when it comes to climate change, because it is the volume of the ice – the sheer amount of the stuff – that science is concerned about, rather than how much of the sea is covered in a thin layer of ice*.
Over time, sea ice reflects the fast-changing circumstances of weather. It is driven principally by changes in surface temperature, forming and melting according to the seasons, the winds, cloud cover and ocean currents. In 2010, for example, sea ice extent recovered dramatically in March, only to melt again by May.
Because sea-ice is subject to such powerful short-term effects, we cannot conclude anything about the health of the ice from just a single year’s data. It is over multiple decades that an obvious trend emerges. According to the National Snow and Ice Data Center, the overall trend in Arctic sea-ice minimum extent from 1979 to 2022 is down - by 12.6 percent per decade, relative to the 1981 to 2010 average (fig. 1). The average loss of sea ice works out at about 78,500 square kilometres per year. That's like losing an area the size of the state of South Carolina or the country of Austria - every year!
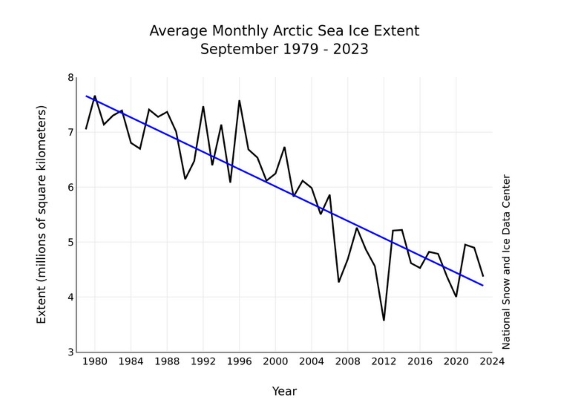
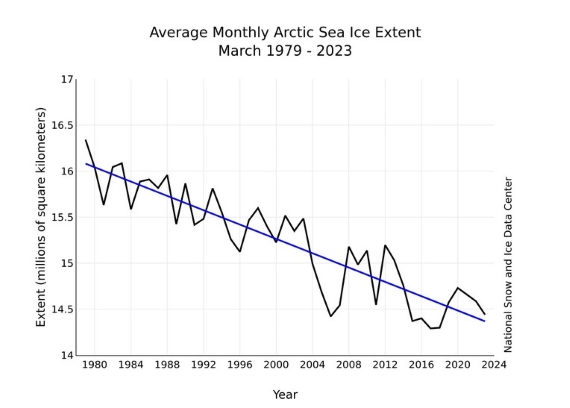
Fig. 1: Sea-ice extent in a) September, at the seasonal minimum (top panel) and b) March, at the annual maximum (bottom panel), for the period 1979-2023, . The trend is clear. Source: NSIDC
Multi-year ice volume is in steep decline. As you might imagine, thick ice takes a lot more heat to melt, so the fact that it is disappearing so fast is of great concern (fig. 2).
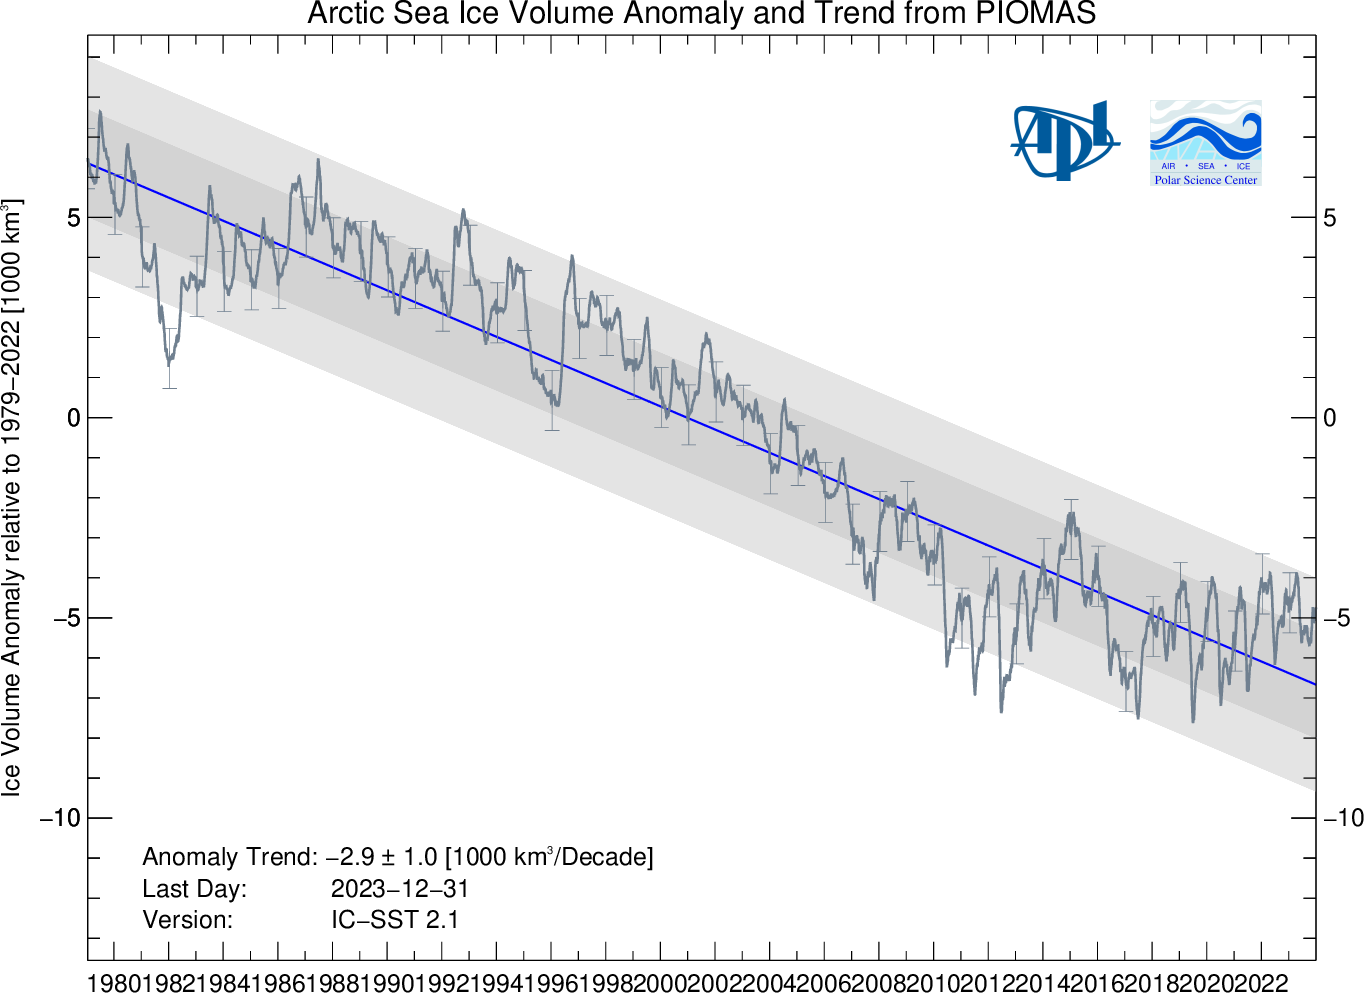
Fig. 2: Arctic sea-ice volume anomaly from PIOMAS. Daily sea-ice volume anomalies for each day, computed relative to the 1979 to 2022 average for that day of the year. Tick–marks on the time axis refer to the first day of each year. The trend for the period 1979- present is shown in blue. Shaded areas show one and two standard deviations from the trend. Error bars indicate the uncertainty of the monthly anomaly plotted once per year. Source: Polar Science Center, University of Washington.
It is clear from the various data sets, terrestrial and satellite, that both the sea ice extent and multi-year ice volume are reducing decade by decade. The full extent of annual ice reduction is seen in September of each year, at the end of the Arctic summer, and is on a long-term downward path. Multi-year ice volume has not recovered at all, and is showing a steeply negative multidecadal trend.
* Footnote: Although a thin layer of ice doesn’t tell us much about the overall state of ice loss at the Arctic, it does tell us a great deal about Albedo, the property of ice to reflect heat back into space. When the sea ice diminishes, more heat passes into the oceans. That heat melts the thick ice and speeds up the melting of thinner sea ice, which in turns allows more heat to accumulate in the oceans. This is an example of positive feedback.
Last updated on 4 February 2024 by John Mason. View Archives


Looking at the graph should indicate quite clearly that there is definitely no decline since 2012 and your tabulated data also clearly shows this.
Average Arctic ice extent has also plateaud since 2012 (SII) or 2006(MASIE).
If you look at yearly averages since 1979, Arctic ice has only reduced by about 15% and as I wrote above, all this was prior to 2012.
DMI, JAXA, Bremen uni, and others all say the same.
"i would be curious to learn what you believe explains the observed Arctic Sea Ice Mass changes since 2012."
My guess is the cyclic currents that bring warm waters to the Arctic have reached the top of their cycle and are changing to a cooler mode.
Evidence seems to suggest that the cycle is around 80 years and we know that Arctic ice extent was also low around 1940.
I have just written two posts which seem to have disappeared
[BL] Two posts from yesterday that contained "Arctic" and "Arctic ice" (and nothing else) were deleted yesterday. Nothing else of yours has been deleted.
i think the problem was that a new Page had started.
Albert... Do you have any idea how many decades deniers have been claiming that this is all just about to flip over into a cooling phase?
Heck, I (and others) even won a bet against the climate deniers at NoTricksZone on this.
Of course, their response was, "Okay, we lost the best but now it's going to really start cooling."
Albert @126,
What is the evidence for an 80 year cycle of warm waters being brought to the Arctic?
The NASA presentation of Arctic Sea Ice Extent from 1851 to 2017 does not show an 80 year cycle. It shows a fairly significant recent decline of extent of sea ice.
A better link for extent from 1850 is:
www.carbonbrief.org/guest-post-piecing-together-arctic-sea-ice-history-1850/ Same dataset
The pertinent graphic in scaddenp's link @131 cannot be 'hot' linked directly from CarbonBrief but it is available elsewhere online.
It does show the 1940's being as melty as say 1990 but there is no significant 80-year cycle to be seen. The more usual talk of 'cycle' is seen in Arctic temperature records but the same is also seen outside the Arctic and all across the northern hemisphere. GISTEMP zonal data suggests that up in the Arctic the 1940's were as warm as 2000 but the record 1880-on is not long enough to show the presence of any 80-year cycle. However the Berkeley Earth data for Svalbard dates back to 1800 but shows no sign of such a cycle.
And the assertion that in 2023 we are about to see the Arctic plunge back into some cold icy condition for decades is not born out by any SIE or SIV record. The future of Arctic SIE in a warming world may be one of 'difficult-to-reach' ice hanging on or it could be one of it 'going with a rush'. Take your pick. It will likely be a bit of both. But a reversal of recent declines in ice is no more than wishful thinking.
"The NASA presentation of Arctic Sea Ice Extent from 1851 to 2017 does not show an 80 year cycle. It shows a fairly significant recent decline of extent of sea ice."
there is an abundance of evidence from newspapers and other sources that Arctic ice extent in the 1940s was low. If i did provide the evidence I suspect that you would just ignore it.
But I will if you request it.
[BL] Don't bother. Newspapers are not a useful reference point, and this canard about ice in the 1940s has already been debunked on this thread:
https://skepticalscience.com/Arctic-sea-ice-loss-1940s.htm
You need to find some more reliable sources.
But no one has challenged the fact that Arctic ice thickness or extent has not dropped since 2012 and if you look at the University of Bremen, JAXA and MASIE, they say that Arctic ice extent has not decreased since 2006.
Check it out.
[BL] In the absence of an argument from you that short-term variations actually indicate a departure from long-term trends, there is nothing to challenge.
Albert @133/134,
Simply accepting anecdotal evidence from newspapers is not the way to determine historical Arctic ice conditions.
There are serious attempts to create records running back before the instrument era, like Walsh et al (2017) 'A database for depicting Arctic sea ice variations back to 1850' which is the subject of the CarbonBrief article linked @131 with the graphic @132. A little more recently there is Schweiger et al (2019) 'Arctic Sea Ice Volume Variability over 1901–2010: A Model-Based Reconstruction' which reaches similar conclusions, the graphic below from that paper showing rolling annual averages of Arctic SIV and annual red dots.
I would suggest you read the comment @123 if you feel that "no one has challenged the fact that Arctic ice thickness or extent has not dropped since 2012." And I do look at JAXA data and it evidently has "decreased since 2006" in that the JAXA annual average SIE 2006-22 has a linear trend of -0.032M sq km/y, a smaller decline than for the earlier part of the record (-0.51Msq km/y) but still a decline. So it has "dropped."
Albert... Again, this is a great opportunity for a bet. I'd bet you, in 10 years, the decadal average (pick your ice metric) will be lower than the current decadal average.
Remember... Cooling is going to start right now! ;-)
"BL] In the absence of an argument from you that short-term variations actually indicate a departure from long-term trends, there is nothing to challenge."
You keep misinterpreting the point I am making is that Arctic ice thickness and volume stopped shrinking at least 11 years ago, I made no other claim.
What do you mean by a "long term trend"? the Satellite measuring of Arctic ice and global temperatures started in 1979 and we know that global temperatures reduced from about 1940 until the mid 1970s and we know that Arctic ice is sensitive to global temperature so it is logical to believe that Arctic was low in 1940.
I will find some evidence that scientists believed Arctic ice was low in 1940 but I suspect that even if I did, you wouldn't acknowledge it
[BL] Your claim that volume "stopped shrinking" is a claim that things have changed from a previous trend. To support that claim, you need to provide statistical analysis that the short-term data is not within the normal variation of that long-term trend. Simply asserting a claim over and over is not valid support.
Look at your own graph from your original comment, repeated here for convenience:
You do see how the data you presented drops from +7 to -7 over the past 40 years? You do see that the data over the past decade is within the error bars of that overall trend? You do understand the statistical importance of trends, error bars, etc?
You have also been previously pointed to a link that discusses the myth about low ice amounts in the 1940s. It is not logical to believe that ice was low in 1940 when evidence says that it was not.
linear trends have their uses but can be misleading and if the above trend had a 12 month filter, that would give a more realistic interpretation of Arctic ice trend.
the start and stop times of linear trends can heavily influence what a trend looks like and the assumption that Arctic ice is on a permanent downward spiral rather than cyclic is just speculation.
The end of summer Arctic ice has been predicted regularly since 2006 by the top Arctic experts but it never eventuates.
[BL] Your baseless assertion about predictions of the end of arctic summer ice needs to be backed up by specific references.
Albert @139... Would you like a quick tutorial on how to post images here?
I tried to insert a graphic from DMI showing Arctic ice extent from 1979 but without success.
https://ocean.dmi.dk/arctic/icecover_30y.uk.php
The URL shows a decline of about 15% from 1979 to about 2012 but unfortunately most warmists only refer to the minimum monthly values rather than all the data.
Its like only giving January rainfall totals instead of the yearly totals.
The graph above showing Arctic ice just shows reconstructions because there was no accurate way to measure total Arctic ice before satellites.
I could show you reconstructions showing significantly different trends but I know it would be a waste of time.
[BL] Link activated.
The web software here does not automatically create links. You can do this when posting a comment by selecting the "insert" tab, selecting the text you want to use for the link, and clicking on the icon that looks like a chain link. Add the URL in the dialog box.
As for your assertion that yearly totals should be looked at, not January (for rainfall) - if the goal of an analysis is to look at crop production in Australia, then January precip is probably much more informative than annual totals.
Any argument of "all the data" is usually bogus. For Arctic sea ice, you don't include seasonal ice cover in the tropics, either. You don't divide the ice area by total ocean area (or the area of the globe). Every scientific analysis requires the use of relevant data. You have not provided any argument as to the relevance of using annual totals.
As for offering to show "reconstructions showing significantly different trends", you fail if you do not show that the "significantly different" claim is supported by actual, real statistical analysis. You know: the kind of things that real scientists do.
Second tab says "insert." See the picture of the tree? Click that and... voila!
Your problem is that you need to have a direct link to the image, not just the page. Right click the image (control+click on a Mac), then select open the image in a new tab. Use that URL.
Also, be sure to check the image size on the "appearance" tab. Make sure to restrict the image to 500px width.
I'll note that all the trend lines in both these graphs are showing ice loss. Anything on shorter scales, up or down, is merely noise.
finally managed to insert it.
if you look at average extents, it can be seen that from about 2007 the trend has probably plateaued.
if satellites had been operating from 1940, the downward trend would be Far less.
The most accurate extent measuring satellite is MASIE which measures in 16km2 blocks rather than the 225km2 blocks of SII and it shows Arctic extent plateauing from 2006.
From memory I think JAXA and the University of Bremen have the plateau starting even earlier.
[BL] Here we see the effects of confirmation bias plus overconfidence in one's opinions. In spite of earlier saying "there was no accurate way to measure total Arctic ice before satellites." as a way of rejecting data covering the 1940 period that he does not like, Albert is now asserting his confident opinion that if such data existed, he knows what it would show.
And again he inserts "has probably plateaued" instead of actually doing any sort of real statistical analysis.
I expect Albert has also not noticed that the Arctic Ocean is surrounded by land, which severely limits the winter maximum ice extent. There are well-understood reasons why winter extent does not show as much variation as summer extent. But as long as Albert can average away the strong decline in summer extent - which disagrees with his confirmation bias - then averaging it will be!
Thanks for the insert advice, it was driving me bananas.
"The graph above showing Arctic ice just shows reconstructions because there was no accurate way to measure total Arctic ice before satellites."
Oh ye of little faith is the cleverness of smart researchers.
Kinnard et al. (2011)
"...the trend has probably plateaued."
And that is what we call a baseless assertion.
The Kinnard has Arctic ice extent increasing from about 750 to 1500 which is an absurdity. Vikings colonised Greenland about 980 and farmed some areas that today are permafrost.
But the graph shows 980 ice extent to be about the same as 1700 and by that time the areas farmed were permafrost.
The graph shows ice extent dropping dramatically from about 1400 but the little ice age was ramping up in 1400, not down.
The graph shows ice extent increasing dramatically from about 1600 but the LIA peaked around 1650-1700 and temperatures have risen sporadically ever since. The Central England Temperature database correlates well with this.
Here is a different reconstruction that shows 1940 Arctic ice to be about the same as
[LINK]
See figure 1b
But the guy was italian and what would they know? See, I can be sarcastic as well.
[BL]Link breaking page formatting shortened.
Your Greenland myth is covered in this post.
You have already been pointed to places where your poor understanding of the Medieval Warm Period is covered.
You can correct your misunderstandings about the Little Ice Age by reading this post.
The Van Achter reconstruction that you show uses climate model data fitted to recent sea ice data to extrapolate values into the past and future. They also state "The Canadian Archipelago region was removed from the dataset since SIT reaches unrealistic values in this area." They also state "For the variability analysis, the trend and seasonal cycle are removed from the time series (pan-Arctic SIV and gridded SIT)".
Have you considered how this selection of data might influence the result? The authors have. In their conclusions, they state:
This analysis of the Arctic SIT and SIV variability bears some limits. Indeed, our results for the temporal and spatial patterns of variability are based on only one model, and despite the use of 30 ensemble members and a reasonable validation against observations, the model is not perfect. Furthermore, the spatial modes of SIT variability are robust for all the 30 ensemble members, but the temporal analysis shows some dissimilarities between members. Other studies with other model outputs are therefore needed to confirm our conclusion.
Given that you reject climate models entirely, I am surprised that you would be so convinced that a reconstruction based on one is the most reliable indicator of past sea ice conditions.
I do look at JAXA data and it evidently has "decreased since 2006" in that the JAXA annual average SIE 2006-22 has a linear trend of -0.032M sq km/y"
I was wrong, if you start from 2003 instead you will see that JAXA data linear trend shows 0 change.
[BL] So, to make your point, you start looking for outliers and cherry picking certain times to get the result you want? Classic use of the techniques illustrated in The Escalator (updated version).