Climate Science Glossary

Term Lookup

Enter a term in the search box to find its definition.

Settings

Use the controls in the far right panel to increase or decrease the number of terms automatically displayed (or to completely turn that feature off).

Term Lookup

Settings


All IPCC definitions taken from Climate Change 2007: The Physical Science Basis. Working Group I Contribution to the Fourth Assessment Report of the Intergovernmental Panel on Climate Change, Annex I, Glossary, pp. 941-954. Cambridge University Press.

Home Arguments Software Resources Comments The Consensus Project Translations About Support

Twitter Facebook YouTube Mastodon MeWe

RSS Posts RSS Comments Email Subscribe


Climate's changed before
It's the sun
It's not bad
There is no consensus
It's cooling
Models are unreliable
Temp record is unreliable
Animals and plants can adapt
It hasn't warmed since 1998
Antarctica is gaining ice
View All Arguments...


Username
Password
New? Register here
Forgot your password?

Latest Posts

Archives

What evidence is there for the hockey stick?

What the science says...

Select a level... Basic Intermediate

Recent studies agree that recent global temperatures are unprecedented in the last 1000 years.

Climate Myth...

Hockey stick is broken

“In 2003 Professor McKitrick teamed with a Canadian engineer, Steve McIntyre, in attempting to replicate the chart and finally debunked it as statistical nonsense.  They revealed how the chart was derived from "collation errors, unjustified truncation or extrapolation of source data, obsolete data, incorrect principal component calculations, geographical mislocations and other serious defects" -- substantially affecting the temperature index.” (John McLaughlin)

At a glance

The Hockey Stick is a historic graph dating back to a paper published in 1999. It showed Northern Hemisphere temperature variations over the near-thousand year period from 1000-1998. The 'blade' of the stick represented the rapid warming of the late 20th Century. It has an iconic status, both in climate science and in the murky world of science-misinformation, where, naturally, it is despised by all and sundry.

Objections to the Hockey Stick are varied but mostly focussed on the stick's long handle and the data that represents. Obviously, during the centuries going back to 1000, reliable temperature measurements are not available. Fortunately for science, there are things that lived through that long time, such as certain very old trees. They record in the rings of their wood an indication of temperatures, year on year. Gardeners and farmers talk about good and bad growing years and it’s the same for natural systems. For example, cold dry periods make for narrow and densely-packed tree-rings whereas warmer, wetter times lead to more widely-spaced ones.

Importantly, today there are a great many effective past climate indicators, known as proxies because they act in place of thermometers. Because there's a range of indicators, the results from each one can be cross-checked against one another. If a new proxy is any good, its data should agree with that from the other, established ones.

Proxy datasets contain more uncertainty than directly measured temperatures. Everyone knows that. That does not mean they are useless, far from it. Cross-checking means poor data can readily be identified and investigated.

Finally, it's 24 years since the Hockey Stick graph was published. Since then, work on developing and refining the best proxies has been relentless. Better, longer temperature reconstructions have become possible. At the same time, global temperatures have continued to rise. In any of the observation-based records of surface temperature, all of the eight warmest years have been since 2015.

Please use this form to provide feedback about this new "At a glance" section, which was updated on May 27, 2023 to improve its readability. Read a more technical version below or dig deeper via the tabs above!


Further details

Reliable observational temperature records only go back so far in time – in the UK back to 1850 and in the USA to 1880, for example. So how do we find out about conditions going further back, hundreds, thousands or even millions of years into the past? We use proxies.

Proxies are things whose measurable properties are affected in certain, well-defined and understood ways by variations in temperature and other climatic parameters. Although the most well-known proxy work was undertaken by studying the rings of ancient trees, many other things have since shown usefulness in this field. They include data from ice-cores, marine and lake sediments and the fossils they contain, corals, mountain glaciers: as time goes by more and more things have shown themselves to be useful over a variety of time-spans. Armed with such tools, the paleoclimatologist can thereby reconstruct climatic conditions in ancient times, just as the paleontologist can reconstruct ancient ecosystems, from data preserved in the rocks.

By 1999, confidence in paleoclimate proxy data was sufficient to link these ancient records to modern observations and this was done in a famous paper by Michael Mann and colleagues (Mann et al. 1999), showing that global temperature gradually cooled over the last 1000 years, but then rose sharply, beginning in the 20th Century. The shape of the graph (Figure 1) therefore looked like a hockey stick lying flat on the ground with its blade pointing upwards.
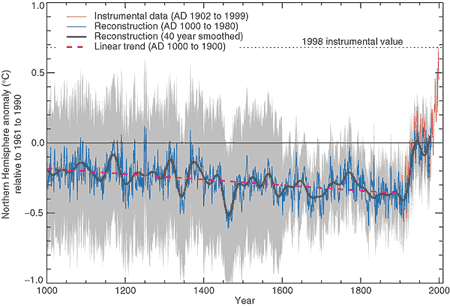

Figure 1: Northern Hemisphere temperature changes estimated from various proxy records shown in blue (Mann et al. 1999). Instrumental data shown in red. Note the large uncertainty (grey area) as you go further back in time.

Controversy, mostly of a manufactured nature, raged over the hockey-stick graph in the years following its publication: it became a symbolic focal point in the online 'climate-wars' that characterised the first two decades of the 21st Century, a time of often bitter battles and recriminations as misinformers attacked climate scientists in any way they could think of.

In the meantime, the expansion of things that were found to work as effective proxies continued apace, so that by the late 2010s we had learned a lot more about paleoclimate going right back through the glaciations and interglacials of the Quaternary and into the warmer late Cenozoic era. The paleoclimate record today stretches a long way back, through tens of millions of years.

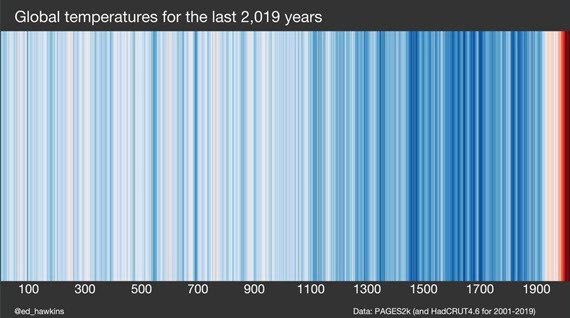
Back to shorter time-spans though, and another visually-catching graphic was recently created by climate scientist Ed Hawkins, using blues for colder years, reds for warmer ones and whites for near-average times. Known as “Warming Stripes'', the initial 2018 graph represented temperatures over the past 200 years, but a more recent version (Figure 2) uses a wide range of reliable proxy data from an international collaboration of scientists, called Past Global Changes 2K (PAGES2K), because it covers the past 2,000 years.
Warming Stripes past 2000 years

Figure 2: Warming Stripes based on PAGES2k (and HadCRUT4.6 for 2001-2019). Source: Ed Hawkins' Climate Lab Book

Warming Stripes is a visually striking graphic due in large part to its simplicity. It's like the Hockey Stick but with 20 years more scientific progress included. But like the Hockey Stick, it confirms the original findings: that the rate of recent warming is very steep in contrast to anything in the past two millennia.

Of course, as one would entirely expect, some crude attempts have been made to doctor Warming Stripes, but they never stand up to the level of scrutiny that scientists apply to their datasets. A graphic circulated in 2019 is one such example. For some unknown reason, its author left off the period 2007-2019, despite the temperature data being readily available. Could it have been because the warmest years on record occurred during this period? You tell us.

Furthermore, an in-depth examination of the graphic in question in a CBS News article shows that in fact it had been put together by crude copying and pasting in Photoshop or a similar application, so badly in fact that the edges of the pasted sections are clearly visible standing out from the top of the graphic. Like all climate misinformation, it just doesn't stand up to scrutiny.

Last updated on 27 May 2023 by John Mason. View Archives

Printable Version  |  Offline PDF Version  |  Link to this page

Argument Feedback

Please use this form to let us know about suggested updates to this rebuttal.

Further reading

The National Academy of Science's summation of the various temperature proxies are available online at Surface Temperature Reconstructions for the Last 2,000 Years.

Tamino has an interesting blog post Not Alike where he compares the Moberg temperature reconstruction (one of the least hockey stick like reconstructions with a distinct Medieval Warm Period and Little Ice Age) to modern temperature trends. He finds modern temperatures are 0.53 deg.C hotter than medieval times and the modern warming rate is 64% greater than the fastest rate in medieval times.

The NOAA Paleoclimatology Reconstructions Network has made available paleo data for download including 92 high-resolution temperature records over the past 2+ millennia.

Denial101x video

Here is a related lecture-video from Denial101x - Making Sense of Climate Science Denial

Additional video from the MOOC

Interviews with  various experts

Comments

Prev  1  2  3  4  5  6  7  Next

Comments 101 to 125 out of 167:

  1. Jonathan - Not one of your references supports your assertions. The Ljungqvist data directly contradicts you, see the New temperature reconstruction thread. Current temperatures are higher than anything in the last millenium. From your second link, Oppo 2009, the abstract states - "Reconstructed SST was, however, within error of modern values from about ad 1000 to ad 1250, towards the end of the Medieval Warm Period. SSTs during the Little Ice Age (approximately ad 1550–1850) were variable, and approx 0.5 to 1 °C colder than modern values during the coldest intervals." (emphasis added) The Greenland GISP2 data is interesting, and very limited. See the entire discussion at Crux of a Core, multiple parts. Primarily, that is not a global record. Please - read the works you link to. Currently you appear to just be making stuff up.
  2. An error on my part in my last posting - the Oppo 2009 article states that SST's in the Indo-Pacific warm pool were similar to modern values. But please note that, as Rob Painting pointed out, the MWP was not uniform spatially: Portions of the world were fairly warm during the MWP, portions were much cooler. The global temperature was not as warm as present, and you are cherry-picking spot measurements.
  3. KR, All proxies could be considered cherry-picks, as we do not have a uniform global coverage. I do not know how you could possible make that statment recarding the Lundqvist paper, as it clearly states, "The highest average temperatures in the reconstruction are encountered in the mid to late tenth century," and "The temperature of the last two decades, however, is possibly higher than during any previous time in the past two millennia, although this is only seen in the instrumental temperature data and not in the multi-proxy reconstruction itself." Portions of the globe have cooled during the twentieth century, but that does not mean that global temperatures have decreased.
  4. Jonathon, the proxies in the Lundqvist paper do not include the last few decades. That the highest temperatures in the reconstruction are found in the 10th century does not mean that those were the highest temperatures over the last 2,000 years.
  5. Jonathan - There's a huge difference between single proxies (as you have presented) and looking at groups of proxies from multiple locations, as Ljungqvist and Mann have done. In the Ljungqvist paper he is speaking about the proxies, which don't extend directly to the present. So your argument about the last few decades amounts to claiming that proxy and instrumental data cannot be joined, despite overlap periods where they can be calibrated. I don't believe that's even remotely justifiable. Also note that, as stated in Ljungqvist 2010: "Our temperature reconstruction agrees well with the reconstructions by Moberg et al. (2005) and Mann et al. (2008) with regard to the amplitude of the variability as well as the timing of warm and cold periods, except for the period c. ad 300–800, despite significant differences in both data coverage and methodology." So - you're trying to use Ljungqvist, who agrees with Mann and Moberg, to argue against Mann and Moberg regarding the MWP??? That argument simply doesn't hold up.
  6. KR, The Lundqvist paper covers the period up to 1999, so it includes the warmest year in the instrument record. You need to read the paper (and your quotes) carefully. You are stating that timing and variability agree. However, the paper shows similar proxy temperatures at both the end of the 10th and 20th centuries. You also seem to contradict yourself in your first sentence about the Lundqvist paper to which I presented.
  7. Jonathon, #106 "The Lundqvist paper covers the period up to 1999, so it includes the warmest year in the instrument record." In some instrumental data sets you mean. And it doesn't however include the warmest decade (the last ten years). Also, the paper states, "The proxy reconstruction itself does not show such an unprecedented warming but we must consider that only a few records used in the reconstruction extend into the 1990s." The proxy data for the last decades of the study are weaker than the for the rest of it. The instrumental data trumps the proxy data for that time frame. Again, they concluded (with qualifications) that the decades since 1990 seem to be warmer than at any time during the last 2,000 years for the NH. The "highest temperature in the reconstruction" does not mean the highest temperature in the last 2,000 years. They are quite clear about that.
  8. "I think you have highlighted one of the difficulties in using proxy data. Roh234 showed that even recent proxies can result in opposite conclusions." No I didn't Jonathon (@ 95). I've highlighted how easy it is for those that wish to misrepresent the science to do so by selecting individual proxies that support a particular preconceived interpretation. Happily proper scientists continue to make considerable efforts to include as many verified proxies as possible to maximise the spatial coverage to allow assessment of at least hemispheric paleotemperature evolution on the millenial timescale. I'm sure you'd agree that it would be dumb to try to infer something about global or hemispheric temperatures from a single site in the Sargasso sea, particulalry when we have some rather good information that this is rather senstive to changes in the Meridonal overturning circulation that have no necessary relationship to global scale temperatures....
  9. 103, Jonathan,
    Portions of the globe have cooled during the twentieth century...
    Very, very false.
  10. 103, Jonathan, Oh, wait, if you go by Mann 2010 you're right. That teeny tiny little sliver of western South America has cooled fractionally, along with ocean off the coast of Antarctica. You're right. Any proxy would be a cherry pick if it doesn't include those two critical spots on the globe.
  11. Sphaerica, Over a longer time period, there are more areas. http://journals.ametsoc.org/doi/pdf/10.1175/JCLI3709.1 However, I do not think anyone would use just the data from the southern U.S. to from the conclusion that the globe has cooled. I echo your sentiments Chris about using a single site.
  12. #93, CBDunkerson, we appear to be talking about two different things. In my post 91 I demonstrated that the analogy that the "Yamal 12" (referring to 12 cores post 1988) are analogous to crack cocaine by pointing out the other data sets that were available with 30 or more cores during the same period. Divergence is a discrete phenomenon that causes some trees in some places to show slow growth due to non-temperature factors. But it is certainly not valid to claim that trees that don't show divergence (i.e. are not overtly impacted by those unknown factors) are sufficient for reconstructions "because we all know it has gotten warmer". The last part in quotes is ture, but the first part does not follow. It is equally possible that those faster growing trees are impacted positively by another unknown factor. The crux of the problemn with Briffa 2000 is not divergence but inadequate numbers of cores.
  13. Eric, Please follow this link. Note the date and time. Some of us prefer to live in the present, but to plan for the future, not just for ourselves but also for future generations. I'm disgusted that you chose to defend McIntyre's vitriolic and hateful comments-- and now seem to be trying to use them as a reason or "in" to challenge the dendro plaeo records. It seems to me that you agree with his propaganda on this file? Have you applied, as your moniker suggests, skepticism, or just one-sided skepticism like Pielke et al. do? Surely you aware of the multiple, paleo hockey sticks out there?
  14. 111, Jonathon, From your paper (emphasis mine):
    A notable feature of the observed trend map for the past century (Fig. 7a) is the pervasiveness of the warm- ing on the regional scale: almost all areas of the globe analyzed appeared to have warmed over the twentieth century. A few relatively small areas of cooling are seen, including a region south of Greenland and an- other covering the southeastern United States. The cooling trends in these regions generally do not appear to be statistically significant according to comparison with the control run 100-yr trends (Fig. 7b). On the other hand, the warming trends over much of the globe are statistically significant (compared to internal cli- mate variability) according to these tests.
  15. May I presume that you share my sentiments that no one would conclude that the Earth has cooled based on these areas?
  16. Albatross, I came to this thread to defend one McIntyre comment (singular). The other one brought up in the other thread was undefendable (Hansen refusing to debate Christy = Jihad). If you don't agree, then address my post 91 and explain why crack cocaine is not a good analogy for Briffa Yamal. Please explain why two other series in the peer reviewed literature that cover the same location were always passed up and Briffa Yamal was used in reconstructions instead.
  17. Eric, You did not look at the date and time did you? :) If you think it is OK for McIntyre liken paleo climate scientists to crack cocaine addicts, then by all means go ahead. You honestly think that it is perfectly OK for someone to use that kind of language in a scientific discussion. Got it. Maybe you ought to direct your questions to Dr. Briffa, but I would caution you that you are operating under the dangerous assumption that the information that you have been fed by Mr. McIntyre is accurate.
  18. Eric, no we're talking about the same thing. McIntyre's nonsensical argument about the '12 proxies' has been around for a few years. Seriously. 'Crack cocaine'? For PROXY temperature values since 1988? You do realize that we have these things called thermometers, right?
  19. Eric #112: Why do you waste your time with ancient, disproven arguments from McIntyre? I'll pick on one of your statements: "It is equally possible that those faster growing trees are impacted positively by another unknown factor." Sounds a lot like "unknown unknowns" to me. You're arguing that these trees agree with the instrumental/proxy record both recently and farther into the past millennium, yet you think there's a 50/50 chance that the trees are measuring the wrong thing but accidentally coming out with the right result? For that to be true, you need to believe two things: 1) that the trees measured past climate proxies well, yet broke down in the past 50 years, like the trees of the divergence problem. 2) that the trees which agree with the recent instrumental record have, within the last 50 years, picked up a new signal, not present in their palaeo records which drives their temperature record up very like the instrumental series. Or you could simply agree that these trees are succeeding in picking up the recent temperature series as they did with pre-1950 temperatures. In that way, the trees agree with many other independent proxy records as well as instrumental temperatures. It's hardly 'equally probable', that the trees have these two suspiciously coincident unknowns. It shows what you get if you take your information from McIntyre...
  20. Albatross the issue is not what Dr Briffa thinks or says now, the issue very narrow: whether anyone should have used the Briffa-Yamal series in building reconstructions between 2000 and 2009 when he finally released the raw data, when there were other series created with more data. CB, is there a thermometer in Yamal? Briffa used the HadCrut grid cell which is not remotely similar to most local instrument measurements (mostly flat in the last part of the 20th century). Even for that grid cell temperature, there are other better-correlated series. Skywatcher, "ancient" only because Briffa did not release his data for almost 10 years. A handful of trees matching up to a coarse grid cell is not a sign of agreement particularly when other series have a better match to local temperatures (not gridded) temperatures. My first two links in #91 both show that.
  21. Eric @120, "Skywatcher, "ancient" only because Briffa did not release his data for almost 10 years" SImply not true. You are, again, believing uncritically what Mr. McIntyre is feeding you. I could show you why you are wrong, but I would prefer that you be a true skeptic and discover the truth on this matter yourself. I'm saddened by this Eric, I used to consider you one of the more informed and reasonable "skeptics", but your actions of late have soured that.
  22. Albatross, looking at http://www.cru.uea.ac.uk/cru/people/briffa/qsr1999/qsrfig1.csv it has the series result only without any supporting data or metadata (e.g. # of trees). Here's the data released roughly 10 years later: http://www.cru.uea.ac.uk/cru/people/melvin/PhilTrans2008/YamalADring.raw Please let me know if I've missed something, but it seems cut and dry to me.
  23. Muon, it was Doug Cotton again. What's that his 6th or 7th fake identity?
    Response:

    [DB] Sorry guys.  Just fingered him & took action.

  24. Readers should note that Doug Cotton has been banned from commenting at SkS for repeated and deliberate violations of the comments policy. He continues violate the policy by posting under pseudonyms and has, I believe, his comments deleted as a result without any regard to their particular content. He is now claiming on his website that his posts are being deleted because we cannot refute his arguments. That is a lie. His arguments where considered fully and resoundingly rebutted previously on SkS as they also have on Science of Doom (where he has also been banned for repeated violation of comments policy). I note that there is no posting permitted on his website. By his logic that lack of permission to post an argument means the argument cannot be refuted, his refusal to allow comments is sufficient proof that his arguments have been refuted. Less facetiously, if anyone believes there is any credibility to Doug Cotton's arguments, by all means present them on an appropriate thread, and in compliance with the comments policy. I enjoy shooting sitting ducks.
  25. Ian Joliffe considers MBH98 to contain 'dubious statistics' and says of the use of decentred PCA: It is possible that there are good reasons for decentred PCA to be the technique of choice for some types of analyses and that it has some virtues that I have so far failed to grasp, but I remain sceptical. Is using a decentred PCA the norm in paleo reconstructions or was it just MBH98?
    Response: [JH] Please define "PCA". Thank you. [Sph] John, PCA is Principle Components Analysis, a statistical technique whereby components are isolated and prioritized.

Prev  1  2  3  4  5  6  7  Next

Post a Comment

Political, off-topic or ad hominem comments will be deleted. Comments Policy...

You need to be logged in to post a comment. Login via the left margin or if you're new, register here.

Link to this page


The Consensus Project Website

THE ESCALATOR

(free to republish)


© Copyright 2024 John Cook
Home | Translations | About Us | Privacy | Contact Us