


 Arguments


What evidence is there for the hockey stick?
What the science says...
| Select a level... |
 Basic
Basic
|
 Intermediate
| |||
|
Recent studies agree that recent global temperatures are unprecedented in the last 1000 years. |
|||||
Climate Myth...
Hockey stick is broken
“In 2003 Professor McKitrick teamed with a Canadian engineer, Steve McIntyre, in attempting to replicate the chart and finally debunked it as statistical nonsense. They revealed how the chart was derived from "collation errors, unjustified truncation or extrapolation of source data, obsolete data, incorrect principal component calculations, geographical mislocations and other serious defects" -- substantially affecting the temperature index.” (John McLaughlin)
At a glance
The Hockey Stick is a historic graph dating back to a paper published in 1999. It showed Northern Hemisphere temperature variations over the near-thousand year period from 1000-1998. The 'blade' of the stick represented the rapid warming of the late 20th Century. It has an iconic status, both in climate science and in the murky world of science-misinformation, where, naturally, it is despised by all and sundry.
Objections to the Hockey Stick are varied but mostly focussed on the stick's long handle and the data that represents. Obviously, during the centuries going back to 1000, reliable temperature measurements are not available. Fortunately for science, there are things that lived through that long time, such as certain very old trees. They record in the rings of their wood an indication of temperatures, year on year. Gardeners and farmers talk about good and bad growing years and it’s the same for natural systems. For example, cold dry periods make for narrow and densely-packed tree-rings whereas warmer, wetter times lead to more widely-spaced ones.
Importantly, today there are a great many effective past climate indicators, known as proxies because they act in place of thermometers. Because there's a range of indicators, the results from each one can be cross-checked against one another. If a new proxy is any good, its data should agree with that from the other, established ones.
Proxy datasets contain more uncertainty than directly measured temperatures. Everyone knows that. That does not mean they are useless, far from it. Cross-checking means poor data can readily be identified and investigated.
Finally, it's 24 years since the Hockey Stick graph was published. Since then, work on developing and refining the best proxies has been relentless. Better, longer temperature reconstructions have become possible. At the same time, global temperatures have continued to rise. In any of the observation-based records of surface temperature, all of the eight warmest years have been since 2015.
Please use this form to provide feedback about this new "At a glance" section, which was updated on May 27, 2023 to improve its readability. Read a more technical version below or dig deeper via the tabs above!
Further details
Reliable observational temperature records only go back so far in time – in the UK back to 1850 and in the USA to 1880, for example. So how do we find out about conditions going further back, hundreds, thousands or even millions of years into the past? We use proxies.
Proxies are things whose measurable properties are affected in certain, well-defined and understood ways by variations in temperature and other climatic parameters. Although the most well-known proxy work was undertaken by studying the rings of ancient trees, many other things have since shown usefulness in this field. They include data from ice-cores, marine and lake sediments and the fossils they contain, corals, mountain glaciers: as time goes by more and more things have shown themselves to be useful over a variety of time-spans. Armed with such tools, the paleoclimatologist can thereby reconstruct climatic conditions in ancient times, just as the paleontologist can reconstruct ancient ecosystems, from data preserved in the rocks.
By 1999, confidence in paleoclimate proxy data was sufficient to link these ancient records to modern observations and this was done in a famous paper by Michael Mann and colleagues (Mann et al. 1999), showing that global temperature gradually cooled over the last 1000 years, but then rose sharply, beginning in the 20th Century. The shape of the graph (Figure 1) therefore looked like a hockey stick lying flat on the ground with its blade pointing upwards.
Figure 1: Northern Hemisphere temperature changes estimated from various proxy records shown in blue (Mann et al. 1999). Instrumental data shown in red. Note the large uncertainty (grey area) as you go further back in time.
Controversy, mostly of a manufactured nature, raged over the hockey-stick graph in the years following its publication: it became a symbolic focal point in the online 'climate-wars' that characterised the first two decades of the 21st Century, a time of often bitter battles and recriminations as misinformers attacked climate scientists in any way they could think of.
In the meantime, the expansion of things that were found to work as effective proxies continued apace, so that by the late 2010s we had learned a lot more about paleoclimate going right back through the glaciations and interglacials of the Quaternary and into the warmer late Cenozoic era. The paleoclimate record today stretches a long way back, through tens of millions of years.
Back to shorter time-spans though, and another visually-catching graphic was recently created by climate scientist Ed Hawkins, using blues for colder years, reds for warmer ones and whites for near-average times. Known as “Warming Stripes'', the initial 2018 graph represented temperatures over the past 200 years, but a more recent version (Figure 2) uses a wide range of reliable proxy data from an international collaboration of scientists, called Past Global Changes 2K (PAGES2K), because it covers the past 2,000 years.
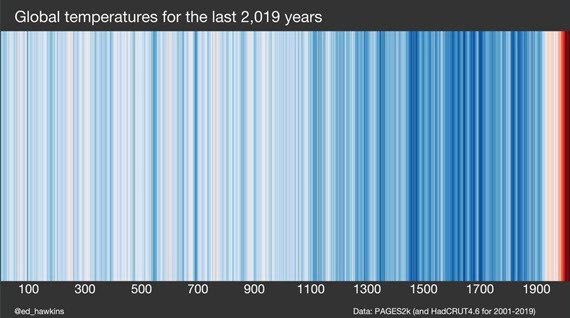
Figure 2: Warming Stripes based on PAGES2k (and HadCRUT4.6 for 2001-2019). Source: Ed Hawkins' Climate Lab Book
Warming Stripes is a visually striking graphic due in large part to its simplicity. It's like the Hockey Stick but with 20 years more scientific progress included. But like the Hockey Stick, it confirms the original findings: that the rate of recent warming is very steep in contrast to anything in the past two millennia.
Of course, as one would entirely expect, some crude attempts have been made to doctor Warming Stripes, but they never stand up to the level of scrutiny that scientists apply to their datasets. A graphic circulated in 2019 is one such example. For some unknown reason, its author left off the period 2007-2019, despite the temperature data being readily available. Could it have been because the warmest years on record occurred during this period? You tell us.
Furthermore, an in-depth examination of the graphic in question in a CBS News article shows that in fact it had been put together by crude copying and pasting in Photoshop or a similar application, so badly in fact that the edges of the pasted sections are clearly visible standing out from the top of the graphic. Like all climate misinformation, it just doesn't stand up to scrutiny.
Last updated on 27 May 2023 by John Mason. View Archives


Jim Milks compiled a list of three dozen replications of the hockey stick, and that's only up through 2013.
Hat tip to Jack Dale via David Appell.
David Appell is updating a list of all the hockey sticks anybody can find. He's asking for additions from anybody. It's over three dozen now.
This comment will start a bit off-topic and then quickly make its way back, I promise.
As an introduction, I posted a response to Dr. Richard Muller's response to the following question on Quora:
Why do people say "the science is settled" when it comes to climate change? Isn't the point of science that nothing is "settled?"
It may interest people to know that Dr. Muller basically rules that forum when it comes to questions about climate change impacts, and IMHO, he's running amok. I don't think it comes from the usual ideological motivators; rather, I think it's the hubris that physicists tend to get that leads them to distrust the work of any scientists other than physicists. That and maybe some misunderstanding with regard to philosophy of science. In any case, here's where I get back on topic.
In my response to Dr. Muller, I quoted Wikipedia to him, pointing out that he'd been wrong in his opinion piece about Dr. Mann's Hockey Stick.
The quote stated that subsequent analyses had refuted McIntyre and McKitrick and upheld Mann's paper; further, that the Hockey Stick has been replicated numerous times using other methods.
It's a bit lengthy, but I'd like to post his last response to this exchange in full, as I found it very interesting and troubling:
I'm curious what y'all's take on this is. It strikes me as, well, quite odd. I feel like, about the question of the use of the IPCC's uncertainty terminology, there's a deep misunderstanding here. Without having read much, I'm quite sure that climate research uses the same Frequentist standards that Dr. Muller is used to and that, if the IPCC is assessing likelihood based on a large number of such pieces of research, all of which purport to be showing statistically significant results, then in fact the IPCC is being even more conservative with its use of such terminology and not less.
I'm surpised he refers to M&M. Perhaps it is a different paper, but the one in which they intended to demonstrate that Mann's statistical methods generated hockey sticks was a fraud. They designed their algorithm to sort curves in such a way that the hockey stick shaped ones would come first, and then they showed only the top sample, which obviously happened to be hockey sticks. I believe there are links in this thread from a couple of years ago.
dvaytw @153.
Just reading Muller's comment @153, I feel Muller is being insincere. The NAS report (assuming this is the report in question) does echo IPCC AR5 Chapter 5 when it says:-
The only issue here is that Mann et al (1998) provided a 1,000 year proxy record not an 800 year record. To ignore this 800 year finding shows somebody playing with Ockkhams broom. But he is less than adept at sweeping things under carpets with such a broom because when he says "there was no evidence that the current temperature is the warmest in 1,000 years," he is plain wrong. There is evidence but it is not strong enough. The relevant part of IPCC AR5 is 5.3.5.1 which says:-
Thus all Muller's blather about 33% applies to hockey sticks longer than 800 years. He conveniently forgets to mention the "very likely" status of the 800 year hockey stick which in IPCC-speak means a greater than 90% liklihood but less than 99% (which would be classed "virtually certain" ). For longer 1,000 year hockey sticks there is evidence, it does point to recent temperatures being warmer but the evidence is not reliable enough to strongly support it.
MA Roger, I realize it's off-topic, but can you comment about my statement above that,
"I feel like, about the question of the use of the IPCC's uncertainty terminology, there's a deep misunderstanding here. Without having read much of it , I'm quite sure that climate research uses the same Frequentist standards that Dr. Muller is used to and that, if the IPCC is assessing likelihood based on a large number of such pieces of research, all of which purport to be showing statistically significant results, then in fact the IPCC is being even more conservative with its use of such terminology and not less."
With his big diatribe about statistical significance, Muller was ripping on my comment that if he's going to point out weak evidence for climate impacts on tornadoes and hurricanes, he should also point out the IPCC describes impacts on extreme drought, extreme precipitation and coastal flooding as "likely" and heat waves as "very likely". He equates the percentages for those terms as basically equalling "no evidence at all".
PS MA Rodger: the NAS report in question was actually this one:
http://www.nap.edu/read/11676/chapter/1
dvaytw - Dr. Muller seens to have the view that if he has not personally done the work, personally checked the evidence, then it is in doubt. And he will thus blithely dismiss solid work, take as gospel tripe like M&M, etc. So I would take his pronouncements with large blocks of salt.
The 2006 NAS report states in its conclusions:
So the work he signed off on indicates high confidence in the last 400 years, less confidence in the previous 600, and reasonable uncertainty about 1000 years and greater ago, based on the evidence available at that time.
In the intervening decade additional proxies have been located, producing work up to and including Marcott et al 2013, which concludes that recent temperatures represent a reversal of a cooling trend that started 5000 years ago, with current temps warmer than the mean temperatures over 82% of the Holocene (going back 11,500 years).
Muller's statements regarding paleotemperature reconstructions were reasonable a decade ago, but are now sadly out of date. And his assertions about MBH/M&M simply indicate that he hasn't looked into the M&M work - it's nonsense, multiply debunked, most notably by Wahl and Ammann 2007. M&M's failure to apply PCA selection rules alone invalidates the work, let alone their many other errors and misstatements. Muller is (once more) talking through his hat.
Also => List of large-scale temperature reconstructions of the last 2,000 years
I posted in a forum about the purpose of the "Hockey Stick" study and the fact that numerous proxy studies have been performed confirming the original hockey stick conclusion: that the 20th century is the warmest in the last 1000 years and that warming was most dramatic after 1920.
A denier swooped in and made this snarky comment and expects me to make a statement answering their question.
Which is immaterial and irrelevant.
State with specificity what the exact average global temperature should be now and the peer-reviewed science to support your conclusion.
I have no idea how to answer as I don't know what the current global temperature "should" currently be?
TVC15, the current global mean temperature for the Earth "should be" one dictated by the sum balance of forcings and feedbacks that drive temperatures. As those are not in balance due to human activities, the global mean temperature is increasing as a result. Global mean temperatures will continue to increase as long as temperatures are not in balance with forcings, which they are not, as long as the burning of fossil fuels continues as they are currently used.
Scientists have evaluated all natural forcings and factors capable of driving the Earth's climate to change and it is only when the anthropogenic forcing is included that the observed warming can be explained.
Natural vs Anthropogenic Climate Forcings, per the NCA4, Volume 2:
Scientists have quantified the warming caused by human activities since preindustrial times and compared that to natural temperature forcings.
Changes in the sun's output falling on the Earth from 1750-2011 are about 0.05 Watts/meter squared.
By comparison, human activities from 1750-2011 warm the Earth by about 2.83 Watts/meter squared (AR5, WG1, Chapter 8, section 8.3.2, p. 676).
What this means is that the warming driven by the GHGs coming from the human burning of fossil fuels since 1750 is over 50 times greater than the slight extra warming coming from the Sun itself over that same time interval.
@ 161 Daniel Bailey
Thank you so much for that great response and all the data!
TVC15 @160. Denier's statement: "State with specificity what the exact average global temperature should be now".
This is a common technique and it's a bit of a strawman argument. Scientists don't make any claims about what the "ideal" temperature "should be". There is no "perfect" temperature for the earth.
But, there are ideal temperatures for sustaining a global human civilization. We need stable temps to grow our food, we need stable sea levels to insure that our major cities are not inundated, etc, etc.
According to denialists Researchers Question Validity Of Some say it is meaningless to talk about a global temperature for Earth. The globe consists of a huge number of components which one cannot just add up and average.
Researchers Question Validity Of A 'Global Temperature'
Joris Geelen, their contention is ridiculous. Look up the definition of "average." To expand your knowledge, look up "central tendency" and how it complements "spread." Learn about additional statistics that can be used to further characterize a population. In short, read an elementary statistics textbook. For a specific rebuttal of that particular claim, see the Climate Feedback article. And if you really (?!) need more explanation, see the Rabbett Run post that has links to multiple detailed explanations.
Just joined and wanted to read background on hockey stick. I tried Mcintrye 2004, but it just goes to AGU home page. Is there a correct link?
Cheers
aJ
alisonjane @166,
The paper you found had the broken link in the OP is McIntyre & McKitrick (2005) 'Hockey sticks, principal components, and spurious significance'
Please note: the basic version of this rebuttal has been updated on Feb 14, 2023 and now includes an "at a glance“ section at the top. To learn more about these updates and how you can help with evaluating their effectiveness, please check out the accompanying blog post @
https://sks.to/at-a-glance
Thanks - the Skeptical Science Team.