


 Arguments


The Pacific Decadal Oscillation (PDO) is not causing global warming
What the science says...
| Select a level... |
 Basic
Basic
|
 Intermediate
|
 Advanced
| ||||
|
The PDO shows no trend, and therefore the PDO is not responsible for the trend of global warming. |
|||||||
Climate Myth...
It's Pacific Decadal Oscillation
"The Pacific Decadal Oscillation (PDO) is a temperature pattern in the Pacific Ocean that spends roughly 20-30 years in the cool phase or the warm phase. In 1905, PDO switched to a warm phase. In 1946, PDO switched to a cool phase. In 1977, PDO switched to a warm phase. In 1998, PDO showed a few cool years. Note that the cool phases seem to coincide with the periods of cooling (1946-1977) and the warm phases seem to coincide with periods of warming (1905-1946, 1977-1998)." (The Reference Frame)
At a glance
Oscillate. To move repeatedly from side to side or up and down between two points, or to vary between two states or amounts. To vary above and below a mean value. To move or travel back and forth between two points. To swing backward and forward like a pendulum.
These and similar definitions are to be found if you look up the meaning of 'oscillate' online. Yet global warming is wobbling its way up a one-way course. We've just witnessed the hottest year since temperature records began (2023). Every few years that record goes again. Conclusion: global warming is not an oscillation.
The Pacific Decadal Oscillation or PDO is one of a number of phenomena that affect the world's major oceanic basins. It is a good example of heat being moved around within the ocean and atmosphere. Like all climatic oscillations it has warm, neutral and cool modes and these may endure for years or decades. Oscillations like this do not correspond to a timetable, but are irregular in nature.
The PDO is directly driven by conditions in the northern Pacific but has considerable reach in its effects. Prevailing winds and atmospheric pressure-patterns over that ocean dictate the mode. When winds are predominantly from the southwest, warmer conditions occur along the western USA seaboard. That is due to the onshore transport of warm, subtropical waters. Conversely, when winds are mainly from the north, upwelling of cool and nutrient-rich waters occurs in the open ocean, with cooler conditions prevailing.
Notable long, warm modes of the PDO include 1925-1946 and 1977-1998. 1947-1976 was a lengthy cool phase. More recently, the flip-flopping has been of a much shorter duration with cold and warm phases lasting just a few years. The reason for this switch is incompletely understood.
Like the El Nino Southern Oscillation or ENSO, which flips around over annual timescales, the PDO affects weather patterns, particularly in Asia and North America. It also has considerable impacts on fisheries and if there was one good reason to understand the PDO, it's right there. However, despite the loose coincidence with global temperatures in the early and mid-20th Century, that apparent relationship is no more. For example, a negative PDO mode commenced at the end of 2019 and was still ongoing in mid-2023, the latter having been the warmest year globally since records began.
Like all oscillations, there is no net gain or loss of heat involved in the PDO. It is merely a pattern involving how the heat in the system is being moved around within it. Global warming is different because it involves impeding the loss of heat, originally reaching the planet as sunshine, back out to space. That makes it a climate forcing agent. Big difference.
Oscillate. It's all in the name.
Please use this form to provide feedback about this new "At a glance" section. Read a more technical version below or dig deeper via the tabs above!
Further details
The Pacific Decadal Oscillation (PDO) is a climate phenomenon that occurs primarily in the North Pacific Ocean. It has wide ranging effects on weather patterns, especially over North America and Asia. Like other ocean-basin oscillations, it has a warm mode, expressed as positive values in the PDO index, and a cool mode, with negative values. These modes last anywhere from a few years to multiple decades and feature changes in sea surface temperatures.
While the causes of the PDO are still poorly understood, the primary effects seem to be changes in northeast Pacific marine ecosystems and therefore fisheries. Also they affect the position of the jet stream's path, that may in turn impact agriculture.
During the PDO positive mode, winters in the southern and eastern US states tend to have above average temperatures and higher rainfall. In the western and north-western states, the opposite is the case. Asian winters tend to be cooler and dryer, although above normal temperatures and higher rainfall tend to occur over India.
In the negative PDO mode, warmer and drier winters occur through much of the contiguous USA, with cool conditions confined to the north-west, although parts of the central USA may see notably wet conditions. Over in Asia, India and China see relatively cool and wet winters, whilst Japan has both the warmth and the rainfall. Clearly, a key impact of the PDO is on agriculture, hence its extensive study and the substantial scientific literature surrounding it.
It is important to note, however, that the PDO modes are not set in stone. Frequently, especially in recent years, short sets of 1-5 warm years have occurred during a cool phase and vice-versa. In addition, the warm and cool modes are less descriptive than they would appear. The cool mode, for instance, is in fact associated with high sea surface temperatures in the Northern Pacific (Fig. 1). Another important point is that the hottest year in the global temperature record, 2023, has occurred within a negative PDO mode.
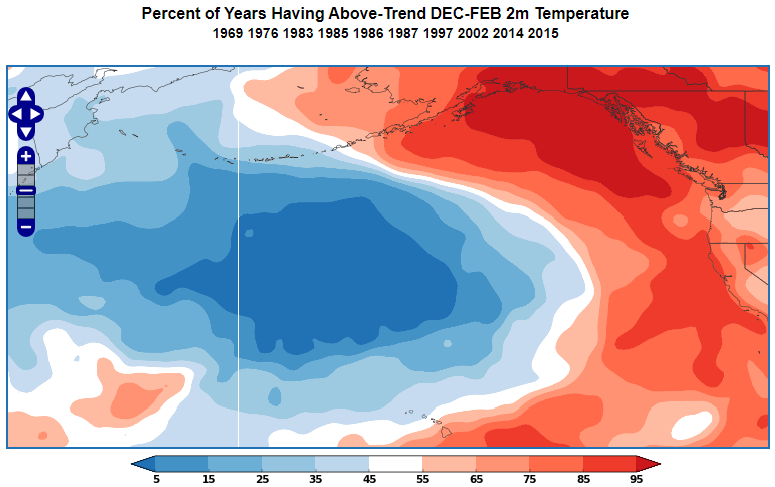
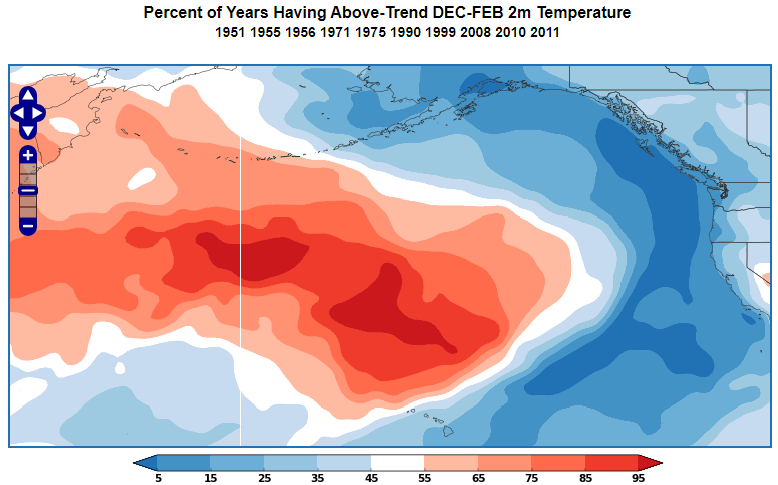
Figure 1: Examples of the PDO warm mode (above) and cool mode (below). During the positive PDO mode, sea surface temperature anomalies over the North Pacific Ocean form a vast cool area north of Hawaii. At the same time, warmer than normal waters are present near the North American coast. During negative PDO conditions, warm waters are found north of Hawaii and cooler than normal waters are encountered near the North American coast. Images courtesy of World Climate Service.
Because the PDO is an oscillation, it does not present a clear trend. If you compare the Global Temperature Anomaly alongside the PDO Index (fig. 2), you will see that although the PDO index appears to influence short-term temperature changes, global temperatures have had a distinct upward trend, especially since the late 1970s.
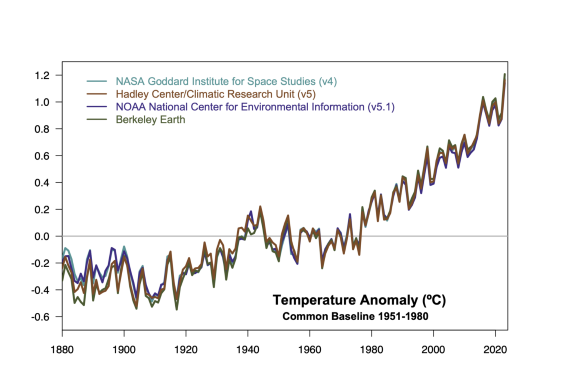
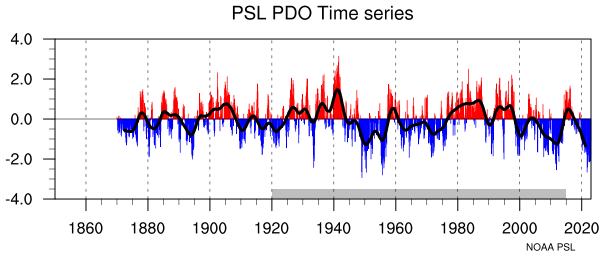
Figure 2: Top-panel: global temperature anomaly 1850-2023. Graphic: Realclimate. Bottom-panel: Pacific Decadal Oscillation index, 1870-2023. Smoothed data (thicker black line) included. Graphic: NOAA.
Natural oscillations like the PDO simply move heat around from oceans to air and vice-versa. They don't have the ability to either add or remove heat to or from the overall system. Therefore, they're not capable of causing a long-term warming trend like that of the last 50+ years. Instead they are another example of a process causing short- to medium-term temperature variations. Basically they're good examples of internal climate variability. If the PDO was responsible for warming the surface, the oceans would be cooling, which is not the case.
The long term warming trend on Earth is due to increasing greenhouse gas levels. These constitute an external radiative forcing, creating an energy imbalance. In contrast, the PDO is an internal process and does not increase or decrease the total energy in the climate system. Essentially, like other such oscillations, it cancels itself out. The fact that its name defines it as an oscillation should communicate that fact.
Last updated on 31 March 2024 by John Mason. View Archives


[DB] Perhaps this is relevant?
Recommended supplemental reading:
Going out for ice cream: a first date with the Pacific Decadal Oscillation by Tom Di Liberto, NOAA Climate.gov, Aug 25, 2016
"the 130-year near-linear trend is 0.6C / century"
The trend is certainly not near-linear since 1887.
As for why global warming is predicted to accelerate, see here.
[RH] Fixed image width. Please limit images to 500px.
Recommended supplemental reading...
A Pacific flip triggers the end of the recent slowdown, News Release, Met Office, Sep 18, 2017
Please note: the basic version of this rebuttal has been updated on March 31, 2024 and now includes an "at a glance“ section at the top. To learn more about these updates and how you can help with evaluating their effectiveness, please check out the accompanying blog post @ https://sks.to/at-a-glance