Climate Science Glossary

Term Lookup

Enter a term in the search box to find its definition.

Settings

Use the controls in the far right panel to increase or decrease the number of terms automatically displayed (or to completely turn that feature off).

Term Lookup

Settings


All IPCC definitions taken from Climate Change 2007: The Physical Science Basis. Working Group I Contribution to the Fourth Assessment Report of the Intergovernmental Panel on Climate Change, Annex I, Glossary, pp. 941-954. Cambridge University Press.

Home Arguments Software Resources Comments The Consensus Project Translations About Support

Bluesky Facebook LinkedIn Mastodon MeWe

Twitter YouTube RSS Posts RSS Comments Email Subscribe


Climate's changed before
It's the sun
It's not bad
There is no consensus
It's cooling
Models are unreliable
Temp record is unreliable
Animals and plants can adapt
It hasn't warmed since 1998
Antarctica is gaining ice
View All Arguments...


Username
Password
New? Register here
Forgot your password?

Latest Posts

Archives

Sun & climate: moving in opposite directions

What the science says...

Select a level... Basic Intermediate Advanced

The sun's energy has decreased since the 1980s but the Earth keeps warming faster than before.

Climate Myth...

It's the sun

"Over the past few hundred years, there has been a steady increase in the numbers of sunspots, at the time when the Earth has been getting warmer. The data suggests solar activity is influencing the global climate causing the world to get warmer." (BBC)

At a glance

Thankfully for us, our Sun is a very average kind of star. That means it behaves stably over billions of years, steadily consuming its hydrogen fuel in the nuclear reaction that produces sunshine.

Solar stability, along with the Greenhouse Effect, combine to give our planet a habitable range of surface temperatures. In contrast, less stable stars can vary a lot in their radiation output. That lack of stability can prevent life, as we know it, from evolving on any planets that might orbit such stars.

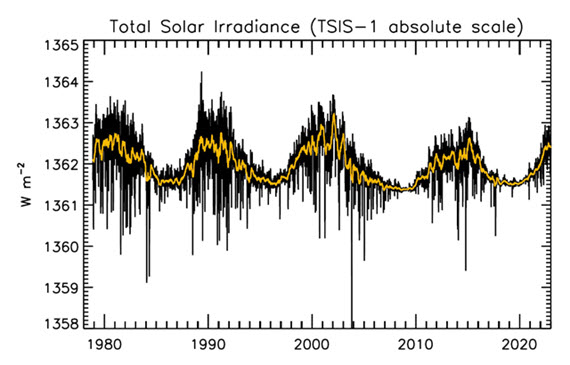
That the Sun is a stable type of star is clearly demonstrated by the amount of Solar energy reaching Earth's average orbital position: it varies very little at all. This quantity, called the Total Solar Irradiance, has been measured for around forty years with high accuracy by sensitive instruments aboard satellites. Its average value is 1,362 watts per square metre. Irradiance fluctuates by about a watt either way, depending on where we are within the 11-year long sunspot cycle. That's a variation of no more than 0.15%.

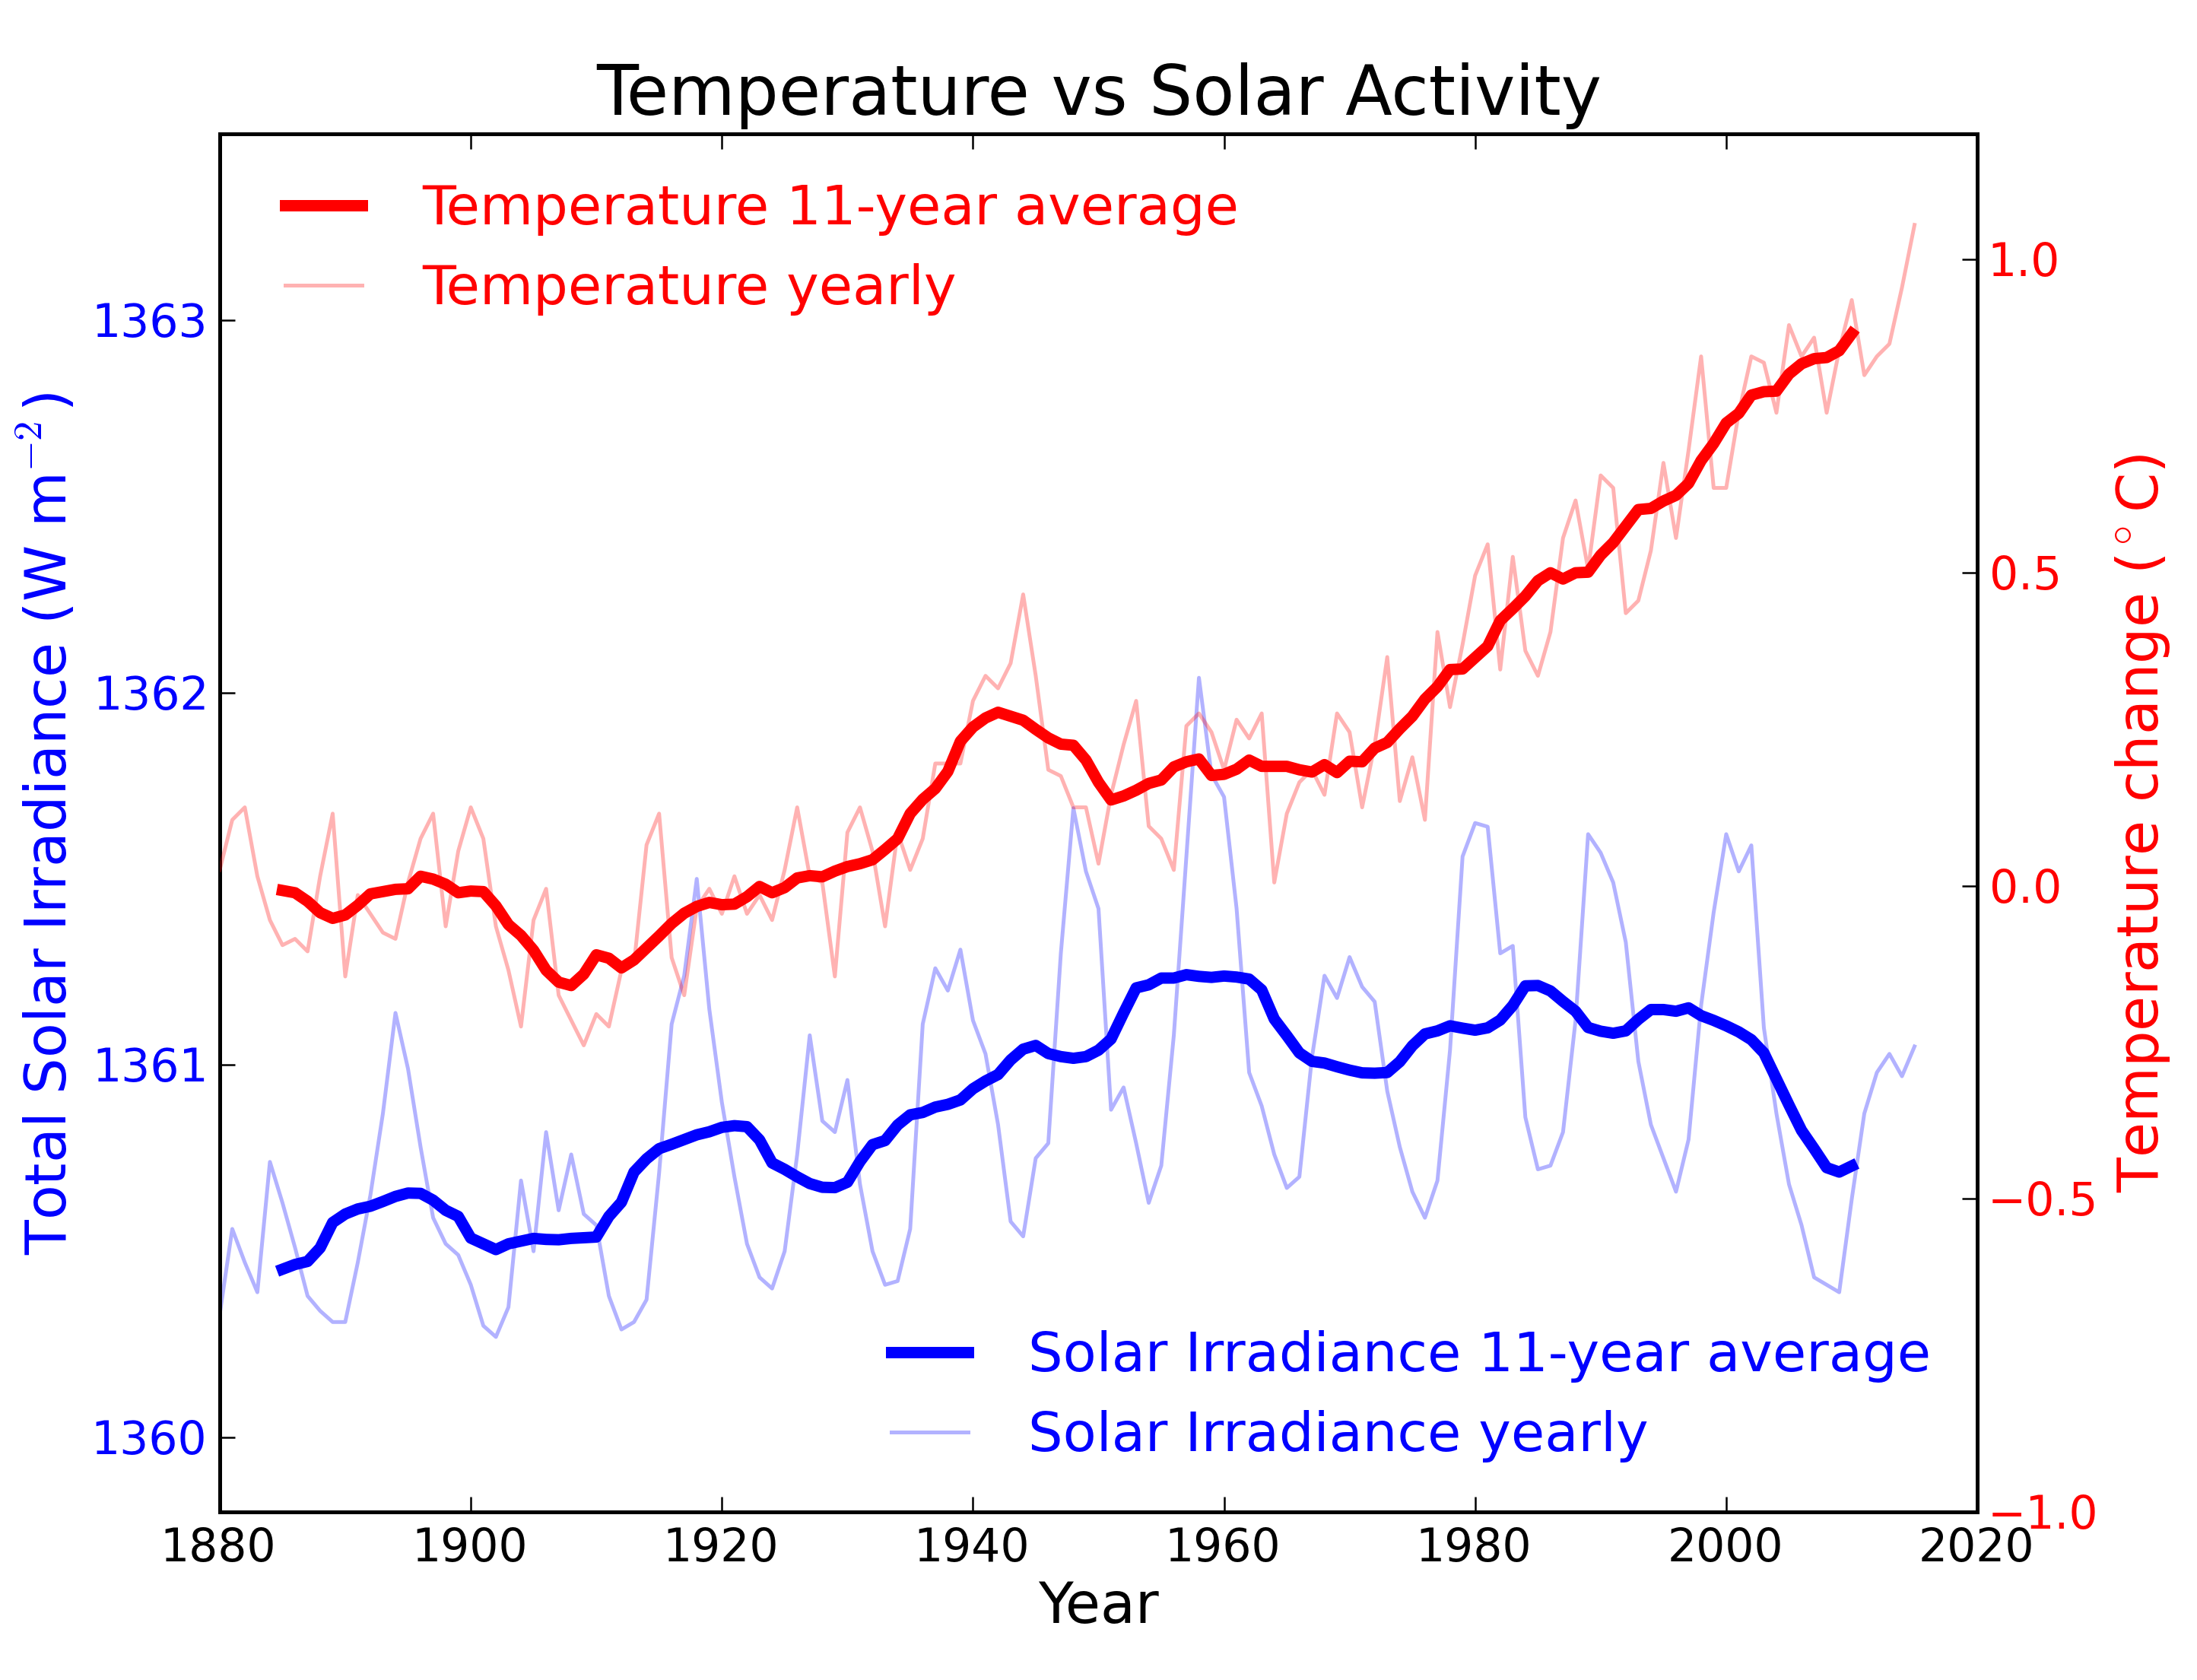
From the early 1970s until today, the Solar radiation reaching the top of Earth's atmosphere has in fact shown a very slight decline. Through that same period, global temperatures have continued to increase. The two data records, incoming Solar energy and global temperature, have diverged. That means they have gone in opposite directions. If incoming Solar energy has decreased while the Earth continues to warm up, the Sun cannot be the control-knob of that warming.

Attempts to blame the sun for the rise in global temperatures have had to involve taking the data but selecting only the time periods that support such an argument. The remaining parts of the information - showing that divergence - have had to be ditched. Proper science study requires that all the available data be considered, not just a part of it. This particular sin is known as “cherry-picking”.

Please use this form to provide feedback about this new "At a glance" section, which was updated on May 27, 2023 to improve its readability. Read a more technical version below or dig deeper via the tabs above!


Further details

Our Sun is an average-sized main sequence star that is steadily using its hydrogen fuel, situated some 150 million kilometres away from Earth. That distance was first determined (with a small error) by a time consuming and complex set of measurements in the late 1700s. It led to the first systemic considerations of Earth's climate by Joseph Fourier in the 1820s. Fourier's number-crunching led him to realise a planet of Earth's size situated that far from the Sun ought to be significantly colder than it was. He was thereby laying the foundation stone for the line of enquiry that led after a few decades to the discovery of what we now call the Greenhouse Effect – and the way that effect changes in intensity as a response to rising or falling levels of the various greenhouse gases.
TSI Solar cycles

Figure 1: Plot of the observational record (1979-2022) on the scale of the TSIS-1 instrument currently flying on the space station. In this plot, the different records are all cross calibrated to the TSIS-1 absolute scale (e.g., the TSIS1-absolute scale is 0.858 W/m^2 higher than the SORCE absolute scale) so the variability of TSI in this plot is considered to be its “true variability” (within cross calibration uncertainties). Image: Judith Lean.

The Sun has a strong magnetic field, but one that is constantly on the move, to the extent that around every 11 years or so, Solar polarity flips: north becomes south, until another 11 years has passed when it flips back again. These Solar Cycles affect what happens at the surface of the Sun, such as the sunspots caused by those magnetic fields. Each cycle starts at Solar Minimum with very few or no sunspots, then rises mid-cycle towards Solar Maximum, where sunspots are numerous, before falling back towards the end. The total radiation emitted by the Sun – total solar irradiance (TSI) is the technical term – essentially defined as the solar flux at the Earth's orbital radius, fluctuates through this 11-year cycle by up to 0.15% between maximum and minimum.

Such short term and small fluctuations in TSI do not have a strong long term influence on Earth's climate: they are not large enough and as it's a cycle, they essentially cancel one another out. Over the longer term, more sustained changes in TSI over centuries are more important. This is why such information is included, along with other natural and human-driven influences, when running climate models, to ask them, “what if?"

An examination of the past 1150 years found temperatures to have closely matched solar activity for much of that time (Usoskin et al. 2005). But also for much of that time, greenhouse gas concentrations hardly varied at all. This led the study to conclude, "...so that at least this most recent warming episode must have another source."
TSI vs. T
Figure 2: Annual global temperature change (thin light red) with 11 year moving average of temperature (thick dark red). Temperature from NASA GISS. Annual Total Solar Irradiance (thin light blue) with 11 year moving average of TSI (thick dark blue). TSI from 1880 to 1978 from Krivova et al. 2007. TSI from 1979 to 2015 from the World Radiation Center (see their PMOD index page for data updates). Plots of the most recent solar irradiance can be found at the Laboratory for Atmospheric and Space Physics LISIRD site.

The slight decline in Solar activity after 1975 was picked up through a number of independent measurements, so is definitely real. Over the last 45 years of global warming, Solar activity and global temperature have therefore been steadily diverging. In fact, an analysis of solar trends concluded that the sun has actually contributed a slight cooling influence into the mix that has driven global temperature through recent decades (Lockwood, 2008), but the massive increase in carbon-based greenhouse gases is the main forcing agent at present.

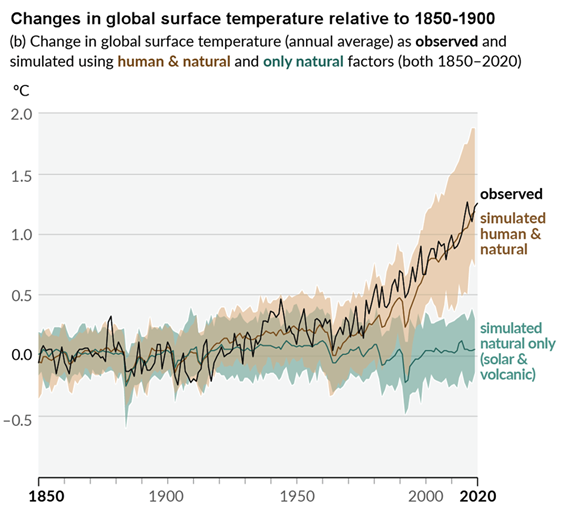
Other studies tend to agree. Foster & Rahmstorf (2011) used multiple linear regression to quantify and remove the effects of the El Niño Southern Oscillation (ENSO) and solar and volcanic activity from the surface and lower troposphere temperature data.  They found that from 1979 to 2010, solar activity had a very slight cooling effect of between -0.014 and -0.023°C per decade, depending on the data set. A more recent graphic, from the IPCC AR6, shows these trends to have continued.

AR6 WGI SPM Figure 1 Panel p

Figure 3: Figure SPM.1 (IPCC AR6 WGI SPM) - History of global temperature change and causes of recent warming panel (b). Changes in global surface temperature over the past 170 years (black line) relative to 1850–1900 and annually averaged, compared to Coupled Model Intercomparison Project Phase 6 (CMIP6) climate model simulations (see Box SPM.1) of the temperature response to both human and natural drivers (brown) and to only natural drivers (solar and volcanic activity, green). For the full image and caption please click here or on the image.

Like Foster & Rahmstorf, Lean & Rind (2008) performed a multiple linear regression on the temperature data, and found that while solar activity can account for about 11% of the global warming from 1889 to 2006, it can only account for 1.6% of the warming from 1955 to 2005, and had a slight cooling effect (-0.004°C per decade) from 1979 to 2005.

Finally, physics does not support the claim that changes in TSI drive current climate change. If that claim had any credence, we would not expect to see the current situation, in which Earth's lower atmosphere is warming strongly whereas the upper atmosphere is cooling. That is exactly the pattern predicted by physics, in our situation where we have overloaded Earth's atmosphere with greenhouse gases. If warming was solely down to the Sun, we would expect the opposite pattern. In fact, the only way to propagate this myth nowadays involves cherry-picking everything prior to 1975 and completely disregarding all the more recent data. That's simply not science.

Longer-term variations in TSI received by Earth

It's also important to mention variations in TSI driven not by Solar energy output but by variations in Earth's orbit, that are of course independent of Solar activity. Such variations, however, take place over very long periods, described by the Milankovitch orbital cycles operating over tens of thousands of years. Those cycles determine the distance between Earth and the Sun at perihelion and aphelion and in addition the tilt the planet's axis of rotation: both affect how much heat-radiation the planet receives at the top of its atmosphere through time. But such fluctuations are nothing like the rapid changes we see in the weather, such as the difference between a sunny day and a cloudy one. The long time-factor ensures that.

Another even more obscure approach used to claim, "it's the sun" was (and probably still is in some quarters) to talk about, "indirect effects". To wit, when studies can't find a sufficiently large direct effect, bring even lesser factors to the fore, such as cosmic rays. Fail.

In conclusion, the recent, post 1975 steep rise in global temperatures are not reflected in TSI changes that have in fact exerted a slight cooling influence. Milankovitch cycles that operate over vastly bigger time-scales simply don't work quickly enough to change climate drastically over a few decades. Instead, the enormous rise in greenhouse gas concentrations over the same period is the primary forcing-agent. The physics predicted what is now being observed.

Last updated on 27 May 2023 by John Mason. View Archives

Printable Version  |  Offline PDF Version  |  Link to this page

Argument Feedback

Please use this form to let us know about suggested updates to this rebuttal.

Related Arguments

Further viewing

Related video from Peter Sinclair's "Climate Denial Crock of the Week" series:

Further viewing

This video created by Andy Redwood in May 2020 is an interesting and creative interpretation of this rebuttal:

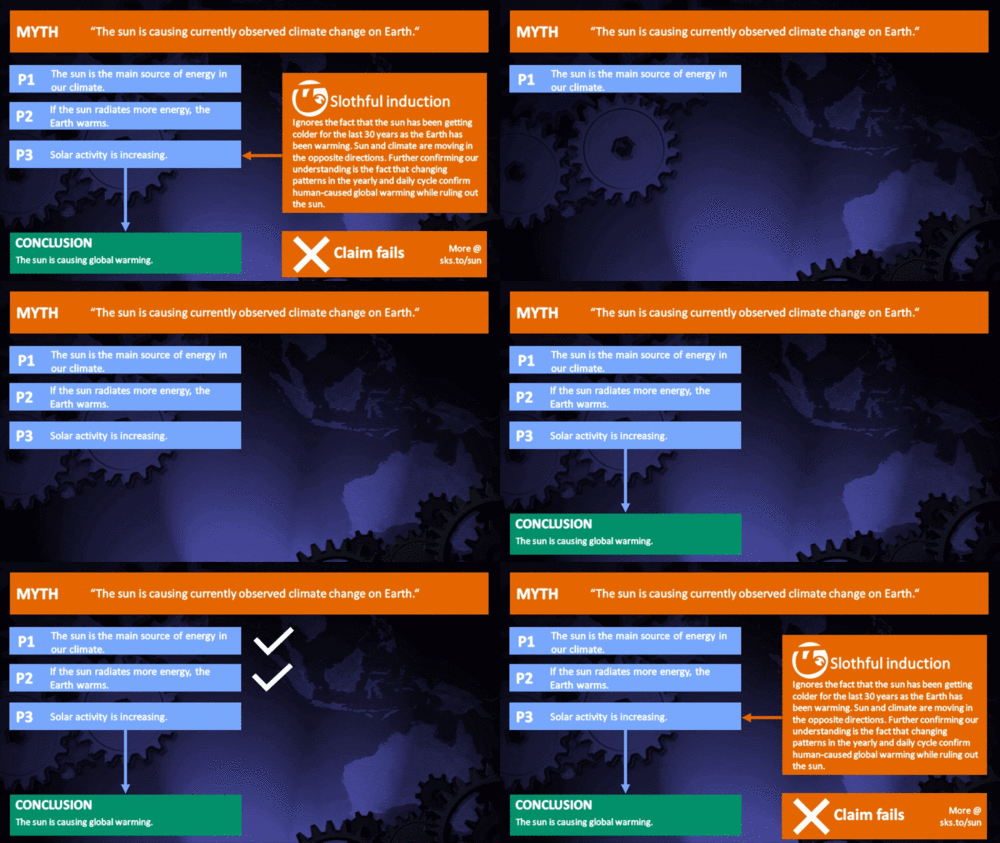
Myth Deconstruction

Related resource: Myth Deconstruction as animated GIF

MD Sun

Please check the related blog post for background information about this graphics resource.

Denial101x videos

Related lecture-videos from Denial101x - Making Sense of Climate Science Denial

and

Additional video from the MOOC

Expert interview with Mike Lockwood

Comments

Prev  1  2  3  4  5  6  7  8  9  10  11  12  13  14  15  16  17  18  19  20  Next

Comments 76 to 100 out of 656:

  1. leebert Taking northern polar wind direction that would go far to explain the March 2008 anomaly over asia. BTW Nice links, especially the jpeg.
  2. Two more studies to add to your impressive list of twelve: Sloan et al. 2008, http://www.iop.org/EJ/abstract/1748-9326/3/2/024001 Kristjansson 2008, http://folk.uio.no/jegill/publications.html (first link)
  3. Second order skeptic John has a whole page devoted to Sloan 2008 titled Do Cosmic Rays Cause Clouds that you might want to look at. The lower link to "Global dimming and global brightening - an analysis of surface radiation and cloud cover data in northern Europe" I found very interesting.
  4. The following comments are challenges to the theory of global warming that I haven’t heard any successful retort: • Post by Barry on Jan 30th – “I question the physics behind the response: a crucial finding was the correlation between solar activity and temperature ended around 1975......The assumption is that there is always an energy balance between heat radiated from earth and input from the sun. Lets say that solar activity remained above this energy balance, one would have to assume that temperature would still increase, until some new energy balance is achieved. This means that temperature can still increase as long as the input is greater that the output. • Post by tbandrow on March 7th – “Well, solar flux doesn't need to be argued. It can be proved. The current solar theory is due to an interaction that has something to do with sunspots. So, if that is the case, then we can see if the global temperature will go down, assuming the present dearth of sunspot continues.” Yes I saw the comment regarding La Nina, but his point was as we have more time years with low sun spots and cooling temperatures we can rule out irregularities like La Nina, can’t we? • Post By Dan Pangburn on April 14th – “From the Vostok ice core data, during glacial periods, often a rising temperature trend with a rising carbon dioxide level suddenly changed direction and became a falling temperature trend in spite of the carbon dioxide level being higher than when the temperature was increasing. This could not be if carbon dioxide causes a positive feedback. The Andean-Saharan Ice Age occurred when the carbon dioxide level was over ten times its current level. What is different now that could lead to run away temperature increase?” I find this argument to have particular merit, since by the accounts and data that I have seen, we haven’t seen any statistical temperature increase in the last 10 years (per NOAA data), yet we continue to increase CO2 concentration. If someone would point me to the arguments that have been made (or make new ones) that offer explanations or counterpoints, I would greatly appreciate that.
  5. Tom in Texas I know that this may sound a bit strange but parts of the U.S. actually get colder than central Canada (about as far north as civilization extends except for the coasts). For example in January 1996 northern Minnesota hit about -54 F during the Plains Blizzard, for that week it did not go higher than about -48 F (rounded to whole numbers). The same week, the urban town of North Bay and the mining town of Timmins (both Canada) never went below -45 F. and averaged about -40 F. It's because of the Jet Stream which as you know can dip as far south as Texas on occasion. It's one of the reasons that much of the cold tests conducted by car manufacturers are done in various towns in northern Minnesota. They also get more January snow than those canadian towns.
  6. Wow, my post has been up for 12 days, with no responses refuting the challenges to the theory of global warming that I posted? Does this mean that there is no credible scientific evidence to support the theory of global warming when it is confronted with these challenges?
  7. Wow, my post has been up for 12 days, with no responses refuting the challenges to the theory of global warming that I posted? Does this mean that there is no credible scientific evidence to support the theory of global warming when it is confronted with these challenges?
  8. TruthSeeker Recent attention has been on "Arctic sea ice melt - natural or man-made?" if you feel up to beating your head against a wall.
  9. Remeber what Einstein said, "No amount of experimentation can ever prove me right; a single experiment can prove me wrong."
  10. Why does this site keep referencing the 70's? The planet if over 4 billion years old and has been chaning ever since. You are sitting here talking about the last few hundred years like they have been of any kind of significance in the last 4 billion. It's just a spec, not even that really. More drastic changes have happened (climate wise) in Earths history then the industrial revolution. Does anybody else think that this is a form of "Vanity?" Short of nuclear fallout, I don't think that we could put a dent in this planets way of working. I do think however that pollution is bad for us humans, and we should look at that more then global destruction.
  11. Stop listening to the media and paid celebrities. They have no sort of degree in science and are just reading from a script. This has all stemed from "Yellow Science." It used to be that we listened to the scientists from both sides of the argument. Now we don't even listen to them at all, we listen to the media, politicians and paid celebrities, none which have any clue of what they are talking about. It's a shame that the scientists on the other side of the fence don't get the same main stream media attention that Al Gore does. But the reason for this is very simple and clear....MONEY. Over 50 Billion dollars has been spent world wide for Global Warming research. These scientists don't even have to come up with anything significant to get paid, they just have to sign there name with a little PhD right next to it. Big corporations have also made a killing selling "Green" products. Governments world wide will never let these scientists get world wide attention either because they can't admit they have been DUPPED into believeing that the sky was falling and that they just spent billions of your tax dollars on it. Keep an open mind, look at """"ALL"""" of the science and then draw your conclusions.
  12. Bri-Man To bring you up to speed (at least on this site) the 70's are referenced because in the mid to late 70's the solar forcing stopped following the temperature line. Their argument, which is that of the IPCC, is that CO2 induced AGW explains the increases from 1975 on. Those of us skeptical of this argument have several positions, mine is vulcanism and plate tectonics which have been more active since the full alignment in 1976. The most recently active thread is "Arctic sea ice melt - natural or man-made?" and the discussion is somewhat heated.
  13. Quietman, BriMan,TruthSeeker, et al As just a curious layman, it is good to see that the banter and debate on this site is broad and deep. This kind of debate in the press and Congress would do our nation some good. GW, I assume, will be like much of science through history. It is seldom complete, even when we think it is. Whether it was the Catholic Church's belief that the earth was the center of the Universe, or a long held believe that there were only four elements, or even that for some time most believed that there were 24 chromosomes. Good scientists hold to the facts in front of them. Great scientists keep looking when the science does not match the facts. Reading your inciteful remarks, I can conclude we are still very short of good data and great science. There is still so much to debate.
  14. tlewellen Many of us posting comments are just laymen as well. But because John allows us to put links to reference material it is a great place to learn a lot more about climate change. But like any blog, don't believe everything you read. Like John says at the top of the home page - skepticism is healthy.
  15. Interesting posts. Tlewellen has a very good point about science being seldom complete. Currently we do not fully understand ( or in fact know)all the factors that drive the earth's climate, so any modelling we do has to be held VERY lightly. Including AGW. To ascribe GW to a single source is simplistic: it ignores synergistic interactions which I suspect have a far greater effect than our current models can handle. Solar irradiation recieved by us is not constant and fluctuates around 6% due to orbital irregularities. Only recently has anyone started to think about the effects of other planetary masses on our orbit and the consequencies. It also seems from my (admittedly limited) research that too little attention and weight is given to the actions of water vapour and cloud formation/cover. I have even found one study that chose to ignore cloud effect because it was to chaotic and difficult to obtain hard data! I also worry about the actual relevence of data which has been 'altered' to account for anomalies....and then used as 'hard' information to produce a trend. Like Quietman says, scepticism is healthy!
  16. No-one has yet commented on the massive disparity in temperatures between the two graphs shown at the top of this page during the post-war boom (roughly the first three decades after the Second World War). In a debate I've been involved in on various newsgroups (http://groups.google.co.uk/group/alt.global-warming/browse_thread/thread/912fb81971711597), a supporter of global warming called Fran mentioned "global dimming" reducing temperatures from 1943-74. However, I have discovered that there are two completely different graphs of average northern hemisphere temperatures on the internet! The graph shown in "The Great Global Warming Swindle", displayed at the top of this page, looks to be based on the same data as a March 2003 SPACE.COM article entitled "Sun's Output Increasing in Possible Trend Fueling Global Warming" (http://www.space.com/scienceastronomy/sun_output_030320.html). This page came top when I googled "total energy output from the sun TSI" (without quotes). The graph on it uses data from an article by Baliunas and Soon in the Astrophysical Journal. This seems to tally with Fran's dates. However, two Wikipedia pages (http://en.wikipedia.org/wiki/Global_dimming and http://en.wikipedia.org/wiki/Historical_temperature_record) look to have similar data to the "Land-Ocean Temperature Anomaly" line in the second graph on this page (except the Wikipedia pages show 5-year rather than 11-year averages). These show falling temperatures in the 1940s but not in the subsequent decades It seems utterly ridiculous for predictions to have been made about a new ice age in the 1970s (rather than earlier decades) if temperature had not been falling as the latter graphs suggest. One set of graphs must be based on fake data, and my current opinion that the latter ones are fake appears to be supported by the NASA GISS data from individual measuring statements linked to by Whata Fool on http://groups.google.co.uk/group/alt.global-warming/browse_thread/thread/912fb81971711597. I have heard (I can't remember where) that the southern hemisphere has not been warming in recent decades unlike the north. Does anybody have any data about southern hemisphere temperatures? If not, why not? My particular take on the climate/weather, irrespective of whether CO2 is really the main contributor to global warming, is that it is being controlled by conspirators on the side of big business in the big political struggles in the world (to some degree or other, and maybe less so now than in the past). A BBC documentary "The Science of Superstorms" largely about the USSR regime's measures to affect where radioactive rainfall from Chernobyl came down and Chinese measures to stop rainfall at the time of the Olympics opening ceremony indicate that some level of control is possible. As weather forecasting has improved, so has the ability to control it - and having high levels of warming in some parts of the world and low levels in others suits the divide-and-rule agenda of unethical forces in positions of power.
  17. I forgot to mention in the above comment that the whole argument that the sun is not to blame is based on data/graphs that may be fabricated. There are massive vested interests, on both sides of the global warming debate, so fabrication of data is to be expected. Bearing in mind that one set of data for cooling during the post-war boom (despite higher production of carbon dioxide than earlier in the 20th century when temperatures were rising) is incorrect and clearly fabricated, the same may be true of recent solar radiance data.
  18. I find this all so fascinating. I have always been under the impression that we have been experiencing "Global Warming". Recently I have found we are now only talking about "Northern Hemispherical Warming". I am sure by this time next year we will be speaking of "North American Warming". Here I thought I was skeptical, no more. Everything is becoming so clear to me now. This BLOG is great! Definitely the best discussions I have found thus far. So many intensely intelligent individuals. Seems to me though, one should concentrate on adaptation rather than manipulation. You really think you can change the climate? I rather think that the climate will change you! ... this stuff is great ...
  19. Steve, you could also say "I forgot to mention in the above comment that the whole argument that the sun is to blame is based on data/graphs that may be fabricated". It's interesting that on one thread we have people arguing about which is to blame for the warming, the sun or CO2 while on another thread that global warming isn't happening at all. I wonder if some of the same posters are arguing both cases at once.
  20. sandy winder John has asked us to keep the threads relevant to the subject matter. So we argue for or against CO2 on all but for the sun only here. The problem, of course, is that there is no single simple explanation and thats why the models don't work right. Most of the argument here concerns TSI and Camp & Tung show that is a strong forcing comparable for that of CO2 (using IPCC sensitivity). However if the IPCC/NASA figures are too high (which another NASA scientist says they are) then the suns forcing is stronger. But that is still not the whole picture. The earth itself is very active right now. It's hard to go to a science news site without seeing a new discovery about current vulcanism/tectonics. Dr. Fairbridge's hypothesis explains this indirectly. It's all about the entire solar system and the interactions between sun and planets due to something we still do not understand fully: gravity.
  21. What I can't understand (if the sun is so important) is that for many millions of years when the dinosaurs were alive (and even before them) the planet was warmer than it is now, yet we are also told that the sun's output is gradually increasing over the eons. So how come the earth is not much warmer today, if the sun is the doiminant factor? The only answer seems to be that in the distant past the level of CO2 in our atmosphere was much higher.
  22. sandy winder Suns output increasing? Where did you hear that? The Sun is the major component in climate. Even if the IPCC figures for CO2 acting as a GHG are correct it could not work without the sun (GHGs are modifiers of solar radiation, not a heat source). In the distant past CO2 levels were in the thousands of ppm rather than low hundreds as they are today. But first it was hot, and then CO2 increased, then we had lush growth, a planetary jungle, and lots of animals to take advantage of it. That was 90% of the earths' history. The other 10% (roughly) consists of 4 ice ages. We are currently in the 4th ice age. It has slowly been warming (positive slope with wide oscillations) for 5 million years. The current period is considered to be an interglacial period. This, however can only be confirmed by another glacation (interglacial means between glacations). We could just as easily be in the post glacial period at the end of an ice age and that would mean it will continue to warm. The as yet unanswered question is: what causes these ice ages to start and stop? Until we can answer this question with high accuracy we know nothing about what climate is or how it works.
  23. Look here: http://news.nationalgeographic.com/news/2003/03/0307_030307_impactcrater.html "The existence of the impact crater, Chicxulub, was first proposed in 1980. In the 1990s, satellite data and ground studies allowed it to gain prominence among most scientists as the long sought-after "smoking gun" responsible for the demise of the dinosaurs and more than 70 percent of Earth's living species 65 million years ago." Whilst the impact would have released a colossal amount of heat energy, this would have only affected a fairly local area, so originally it was thought the dust produced caused sufficient dimming of sunlight to provoke a mass extinction event. Currently however, it is thought that insufficient dust would have been created by this impact to mask the sun long enough and attention has shifted to the possibility of massive SO2 release from local calcium sulphate deposits. SO2 effect would have lasted much longer than so there would have been considerable diminution in plant and animal activity. Bearing in mind the climate was a lot hotter then, the combined effect of dust(immediate) and SO2(longer lasting) would have initiated a rapid cooling which in turn could have been to start a climate 'wobble' which resulted in the cycle of ice ages and intermediate warmer periods. As far as I can tell, no definitive research has been carried out on this possibility.
  24. http://www.madsci.org/posts/archives/2002-12/1039267568.As.r.html In fact, the Sun is actually getting hotter. As 4 hydrogen atoms turns into 1 helium atom, the total number of particles in the Sun's core decreases. In order for the pressure within the Sun to stay constant, and continue to support itself against gravity, the temperature of the Sun must increase. This increase in temperature results in the Sun becoming brighter as well. In turn, this makes the Earth warmer because the intensity of sunlight is increasing. It is expected that within 1 billion years or so (well before the Sun runs out of hydrogen fuel) the temperature on Earth will increase to the point that a runaway greenhouse will take place. The result is that the Earth will end up looking much like Venus today.
  25. ///The as yet unanswered question is: what causes these ice ages to start and stop? Until we can answer this question with high accuracy we know nothing about what climate is or how it works./// I think it is bit unfair to say that scientists know nothign about climate. They know quite a lot about it. The fact they do not everything does not mean they know nothing. Scientists don't know everything about the human body yet but doctors still perform operations.

Prev  1  2  3  4  5  6  7  8  9  10  11  12  13  14  15  16  17  18  19  20  Next

Post a Comment

Political, off-topic or ad hominem comments will be deleted. Comments Policy...

You need to be logged in to post a comment. Login via the left margin or if you're new, register here.

Link to this page


The Consensus Project Website

THE ESCALATOR

(free to republish)


© Copyright 2024 John Cook
Home | Translations | About Us | Privacy | Contact Us