Climate Science Glossary

Term Lookup

Enter a term in the search box to find its definition.

Settings

Use the controls in the far right panel to increase or decrease the number of terms automatically displayed (or to completely turn that feature off).

Term Lookup

Settings


All IPCC definitions taken from Climate Change 2007: The Physical Science Basis. Working Group I Contribution to the Fourth Assessment Report of the Intergovernmental Panel on Climate Change, Annex I, Glossary, pp. 941-954. Cambridge University Press.

Home Arguments Software Resources Comments The Consensus Project Translations About Support

Bluesky Facebook LinkedIn Mastodon MeWe

Twitter YouTube RSS Posts RSS Comments Email Subscribe


Climate's changed before
It's the sun
It's not bad
There is no consensus
It's cooling
Models are unreliable
Temp record is unreliable
Animals and plants can adapt
It hasn't warmed since 1998
Antarctica is gaining ice
View All Arguments...


Username
Password
New? Register here
Forgot your password?

Latest Posts

Archives

Sun & climate: moving in opposite directions

What the science says...

Select a level... Basic Intermediate Advanced

The sun's energy has decreased since the 1980s but the Earth keeps warming faster than before.

Climate Myth...

It's the sun

"Over the past few hundred years, there has been a steady increase in the numbers of sunspots, at the time when the Earth has been getting warmer. The data suggests solar activity is influencing the global climate causing the world to get warmer." (BBC)

At a glance

Thankfully for us, our Sun is a very average kind of star. That means it behaves stably over billions of years, steadily consuming its hydrogen fuel in the nuclear reaction that produces sunshine.

Solar stability, along with the Greenhouse Effect, combine to give our planet a habitable range of surface temperatures. In contrast, less stable stars can vary a lot in their radiation output. That lack of stability can prevent life, as we know it, from evolving on any planets that might orbit such stars.

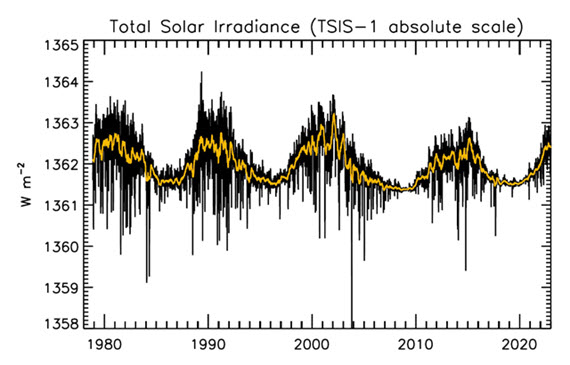
That the Sun is a stable type of star is clearly demonstrated by the amount of Solar energy reaching Earth's average orbital position: it varies very little at all. This quantity, called the Total Solar Irradiance, has been measured for around forty years with high accuracy by sensitive instruments aboard satellites. Its average value is 1,362 watts per square metre. Irradiance fluctuates by about a watt either way, depending on where we are within the 11-year long sunspot cycle. That's a variation of no more than 0.15%.

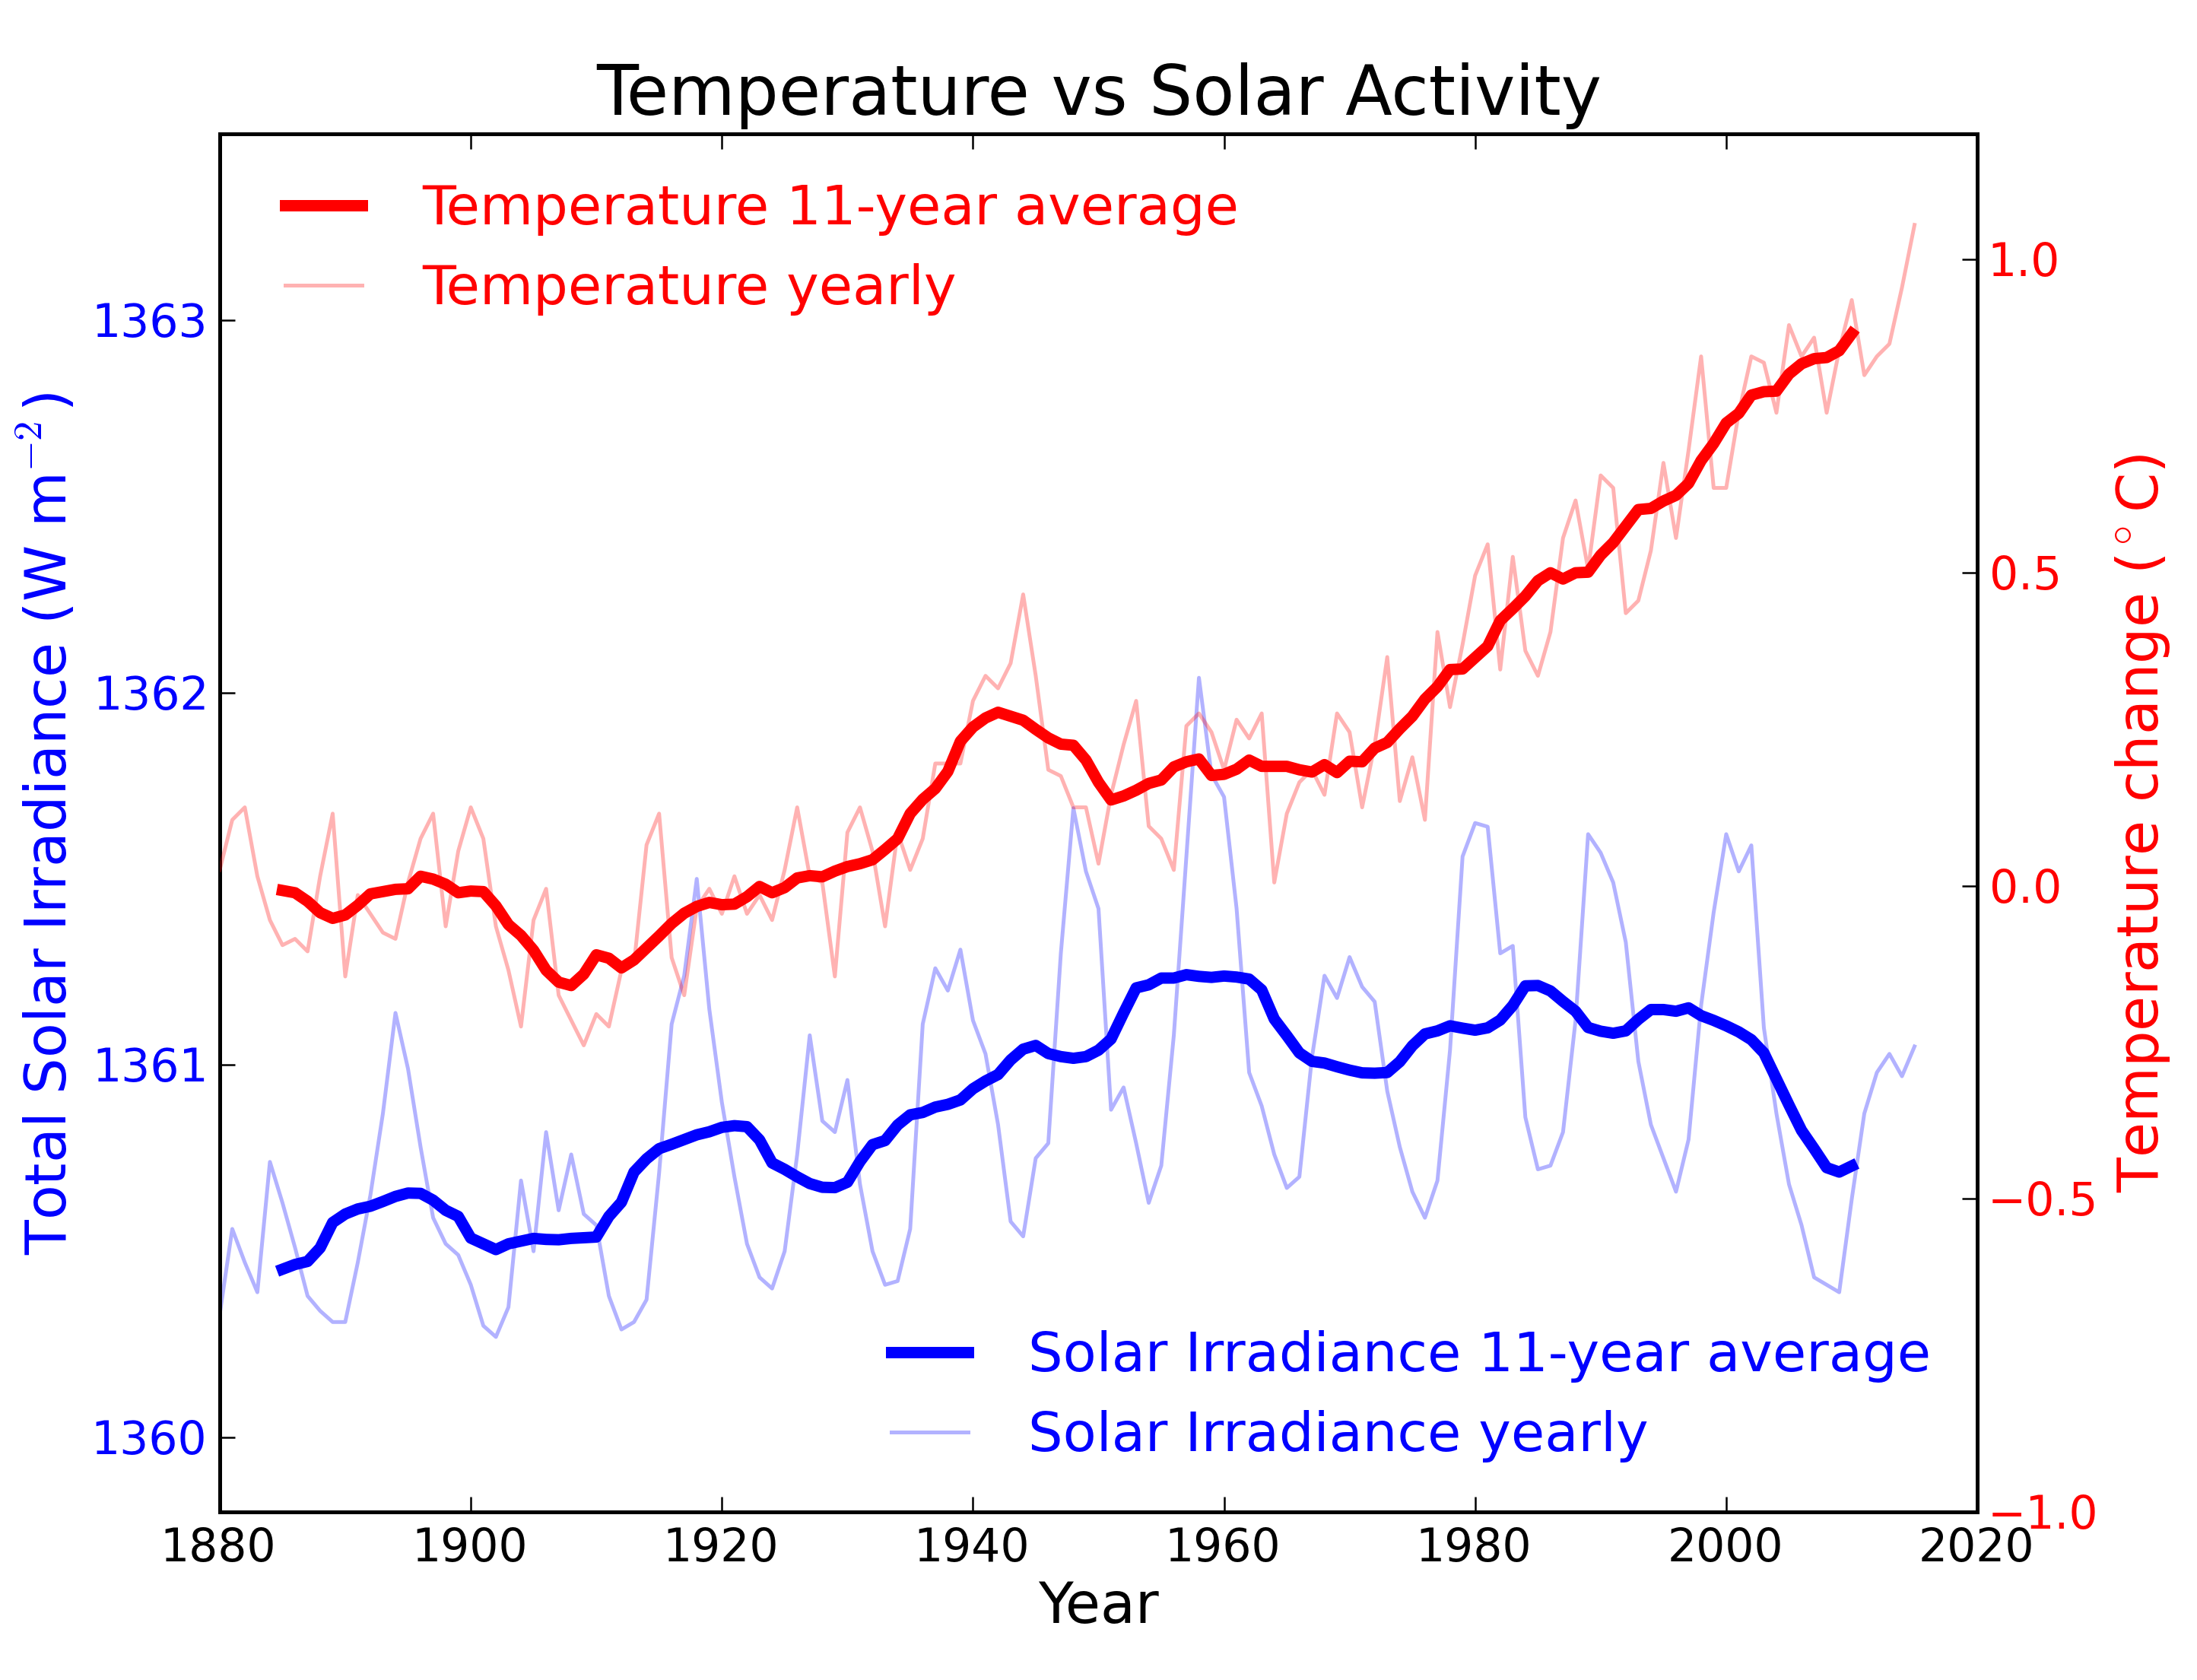
From the early 1970s until today, the Solar radiation reaching the top of Earth's atmosphere has in fact shown a very slight decline. Through that same period, global temperatures have continued to increase. The two data records, incoming Solar energy and global temperature, have diverged. That means they have gone in opposite directions. If incoming Solar energy has decreased while the Earth continues to warm up, the Sun cannot be the control-knob of that warming.

Attempts to blame the sun for the rise in global temperatures have had to involve taking the data but selecting only the time periods that support such an argument. The remaining parts of the information - showing that divergence - have had to be ditched. Proper science study requires that all the available data be considered, not just a part of it. This particular sin is known as “cherry-picking”.

Please use this form to provide feedback about this new "At a glance" section, which was updated on May 27, 2023 to improve its readability. Read a more technical version below or dig deeper via the tabs above!


Further details

Our Sun is an average-sized main sequence star that is steadily using its hydrogen fuel, situated some 150 million kilometres away from Earth. That distance was first determined (with a small error) by a time consuming and complex set of measurements in the late 1700s. It led to the first systemic considerations of Earth's climate by Joseph Fourier in the 1820s. Fourier's number-crunching led him to realise a planet of Earth's size situated that far from the Sun ought to be significantly colder than it was. He was thereby laying the foundation stone for the line of enquiry that led after a few decades to the discovery of what we now call the Greenhouse Effect – and the way that effect changes in intensity as a response to rising or falling levels of the various greenhouse gases.
TSI Solar cycles

Figure 1: Plot of the observational record (1979-2022) on the scale of the TSIS-1 instrument currently flying on the space station. In this plot, the different records are all cross calibrated to the TSIS-1 absolute scale (e.g., the TSIS1-absolute scale is 0.858 W/m^2 higher than the SORCE absolute scale) so the variability of TSI in this plot is considered to be its “true variability” (within cross calibration uncertainties). Image: Judith Lean.

The Sun has a strong magnetic field, but one that is constantly on the move, to the extent that around every 11 years or so, Solar polarity flips: north becomes south, until another 11 years has passed when it flips back again. These Solar Cycles affect what happens at the surface of the Sun, such as the sunspots caused by those magnetic fields. Each cycle starts at Solar Minimum with very few or no sunspots, then rises mid-cycle towards Solar Maximum, where sunspots are numerous, before falling back towards the end. The total radiation emitted by the Sun – total solar irradiance (TSI) is the technical term – essentially defined as the solar flux at the Earth's orbital radius, fluctuates through this 11-year cycle by up to 0.15% between maximum and minimum.

Such short term and small fluctuations in TSI do not have a strong long term influence on Earth's climate: they are not large enough and as it's a cycle, they essentially cancel one another out. Over the longer term, more sustained changes in TSI over centuries are more important. This is why such information is included, along with other natural and human-driven influences, when running climate models, to ask them, “what if?"

An examination of the past 1150 years found temperatures to have closely matched solar activity for much of that time (Usoskin et al. 2005). But also for much of that time, greenhouse gas concentrations hardly varied at all. This led the study to conclude, "...so that at least this most recent warming episode must have another source."
TSI vs. T
Figure 2: Annual global temperature change (thin light red) with 11 year moving average of temperature (thick dark red). Temperature from NASA GISS. Annual Total Solar Irradiance (thin light blue) with 11 year moving average of TSI (thick dark blue). TSI from 1880 to 1978 from Krivova et al. 2007. TSI from 1979 to 2015 from the World Radiation Center (see their PMOD index page for data updates). Plots of the most recent solar irradiance can be found at the Laboratory for Atmospheric and Space Physics LISIRD site.

The slight decline in Solar activity after 1975 was picked up through a number of independent measurements, so is definitely real. Over the last 45 years of global warming, Solar activity and global temperature have therefore been steadily diverging. In fact, an analysis of solar trends concluded that the sun has actually contributed a slight cooling influence into the mix that has driven global temperature through recent decades (Lockwood, 2008), but the massive increase in carbon-based greenhouse gases is the main forcing agent at present.

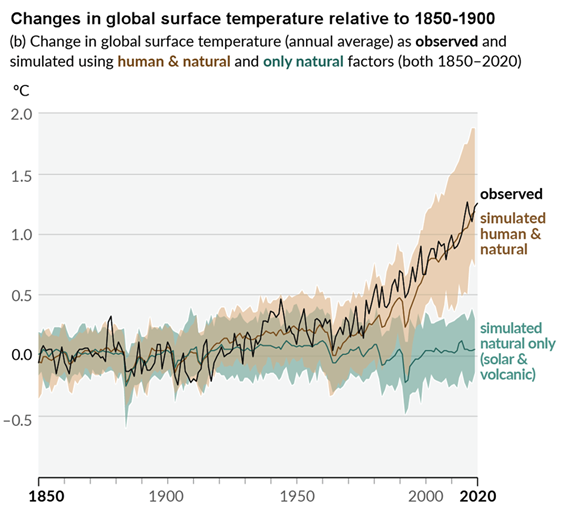
Other studies tend to agree. Foster & Rahmstorf (2011) used multiple linear regression to quantify and remove the effects of the El Niño Southern Oscillation (ENSO) and solar and volcanic activity from the surface and lower troposphere temperature data.  They found that from 1979 to 2010, solar activity had a very slight cooling effect of between -0.014 and -0.023°C per decade, depending on the data set. A more recent graphic, from the IPCC AR6, shows these trends to have continued.

AR6 WGI SPM Figure 1 Panel p

Figure 3: Figure SPM.1 (IPCC AR6 WGI SPM) - History of global temperature change and causes of recent warming panel (b). Changes in global surface temperature over the past 170 years (black line) relative to 1850–1900 and annually averaged, compared to Coupled Model Intercomparison Project Phase 6 (CMIP6) climate model simulations (see Box SPM.1) of the temperature response to both human and natural drivers (brown) and to only natural drivers (solar and volcanic activity, green). For the full image and caption please click here or on the image.

Like Foster & Rahmstorf, Lean & Rind (2008) performed a multiple linear regression on the temperature data, and found that while solar activity can account for about 11% of the global warming from 1889 to 2006, it can only account for 1.6% of the warming from 1955 to 2005, and had a slight cooling effect (-0.004°C per decade) from 1979 to 2005.

Finally, physics does not support the claim that changes in TSI drive current climate change. If that claim had any credence, we would not expect to see the current situation, in which Earth's lower atmosphere is warming strongly whereas the upper atmosphere is cooling. That is exactly the pattern predicted by physics, in our situation where we have overloaded Earth's atmosphere with greenhouse gases. If warming was solely down to the Sun, we would expect the opposite pattern. In fact, the only way to propagate this myth nowadays involves cherry-picking everything prior to 1975 and completely disregarding all the more recent data. That's simply not science.

Longer-term variations in TSI received by Earth

It's also important to mention variations in TSI driven not by Solar energy output but by variations in Earth's orbit, that are of course independent of Solar activity. Such variations, however, take place over very long periods, described by the Milankovitch orbital cycles operating over tens of thousands of years. Those cycles determine the distance between Earth and the Sun at perihelion and aphelion and in addition the tilt the planet's axis of rotation: both affect how much heat-radiation the planet receives at the top of its atmosphere through time. But such fluctuations are nothing like the rapid changes we see in the weather, such as the difference between a sunny day and a cloudy one. The long time-factor ensures that.

Another even more obscure approach used to claim, "it's the sun" was (and probably still is in some quarters) to talk about, "indirect effects". To wit, when studies can't find a sufficiently large direct effect, bring even lesser factors to the fore, such as cosmic rays. Fail.

In conclusion, the recent, post 1975 steep rise in global temperatures are not reflected in TSI changes that have in fact exerted a slight cooling influence. Milankovitch cycles that operate over vastly bigger time-scales simply don't work quickly enough to change climate drastically over a few decades. Instead, the enormous rise in greenhouse gas concentrations over the same period is the primary forcing-agent. The physics predicted what is now being observed.

Last updated on 27 May 2023 by John Mason. View Archives

Printable Version  |  Offline PDF Version  |  Link to this page

Argument Feedback

Please use this form to let us know about suggested updates to this rebuttal.

Related Arguments

Further viewing

Related video from Peter Sinclair's "Climate Denial Crock of the Week" series:

Further viewing

This video created by Andy Redwood in May 2020 is an interesting and creative interpretation of this rebuttal:

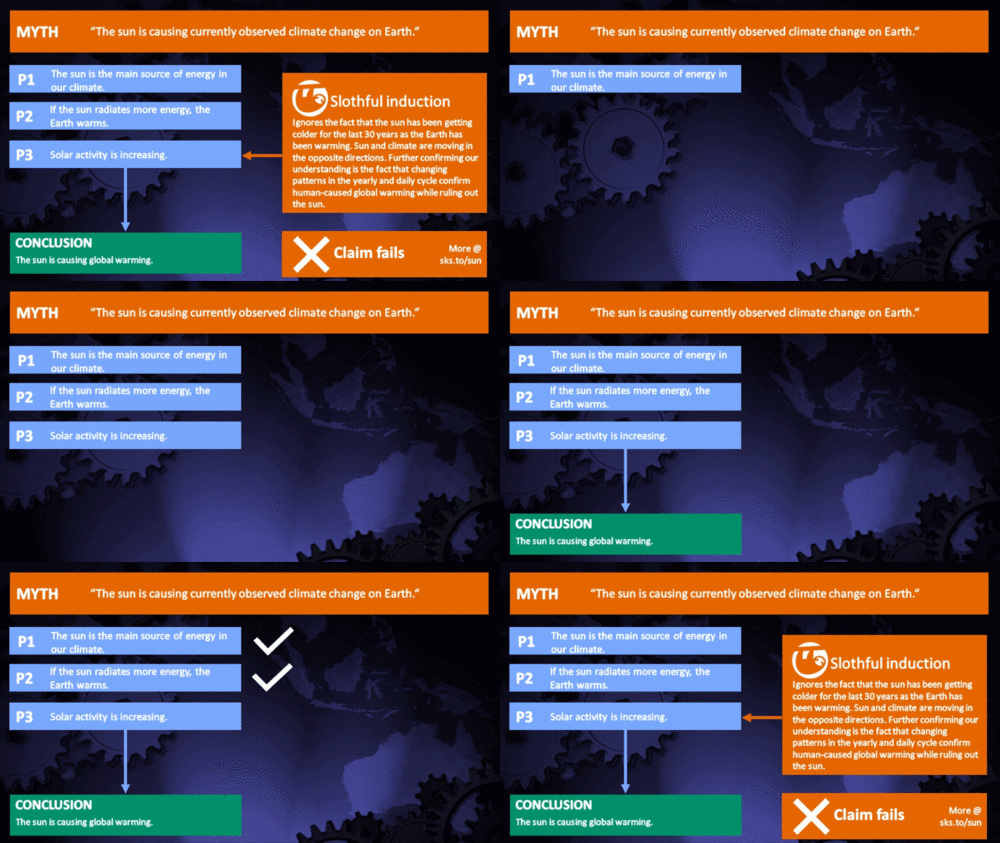
Myth Deconstruction

Related resource: Myth Deconstruction as animated GIF

MD Sun

Please check the related blog post for background information about this graphics resource.

Denial101x videos

Related lecture-videos from Denial101x - Making Sense of Climate Science Denial

and

Additional video from the MOOC

Expert interview with Mike Lockwood

Comments

Prev  1  2  3  4  5  6  7  8  9  10  11  12  13  14  15  16  17  18  19  20  Next

Comments 176 to 200 out of 1304:

  1. chris Nice dissertation on how CO2 can be absorved by the ocean. Now show how much is tectonic. The fact is that you can't. This is an area that is not well understood. This is indeed claiming to know what we actually know very little about. 1) CO2 relaesed from undersea volcanos and ridges is direct to the oceans. 2) Fertilzer entering the oceans causes algal and bacterial blooms which then die, rot and produce methane and add carbon direct to the oceans, at the same time reducing O2 production. There are knowns but the actual amounts are total unknowns. Go ahead, please tell me that mankind knows everything that happens under the oceans. Then go tell the scientists that are still trying to figure it out, I am sure they would greatly appreciate it. You just don't get it. As much as we may know there are many times as much things that we do not know and pretending to know will not help.
  2. Re: "we look at the EVIDENCE that they might use to support their statements." I don't think so.
  3. QM: Green plastic is not a good colour! better is simple translucent or the slightly 'bluish' UV stabilised pvc.
  4. Mizimi They might make it in blue, I know they make it in colorless, green and amber. I guess that the colorless translucent is the way to go then. PVC isn't strong enough, the snow and ice would break it before I could clear it off, in this area fibreglass is used for strength. I appreciate the suggestions, thanks. PS Just finished reading this one: Sunlight Has More Powerful Influence On Ocean Circulation And Climate Than North American Ice Sheets from ScienceDaily (Nov. 6, 2008).
  5. Re #195 Yes, we do know that an insignificant amount of this massive amount of CO2 that is being pumped into the atmosphere and absorbed by the oceans comes from volcanic/tectonic activity. We do know that the vast bulk of this is from burning fossil fuels (with a bit from forest burning). Remember that fossil fuels are highly depleted in 13C, since the plants from which the fossil fuels are derived select the 12C isotope for incorporation into their (initially) generic carbohydrate [(CHOH)6]. On the other hand oceanic subducted carbonates released by tectonic activity is indifferent to the isotopic composition of the carbon in the CO2 from which it is "fixed". So as fossil fuels are burned, they release their 13C-depleted carbon back into the atmosphere, and the 13C content of the CO2 in our environment drops. This is easy to measure in the real world (the 13C/12C ratio) using a mass spectrometer. The 13C content of CO2 in our environment is dropping just as expected from a fossil fuel source of CO2, as the atmospheric CO2 content rises dramatically in response to our massive rate of oxidation of long-sequestered fossil fuels There's lots of information on this of course! See, for example: Francey RJ, Allison CE, Etheridge DM, et al. (1999) A 1000-year high precision record of delta C-13 in atmospheric CO2 TELLUS B-Chem Phys. Meteor 51, 170-193 and D. M. Etheridge et al (1996) "Natural and anthropogenic changes in atmospheric CO2 over the last 1000 years from air in Antarctic ice and firn J. Geophys Res. 101, 4115 -4128 and so on...
  6. chris I only recently posted a link to an article on how the whole 13C evidence needs a rethink. I think that I was addressing Mizimi in the Arctic Ocean thread when I posted it. Not sure now. We only thought we knew what we know on that one.
  7. No, that's not correct Quietman. Again you're using a paper to address an issue that is not, in fact, what the paper is about at all. The measure of 13C/12C ratios in CO2 in our environment is straightforward and shows a decrease as expected from the return of vast amounts of 13C-depeleted carbon into the atmosphere from long-sequestered fossil fuels originally derived from plant sources. That indicates very clearly that the massive enhancement of atmospheric CO2 (and that being forced into the oceans as a result) is from oxidation of fossil fuel (and a bit from deforestation) and doesn't significantly derive from tectonic activity. Which we know anyway, since we know how much CO2 we've produced during the industrial age, and can measure the increasing amounts in the ocean due to forced partitioning from the atmosphere. And of course we know from the high resolution 2000 year CO2 record and the lower resolution records spanning millions of years, that tectonic activity (volcanic or undersea sources)has made a trivial contribution to the net CO2 concentration. The paper that you cited [P.K. Swart (2008) Proc. Natl. Acad. Sci. USA 105, 13741-13745] is about something quite different. It addresses the mismatch between the apparently synchronous variations in 13C content of carbonate sediments deposited off the margins of low latitude shallow marine platforms and the pattern in the open oceans, and concludes that this difference can be resolved by noticing that the apparent synchrony relates to sea level changes and synchronous flooding of the platforms. So it's a paper that may have resolved an incompatibility between some marginal and deep ocean data sets. It doesn't have anything to do with the partitioning of carbon isotopes in fossil fuels and the readily measured variation in 13C/12C ratios that occur when 13C-depeleted carbon is returned to the biosphere by oxidation of fossil fuels. One should make an effort to find out what a paper is about before citing it in support of something on which it might have no bearing. Remember that science is all about the evidence, and the evidence should be appropriate to the issue at hand!
  8. You missed my point. So please explain how this natural source of C13 is different from the current source of C13 and how it is affected by catalysts.
  9. ps Re: "we don't evaluate the assertions of others using hero-worship or personal preferences" On the former it's not hero worship of Dr. Fairbridge but recognition of character and excellent work, and the latter is a resentment for the underhanded and demeaning treatment that Dr. Spencer receives for his skepticism.
  10. re #202 You need to explain your request. All 13C is "natural" (unless it's produced in a particle accelerator). What do you mean by the "current source of 13C" and the "natural source of 13C"? And what "catalysts" are you referring to? 13C is a carbon isotope and isn't affected by catalysts.
  11. chris We use a series of catalysts inside every catalytic converter to transform HC, CO and NOx into H2O and CO2, starting in CA in 1974 and nationwide after 1975 depending on engine size. Almost all passenger vehicles were equipped with cats by 1978. Then there are the industrial stacks. The converters for stacks are also aimed at producing CO2 and H20. This is mandated by the EPA. So what effect does the cat have on C13?
  12. ps A byproduct is SO2.
  13. Or put another way, would you measure the same C13/C12 ratio in airborne HC and CO?
  14. Chemical catalysis has zero effect on 13C. There is a fundamental difference between chemistry (catalysed or uncatalysed bond making and breaking) and nuclear physics (extremely high energy transformation of the structure of atomic nuclei). So fossil-fuels have highly depeleted 13C relative to the natural abundance of 13C, since plants have a significant "preference" for the uptake of 12C CO2 over 13C CO2 when they draw CO2 out of the atmosphere. As the plants are "fossilised" into coal, oil and natural gas, shales, peat and so on, they retain this highly depleted ratio of 13C/12C. 13C and 12C cannot interconvert by chemical processes. When the fossil fuel is returned to the atmosphere by burning the 13C-depleted CO2 is at long long last returned to the atmosphere, and the 13C/12C ratio of atmospheric CO2 drops. This doesn't happen to any significant extent with CO2 released by volcanoes, since (first) volcanoes and tectonic activity in general doesn't release much CO2 as we can observe by inspecting the atmospheric CO2 records at high resolution for 1000's of years, and at low resolution for millions of years. Sedimented carbonates, and even the shells of marine organisms give rise to very, very small differences in the 13C/12C ratio, and these relate more to the physicochemical "fractionation" as a function of temperature. Since 13C is essentially unaffected by any processes outwith particle accelerators, nuclear reactors and so on, in which nuclear transformations can take place, 13C is effectively inviolate in the Earth [***]. So as we burn fossil fuels a 12C carbon remains as a 12C isotope and likewise a 13C carbon atom. This occurs if the CO2 is produced by direct oxidation of carbon or hydrocarbon, or if a small amount of the hydrocarbon is left partially unoxidised or in the form of carbon monoxide, and is subsequently oxidised "to completion" within a catalytic converter. The answer to your specific question of post #207 is yes..you would measure the same 13C/12C raio in airborned hydrocarbon and carbon monoxide, whether or not these were vapourized directly into the air or fully oxidised to carbon dioxide within a catalytic converter. [***]The unstable carbon isotope 14C is produced in very small amounts in the upper atmosphere by the action of gamma rays, at much lower energies than required to produce the stable isotope 13C, and this provides the basis of using 14C decay as an "atomic clock" in radiocarbon dating. Note that the atmospheric 14C content can be used to distinguish fossil-fuel-derived carbon from deforestation-derived carbon, since the 1/2 life of 14C radioactive decay (a bit under 6000 years) is long relative to the life of trees (except for the most ancient of these like the bristlecone pines in the west of the USA!), but very short relative to the time that fossil fuels have lain undistrubed underground. This is somewhat complicated by the fact that just the short period of nuclear device testing in the 1940's through the 1960's has produced quite a significant spike in the atmospheric 14C content, and needs to be corrected for...
  15. chris That is correct. SO by removing the catalytic converter we would reduce CO2 output and lower the 12C/13C ratio.
  16. Not really Quietman. It wouldn't make a noticeable difference! And in fact you've got it the wrong way round. If we removed the catalytic converter a tiny proportion of the CO2 otherwise pumped into the atmosphere would remain unoxidised to CO2 (and left as hydrocarbon or carbon monoxide). Since this tiny, tiny amount is from 13C-depleted fossil fuels, it would RAISE the 12C/13C ratio (since we would be failing to add to the atmosphere a tiny, tiny amount of 13C-depleted CO2). Of course that's all academic. The point is that we know very well from at least three seperate types of measurement (including the measurement of carbon isotopes in CO2) that the massive increased atmospheric concentrations of carbon dioxide, and the massive partitioning of carbon dioxide into the oceans, is the result of massive digging/pumping up and oxidation of long-sequestered fossil fuels.
  17. Re #192 and #203 On Roy Spencer: Roy Spencer has spent the better part of his "scientific" career as a staff scientist engaged in analysis of satellite Microwave Sounding Unit (MSU) data on tropospheric temperatures. This has been carried out for 15 or more years with a combination of incompetence (that borders on the fraudulent), and widescale propagandising for false interpretations outside of the normal channels of scientific communication. In recent times he's attempted to pull the wool over the eyes of the gullible and similarly misguided with a contrived mishmash of a notion relating to supposed natural internal variations in the climate system as a cause of 20th century global warming. The fact that Spencer is a creationist doesn't necessarily add or subtract to the fact that he's done disgracefully incompetent science for years, and that he attempts to "sell" falsehoods direct to the public through websites and the resources of anti-democratic organizations. After all there are a great many first-class scientisits that have strong religious beliefs. Unfortunately Spencers "style" of ceationism isn't really a religious belief...that class of "pseudo-Christian" fundamentalist "creationism" (wrapped up in the "intelligent design" "package") is really a political position. Sadly, it's very much in keeping with Spencer's apparent willingness to subvert scientific honesty in the service of creepy ideologies. My personal view is that Spencer is rather taken with the modern "pseudo-Christian" creationinist success in hiving of quite a large "rump" of the poorly educated, misguided and various assorted bullies, with what is obviously complete nonsense, and quite likes the fact that much of that same great "unwashed" are more than happy to swallow his anti-science nonsense on climate-related matters. As always in science it's about the evidence. Spencer has spent nearly 20 years making a complete hash of this, and that's why bone fide scientists and well-informed policymakes are less than thrilled with his "contribution"...
  18. Question: My understanding is that most 'volcanic' activity is undersea and that the CO2 thus produced would go more or less immediately into solution? In which case how can one quantify how much is being added...? Question: How much C13 has been produced by nuclear tests and accidents? And what effect has it had on the general level of C13 in atmospheric CO2 ? "Unfortunately Spencers "style" of ceationism ..... is really a political position." Well, given the minimilistic numbers on A CO2 contribution to 'global warming' one could well say the same of adherents to that belief.
  19. Question 1: Very little CO2 has been added to seawater by "undersea" volcanic activity. We know this from (at last) two sources. (i) If undersea volcanic activity resulted in significant acumulation of CO2 in the oceans, then we should see (have seen) some of this released into the atmosphere. However we have atmospheric CO2 records going back millions of years. One would have to make the rather specious "argument" that undersea volcanic activity has all of a sudden, after millions of years, started releasing large amounts of CO2 just when mankind has stared releasing vast amounts of CO2. However there's no real world evidence for enhanced undersea volcanic activity, let alone enhanced production of CO2 from volcanic activity. And we know anyway [see posts #201/208 and (ii) just below] that the massive amounts of CO2 in the atmosphere that is partitioning in massive amounts into the oceans is from fossil fuels. (ii) As already described, tectonic activity in general results in release of very small amounts of CO2 {less than 1% of current anthropogenic levels) and this is largely from non-organic sources. Undersea volcanic activity is by definition undersea (!), and the sources of undersea volcanic activity are at sites of nascent plate boundaries (e.g. Mid Atlantic ridge) or mantle plumes (e.g. under Hawaii). Any CO2 released from these sources have pretty normal 13C/12C compositions (around 1% 13C) since the carbon is almost exclusively from non-organic sources. In fact it may be more likely that CO2 from land volcanoes (at subduction zones on continental margins) will have a little CO2 from organic sources since these will release some CO2 from carbon previously subducted from the ocean floor, a bit of which might be organic ('though not much, since organic material in the ocean finds itself utilised within the food chain...). But in general volcanos (either undersea or on land) release rather small amounts of CO2, and the carbon isn't particularly 13C-depeleted. and so on...there more evidence from proxy measures of sea-water pH and such like... Question 2: The amount of 13C from nuclear tests/accidents is tiny in proportion to the amount of natural 13C in the environment. 13C comprises around 1% of carbon (it's naturally abundant at around 1%). The contribution from non-natural sources is immeasurably small. The situation is a bit different for 14C. Remember that 13C is a stable isotope of carbon whereas 14C is an unstable radioactive isotope, which additionally has a very short half-life (6000-ish years). The fact that there is any appreciable amount of 14C in the environment at all, is that this is being continually produced in tiny, tiny amounts by the action of gamma rays in the upper atmosphere. So the contribution from mid-20th century nuclear testing is significant, and there is a bit of a "spike" in the atmospheric 14C record...
  20. Re #212, On Spencer and "political beliefs"... Well yes, Mizimi, I suspect that your apparent missunderstanding of the nature of science in relation to religion and politics is a contrived one (played out for comedy effect?....or maybe you just like reading my posts!). I'm sure you know really that science is all about the evidence, and that's the essential difference between science and religion or political advocacy. So one would only pursue the deceit that CO2 all of a sudden has stopped being a greenhouse gas (or that the massively raised levels of atmospheric CO2 were from volcanoes), for example, if one was attempting to make some sort of political (or other agenda-led) capital. Wouldn't you say so? The similarities between global warming denialism and modern-style "creationism" are interesting, and Spencer provides an example of how these can induce a perversion of scientific evidence in support of an agenda. In the US these stances have a tendency to coincide, such that it's quite common for those that wilfully choose to ignore or misrepresent the scientific evidence for evolution (e.g. "hard core" neo-"Christian" chaps!) are also likely to participate in misrepresenting the science on global warming. I find it particularly fascinating that someone who's career as a staff scientist involved "measuring" tropospheric temperatures would drift down this route, but there seems to be a particularly attractive (for some people) political position in the US that induces this anti-rational behaviour...and which incidentally is catnip for those with really serious anti-science efforts to pursue (e.g. pretending that smoking isn't a strong contributory factor in lung cancer and respiratory and circulatory disease..or that aspirin taking in children doesn't enhance their likelihood of contracting Reyes syndrome...that sort of thing!).
  21. chris According to spencer he is a meteorologist. I posted a link to his latest article in the PDO thread.
  22. 172 chris The paleo record shows high CO2 during cold eras low CO2 during warm periods, in short No connection. Even the record that is supposedly the great proof of the concept, from ice cores clearly shows that for the recent past temperatures rise first followed by CO2 increasing. Which is simple to explain with equilibrium chemistry. This is what I was referring to by the paleo record not supporting CO2 as a primary driver. John may well be right and there is some delay mechanism followed by CO2 increasing the warming but this is, if true, at most secondary in the paleo record. As to the satellite record and warming of your later comment, there is much discussion of what the supposed pattern of that warming should be. I am not familiar enough with your cited paper to know what it finds but as others have pointed out above there are a number of papers that suggest the "fingerprint" is wrong. In the past we have handled this by changing what we think the fingerprint should be, correctly or incorrectly I don't know. Remember when models showed the warming would occur first and most dramtically at night and at the poles and that it would be greater in the stratosphere? Two examples of "definite fingerprints" of AGW that made great sense but, didn't work out?
  23. Re #216 ONE: CO2/temperature correlations: I don't think that's correct WA. The paleorecord shows a rather good correspondence between paleoproxies for cold/warm periods and paleoproxies for low/high CO2. Which particular study/geological period were you thinking of? This subject has recently been very comprehensively reviewed by Royer, and a great slew of data highlights the strong relationship between paleoCO2 and paleo temp (high CO2 corresponds to warm periods and vice versa) right throughout the Phanerozoic (last 460-ish million years). I've reproduced citations to a number of these studies at the bottom of the post. Here's Royer's compilation: D.L. Royer (2006) "CO2-forced climate thresholds during the Phanerozoic" Geochim. Cosmochim. Acta 70, 5665-5675. TWO: CO2/temp relationships during ice age cycles. I'm surprised people are still confused by this very straightforward topic. John Cook has explained this very concisely here: http://www.skepticalscience.com/co2-lags-temperature.htm In a nutshell: CO2 is a greenhouse gas. Raising its atmospheric concentration results in enhanced warming of the Earth, all else being equal. A large amount of scientific data, indicates that the Earth's surface temperature responds to enhanced [CO2] with somewhere around 3 oC of warming (+/- a bit) per doubling of atmospheric CO2: http://www.skepticalscience.com/climate-sensitivity.htm It doesn't matter what caused/causes the enhanced CO2; raising [CO2] results in enhanced greenhouse warming. Compare the ice age glacial/interglacial transitions, and the current global warming: a.) ice-age transitions: Over a period of around 5000 years (around 15,000 to 10,000 years ago), predictable changes in the Earth's orbital properties changed the insolation pattern resulting in a very slow warming, and the earth transited from a glacial to the interglacial period that we now inhabit. Over a period of 5000 years the Earth warmed by around 6 oC overall, and during this period atmospheric CO2 levels rose by 90-100 ppm (from 180-270ish ppm) due probably to very, very slow temperature dependent efflux from warming oceans. The temperature rose around 0.1 oC per 100 years on average, with around 2 ppm of raised [CO2] per 100 years. The raised CO2 lagged the warming initially, but it contributed overall to the net warming, since raised CO2 "traps" more solar energy. b. current global warming: At present the Earth is warming at 0.18-0.2 oC per decade (around 18-20 times faster than during the glacial to interglacial), in response to [CO2] that is rising by around 2.5 ppm PER YEAR (more than 100 times faster than during the glacial to interglacial transition). In each case the enhanced [CO2] results in warming. During the ice age cycles, CO2 rose extremely slowly in response to slow Milankovitch-induce warming, and produced a feedback amplification of the initial warming. Now the CO2 is being released directly into the atmosphere in copious amounts at a massive rate. It doesn't matter how the [CO2] gets into the atmosphere...the Earth warms as a result. CO2 is a greenhouse gas. THREE: Satellite record: The satellite record is pretty much consistent with expectations based on our understanding of the greenhouse effect. Unfortunately the record is not very well constrained (it's also very short...since 1979 only). Roy Spencer has made a dreadful hash of "analyzing" the record over a period of nearly 20 years, but others have corrected a number of dreadful blunders, and there doesn't seem to be any substantive disagreement between the record and the expectations from surface warming combined with our understanding of atmospheric physics and thermodynamics. Which papers were you thinking of that "suggest the "fingerprint" is wrong"? FOUR: warming at night..at the poles...in the stratosphere. Which models are you thinking of specifically? It was prediced as long ago as the early 1980's, that warming in response to enhanced greenhouse gases should be most dramatic in the high Northern latitudes and that the Antarctic would remain "buffered" from the effects of enhanced greenhouse gases for some time. That's certainly turned out to be true. I'm not sure about the day/night expectations, although it seems reasonable that greenhose warming would certainly be effective at night. What's your evidence for a disagrement if you considerone exists? I'm skeptical about your point about the "stratosphere"! Evidence please. I wonder if you meant "troposphere"... ----------------------------------------------------- In relation to point ONE above, more recent studies supplement the information in Royers compilation and cover additional periods with new data sets right through the past several hundreds of millions of years: R.E. Carne, J.M. Eiler, J. Veizer et al (2007) "Coupling of surface temperatures and atmospheric CO2 concentrations during the Palaeozoic era" Nature 449, 198-202 W. M. Kurschner et al (2008) “The impact of Miocene atmospheric carbon dioxide fluctuations on climate and the evolution of the terrestrial ecosystem” Proc. Natl. Acad. Sci. USA 105, 499-453. D. L. Royer (2008) “Linkages between CO2, climate, and evolution in deep time” Proc. Natl Acad. Sci. USA 105, 407-408 Zachos JC (2008) “An early Cenozoic perspective on greenhouse warming and carbon-cycle dynamics” Nature 451, 279-283. Doney SC et al (2007) “Carbon and climate system coupling on timescales from the Precambrian to the Anthropocene” Ann. Rev. Environ. Resources 32, 31-66. Horton DE et al (2007) “Orbital and CO2 forcing of late Paleozoic continental ice sheets” Geophys. Res. Lett. L19708 (Oct. 11 2007). B. J. Fletcher et al. (2008) “Atmospheric carbon dioxide linked with Mesozoic and early Cenozoic climate change” Nature Geoscience 1, 43-48.
  24. Re #215 A scientist can call himself all sorts of things. Spencer is listed under "Staff" at the Earth System Science Center at the University of Alabama at Huntsville. He may consider himself to be a Meteorologist or a Climatologist, and no doubt an Atmospheric Physicist and so on...it doesn't really matter....scientists consider all sorts of different labels to be appropriate to their jobs/expertise. The salient point is that he's made a dreadful hash of analyzing the satellite MSU data for a very long period indeed, his "efforts" have had to be consistently corrected in the scientific literature, and he has taken to bypassing the normal scientific channels and engaged in attempting to sell nonsense to the general public via dodgy websites and suchlike! I've had a look at the paper you've linked to...if I have time I'll make some comments on the PDO thread where you posted the link....
  25. Chris Re:218 This is a splinter in your neighbors eye issue if I have ever seen one. Especially in light of the errors and corrections in the GISS record. Is it your contention that it is incompetance in that case or bias? Ice core samples show that the warming happens first, our host claims a natural delay accounts for this. I think having a reversed order of cause and effect should give anyone pause, and let's not fool ourselves that is what we have there. It most certainly does not support the correlation you claim. Unless you would also contend that I ate too much junk food because I had gained weight. As to the more distant past while very uncertian I don't see how anyone could get anything like a correlation from what is there, we have ice ages with high CO2 and warm eons with low CO2. The satellite record is to an even greater extent consistent with the hypothesis that there is no positive feeedback due to increased CO2. In fact it is also consistent with the hypothesis that human activities have no measurable effect on world temperature. I think I am saying that isn't really much of a proof.

Prev  1  2  3  4  5  6  7  8  9  10  11  12  13  14  15  16  17  18  19  20  Next

Post a Comment

Political, off-topic or ad hominem comments will be deleted. Comments Policy...

You need to be logged in to post a comment. Login via the left margin or if you're new, register here.

Link to this page


The Consensus Project Website

THE ESCALATOR

(free to republish)


© Copyright 2024 John Cook
Home | Translations | About Us | Privacy | Contact Us