Climate Science Glossary

Term Lookup

Enter a term in the search box to find its definition.

Settings

Use the controls in the far right panel to increase or decrease the number of terms automatically displayed (or to completely turn that feature off).

Term Lookup

Settings


All IPCC definitions taken from Climate Change 2007: The Physical Science Basis. Working Group I Contribution to the Fourth Assessment Report of the Intergovernmental Panel on Climate Change, Annex I, Glossary, pp. 941-954. Cambridge University Press.

Home Arguments Software Resources Comments The Consensus Project Translations About Support

Bluesky Facebook LinkedIn Mastodon MeWe

Twitter YouTube RSS Posts RSS Comments Email Subscribe


Climate's changed before
It's the sun
It's not bad
There is no consensus
It's cooling
Models are unreliable
Temp record is unreliable
Animals and plants can adapt
It hasn't warmed since 1998
Antarctica is gaining ice
View All Arguments...


Username
Password
New? Register here
Forgot your password?

Latest Posts

Archives

Does Urban Heat Island effect exaggerate global warming trends?

What the science says...

Select a level... Basic Intermediate

Urban and rural regions show the same warming trend.

Climate Myth...

It's Urban Heat Island effect

A paper by Ross McKitrick, an economics professor at the University of Guelph, and Patrick Michaels, an environmental studies professor at the University of Virginia, concludes that half of the global warming trend from 1980 to 2002 is caused by Urban Heat Island. (McKitrick & Michaels)

The Urban Heat Island Effect (UHI) is a phenomenon whereby the concentration of structures and waste heat from human activity (most notably air conditioners and internal combustion engines) results in a slightly warmer envelope of air over urbanised areas when compared to surrounding rural areas. It has been suggested that UHI has significantly influenced temperature records over the 20th century with rapid growth of urban environments.

Scientists have been very careful to ensure that UHI is not influencing the temperature trends. To address this concern, they have compared the data from remote stations (sites that are nowhere near human activity) to more urban sites. Likewise, investigators have also looked at sites across rural and urban China, which has experienced rapid growth in urbanisation over the past 30 years and is therefore very likely to show UHI. The difference between ideal rural sites compared to urban sites in temperature trends has been very small:
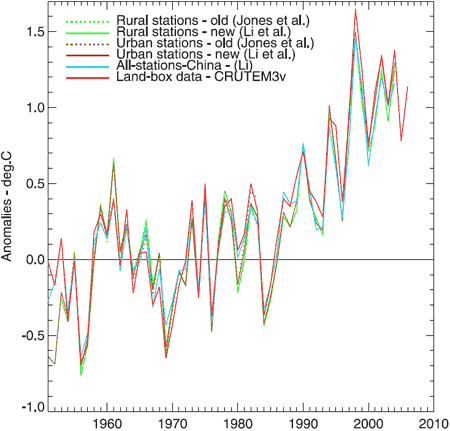

Figure 1. Annual average temperature anomalies. Jones et al (dotted green and brown) is a dataset of 42 rural and 42 urban sites. Li et al (solid green and brown) is an adjusted dataset of 42 rural and 40 urban sites. Li (blue) is a non-adjusted set of 728 stations, urban and rural. CRUTEM3v (red) is a land-only data set (Brohan et al., 2006). This plot uses the 1954–83 base period.

Another way to explore the UHI would be to look at where the majority of warming has occurred across the globe. The UHI should match where most people live. However, if you look at the 2006 global temperature anomaly (figure 2.), you find that the greatest difference in temperatures for the long term averages where across Russia, Alaska, far north Canada and Greenland and not where major urbanisation has occurred.
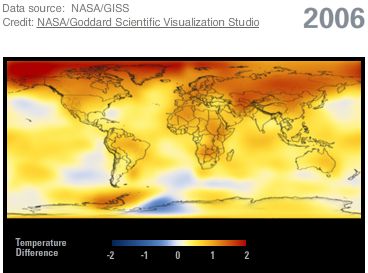

Figure 2. Using source data from NASA/GISS, this illustration shows the amount of change in global surface temperatures in 2006 from 1885.

The Urban Heat Effect has no significant influence on the record of global temperature trends.

Basic rebuttal written by mothincarnate


Update July 2015:

Here is a related lecture-video from Denial101x - Making Sense of Climate Science Denial


Last updated on 5 July 2015 by pattimer. View Archives

Printable Version  |  Offline PDF Version  |  Link to this page

Argument Feedback

Please use this form to let us know about suggested updates to this rebuttal.

Related Arguments

Further reading

  • The Modern Temperature Trend (by Spencer Weart). An in-depth history of surface temperature measurements since the late 1800's. If you find this lengthy article fascinating, you're a complete nerd (raises hand sheepishly).
  • The Power of Large Numbers (July 2007 by Tamino). Explores how we can discern with precision temperature trends with the statistical power of large numbers.

Further viewing

Comments

Prev  1  2  3  Next

Comments 26 to 50 out of 74:

  1. just how the software cuts off at the end of the record, its normal when you do a running average like that software does you will see a messed up end and beginning of the graph if the data set is missing a value if you go to the noaa website and download the data you will see lots of stations that have data dropouts which when that software at the other website above gets one of those at the end or beginning of the graph it will blow up or in this case down, what is important is the long term trend ftp://ftp.ncdc.noaa.gov/pub/data/ghcn/ you can plot all sorts of stuff from that data, temps gridded or not, adjusted or not, a couple data sets to choose from as well as precipitation amounts as well I think everyone should do a few, pick your home town and have a look, pick some rural stations and urban ones and graph them and see how they look. You might be surprised at what you see. I would also recommend just for your own sanity do a few single station plots and look up what the actual stats are for that station as far as where it is and what kind of quality it has. They are labeled as to what kind of local situation they are in like wooded or grassy plains etc etc.
  2. pedex, it's not only the running average that has that weird drop, the blu curve drops as well. There must be something wrong in how the data are processed. However, the simple average of stations doesn't tell you much. More so if you compare unadjusted data (the 778 stations) with adjusted data (the 173 stations).
  3. when a data point is missing an entry the ghcn data puts in a -9999 to show it, the software averaged that in and also tried to plot it which puts if off the chart its supposed to filter those out but for some reason it doesn't at the end of beginning of a plot sometimes
  4. pedex, strange that the missing data come mostly from the last few years. It may generate large errors also in the previous years. The very first step should be to check the code, no one is going to trust those numbers so blatantly wrong.
  5. Ive done some plots both ways, the old fashioned manual way and using the site I linked above, the result comes out the same. Rural stations tend to show no warming, urban stations do. It is especially evident in the US as well where there is lots of space between cities and lots of rural areas. Some places like the city where I live you can literally see the warming correlate with the development of the city where nearby rural stations show none at all. Like I said, plot some of your own and see what you get. Don't take my word for it or the word of this website because its arguments are pretty disingenuous in their own right from what I have seen.
  6. pedex, i'm not an expert but there are a few things i know. Comparing the raw data has no meaning. Comparing adjusted data from two nearby stations, one rural and one urban, tells us that the UHI effects exists, which we all know and it's corrected for. Full analysis, with homogenization, averaging and gridding separately the data from urban and rural station would be requied, which i'm not able to do by my self and that you have not done either. I'm left with the published papers by professionals, in part referenced in this blog post. If ever someone will come up with a serious demonstration of the fault in the current analysis, which incidentally appears to be in agreement with satellite data (no UHI effect there), i'm ready to listen. For sure i'm not going to trust anyone who in its spare time play around with a computer and a bunch of meaningless (to him) numbers, the whole story is far more serious than just this.
  7. actually if you work with the adjusted data it isn't corrected for properly either, same problems show up this blog cherry picked an instance and claimed it was valid for everything and that's hardly the case at all which has already been demonstrated furthermore guys like Jim Hansen have already claimed single stations can and do reflect what is going on with complete continents or even globally which of course is false in its own right satellite data doesn't go back far enough to be of much use
  8. Furthermore as per the 3rd paragraph of the explanation laid out in this blog about UHI is patently false and anybody that has checked out the weather stations and locations in the US can easily see that. Their excuses do not jive with reality at all. Most NOAA stations do not even come close to meeting NOAA's own specs. This is why as part of the data set the terrain factors are included for each station as far as urban or rural and what kind of land they sit on. That way you can easily separate stations subject to urban warming from those that are not influenced by it.
    Response: I would suggest reading the paper I reference in the 3rd paragraph, Peterson 2003, and then explain the flaws in their methodology. Noone is denying that there are urban weather stations that are warmer than their rural neighbours - but statistical analysis shows there are almost an equal number that are situated in cool parks and show a cooler trend. Either way, urban stations are normalised to their rural neighbours to ensure there is no contamination of the temperature record.
  9. Dr. Spencer's blog post of March, 16 might need someone to look into. Dr. Spencer will probably try to publish his results. I'm wondering where it goes wrong when he projects that the temperature rise in the US since 1979 is close to 0 (instead of close to 0.2 C/decade from the CRUTem3 dataset), when corrected for the UHI influence (his "true warming trend"). He will probably make a case that this is even worse when put in a global perspective, so contributing all current warming to the UHI effect, even though this contradicts his own analysis of satellite measurements (which are obviously not UHI contaminated). I can think of a few things (choosing stations with very low population density vs very high population density will probably lead to relatively small regional analyses, which can, combined with the relatively short period of measurements be attributed to pattern changes instead of global warming). However, I'm not sure, this is only just speculation of course, but it shows a major deviation from other studies, so it is worth mentioning.
  10. Arjan, i didn't go yet throgh the details of Spencer's analysis. What's surprising is that other peer-reviewed studies (e.g. Peterson et al. 2005) already checked for population and other effect. I do not fully understand why Spencer decided to use a different dataset which didn't pass through the same quality control as GHCN. This may at least in part explain the different results.
  11. well, i may not as professional and presice as all of you commented on the issue above, and i don't really know the jargon you are talking, but i would like to ask several important questions based on logics, becasue i also interested in the matter, but due to the lack of basic tools and information i could not present a whole image to all of you. my points as as follow : 1. do you think that the sun is the major energy resoure of the surface of the earth (no matter in which form it store,like coal, oil, living creatures, organic matters,carbohydrate...and so on)beside the nuclear reaction the core of the earther is under going and before we discovered and stareted to use nuclear energy? 2.If you do belive that the sun is the major energy supplier to the earther surface, then where those engergy the surface of the earth from the sun got go? It dissapeared by it's self or they just stored in other form rather the heat? 3.Yes i do believe the urben area is much hotter than the rural area, but does that mean UHL is the major contributor to global warming? becuae we all know that about 71% of the earth surface is cover by water, and the propotion of rurual area must be more than times to urban area(according to an estimation rurual area only account for 3% of the earth surface, even if the average tempreture of the urban area is 10 times than the other part of the world , the average tempreture rise it can cause if is only 0.27 centidegree. 4.Look at the the energy we realised from the engery store in other form the near 100 yeas, i think it's not a big quesiton to understand glob warming Got to go, to be continue next time if i were bump into this forum agian next time.
  12. This page starts with the statement that "A paper by Ross McKitrick ... and Patrick Michaels ... concludes that half of the global warming trend from 1980 to 2002 is caused by Urban Heat Island." (McKitrick & Michaels). It then provides evidence for the contrary view. An obvious question is not addressed as far as I can see: are the arguments presented by McKitrick & Michaels wrong, and, if so, why?
  13. Hadfield does have a point. The summary paper linked to has arguments against several of the explanations presented here. Have there been any responses to their paper that address these concerns?
  14. Hadfield - you might like to look at Are Temperature Trends affected by Economic Activity? for a starting point if you want reference to the 2004 effort. For the 2008 version, then an analysis was published here
  15. If you thought our cities are getting warmer, you're right. "Bureau of Meteorology researchers have found that daytime temperatures in our cities are warming more rapidly than those of the surrounding countryside and that this is due to the cities themselves."
  16. Would be interesting to find out what the total daily anthropogenic heat addition to the planet from power generation (incl nuclear), cars etc looks like in W/m2. Can anyone direct me to such a study - could not find one from a cursory look.
    Response: [muoncounter] See the Waste heat thread. Short answer: 1% of greenhouse warming.
  17. JohnR - Or for a bit more wasted heat, the extremely long discussion (>350 comments, unfortunately mostly circular in topic) at Waste heat vs greenhouse warming. And, as muoncounter pointed out, about 1% of greenhouse gas warming, a forcing of ~0.028 W/m^2 waste heat compared to 2.9 W/m^2 greenhouse effect forcing.
  18. Thanks #42, far less than geothermal (~0.08W/m^2)
  19. Could I ask how this paper by Yang et al 2011 relates to this post. It's looking at anomalies but shows different trends for different classes of urbanisation in China. Thanks http://www.agu.org/pubs/crossref/2011/2010JD015452.shtml
  20. Fitz, The results are consistent with other measurements of urbanization effects.
  21. As EtR said, this seems like a regional study which yields results similar to those found previously. Basically, rapid urbanization around a temperature monitoring station can bias the results of that station. Which is why global temperature anomaly results have always adjusted for this effect. This is thus further confirmation that the adjustments are correct... though the fact that satellite temperature records (which obviously aren't impacted by UHIs), analyses based only on rural stations, and various other studies ALSO match has long made this a moot point.
  22. Thanks for the replys!
  23. Counties in Calafornia have shown evidence of the heat island effect. (-Snip-)
    Response:

    [DB] Posting just a graphic (please restrict widths to 450 pixels or less) without demonstrating the significance of it helps no one.  And therefore proves nothing.

  24. Roh234 - read the Intermediate version. Noone doubts that urban heat island exists - thats why the effect is removed by comparisons with rural stations in the global records.
  25. I'll think on this. But I'm confused about something. In the Basic explanation of why UHI Effect is not influencing temperature trends, it states "the difference between ideal rural sites compared to urban sites in temperature trends has been very small." [2nd Paragraph, just before Figure 1] In the Intermediate explanation, it is stated [in the First Paragraph] "They compare urban long term trends to nearby rural trends. They then adjust the urban trend so it matches the rural trend. The process is described in detail on the NASA website (Hansen 2001)." So of course the urban and rural trends *should* be the same, because of the adjustment. Am I missing the obvious?

Prev  1  2  3  Next

Post a Comment

Political, off-topic or ad hominem comments will be deleted. Comments Policy...

You need to be logged in to post a comment. Login via the left margin or if you're new, register here.

Link to this page


The Consensus Project Website

THE ESCALATOR

(free to republish)


© Copyright 2024 John Cook
Home | Translations | About Us | Privacy | Contact Us