Climate Science Glossary

Term Lookup

Enter a term in the search box to find its definition.

Settings

Use the controls in the far right panel to increase or decrease the number of terms automatically displayed (or to completely turn that feature off).

Term Lookup

Settings


All IPCC definitions taken from Climate Change 2007: The Physical Science Basis. Working Group I Contribution to the Fourth Assessment Report of the Intergovernmental Panel on Climate Change, Annex I, Glossary, pp. 941-954. Cambridge University Press.

Home Arguments Software Resources Comments The Consensus Project Translations About Support

Bluesky Facebook LinkedIn Mastodon MeWe

Twitter YouTube RSS Posts RSS Comments Email Subscribe


Climate's changed before
It's the sun
It's not bad
There is no consensus
It's cooling
Models are unreliable
Temp record is unreliable
Animals and plants can adapt
It hasn't warmed since 1998
Antarctica is gaining ice
View All Arguments...


Username
Password
New? Register here
Forgot your password?

Latest Posts

Archives

Global cooling - Is global warming still happening?

What the science says...

Select a level... Basic Intermediate

All the indicators show that global warming is still happening.

Climate Myth...

It's cooling

"In fact global warming has stopped and a cooling is beginning. No climate model has predicted a cooling of the Earth – quite the contrary. And this means that the projections of future climate are unreliable." (source: Henrik Svensmark)

At a glance

Earth's surface, oceans and atmosphere are all warming due to our greenhouse gas emissions, but at different rates. Some places are also warming much faster than others: parts of the Arctic for example. That variability is partly because other phenomena act to offset or enhance warming at times. A good example are the effects of La Nina and El Nino, an irregular variation in winds and sea surface temperatures over the tropical eastern Pacific Ocean that can influence temperatures and rainfall patterns right around the world.

El Nino causes even warmer years whereas La Nina tends to peg temperatures back to an extent. Thus 2023 – an El Nino year - was the warmest year on record, according to the USA-based National Oceanic and Atmospheric Administration, but other recent years have not been far behind – 2016 and 2019 are in second and third place respectively. The worrying thing is that 2019 only saw a mild El Nino. And even with a La Nina featuring, 2021 and 2022 were, respectively, still the seventh and sixth hottest years on record.

The year 1998 featured a massive El Nino and consequent temperature spike that was a strong outlier, well above the steady upward trend. That spike and the subsequent return to a more “normal” warming pattern led to claims in the popular media that global warming had “paused” or had even stopped. This was a typical misinformation tactic that, as usual, time has proved wrong. As things currently stand, the top ten warmest years have all been since 2010 and 1998 is nowhere to be seen any more. By modern standards, it simply wasn't warm enough.

Please use this form to provide feedback about this new "At a glance" section. Read a more technical version below or dig deeper via the tabs above!


Further details

In the years following 1998, at the time the hottest year on record, there was a concerted misinformation campaign to convince the public that global warming had variously slowed down, stopped or even that we were entering a period of cooling. Of course, we now know that such claims were nowhere near correct. In today's top ten ranking of warmest years, the year 1998 is nowhere to be seen. It simply wasn't warm enough. So let's take a look at how the claims came about, because they reveal insights into the methodology of those who design and spread misinformation.

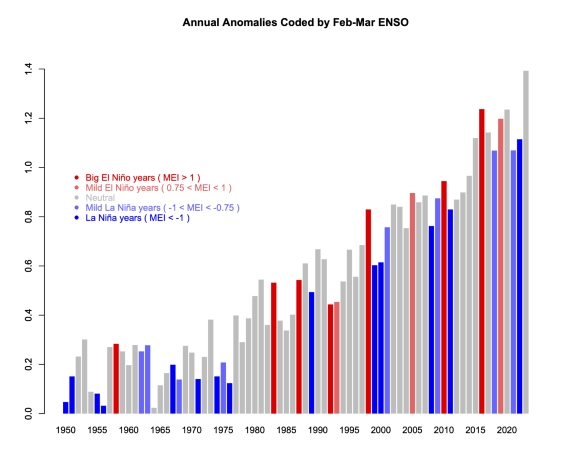
The entire planet continues to accumulate heat due to the energy imbalance created through our greenhouse gas emissions. Earth's atmosphere is warming. Oceans are accumulating energy. Land absorbs energy and ice absorbs heat to melt. Year to year ups and downs in these things are simply noise, reflecting variations in how that heat is moved around the planet and what other influences are at work, such as the irregular El Nino Southern Oscillation (ENSO) that can nudge the global temperature one way or another by up to 0.3C. That's why 1998 was such a warm outlier: it coincided with a very strong El Nino. El Nino conditions always warm things up whereas La Nina conditions cool things down (figure 1).
GISTEMP-ENSO-coded-plot from RealClimate

Figure 1: GISTEMP anomalies to end-2023 (with respect to late 19th Century), coded for ENSO state in the early spring - red is El Nino, blue La Nina. 2023 is in grey because that El Nino did not develop until later in the year. Graphic courtesy of Realclimate.

Climatologists routinely use multi-decadal blocks of time when presenting temperature trends for a very good reason. Such blocks allow you to stand back and look at the bigger picture. Due to the noise, taking a much shorter time-span – say just five or ten years – allows you to say anything you like about trends, depending on the particular block you pick.

For example, if you picked a short run of 5-10 years ending in 1998, you could have – if you were so inclined – said, “look how fast it's warming!” Likewise, taking a number of years starting with 1998, you could have made the equally invalid claim that global warming had stopped. And of course, that claim was made, vociferously, in the early-mid 2000s. It was a classic example of cherry-picking: the manifestly unscientific practice of choosing the data that supports the argument one is paid to make on behalf of those who sponsor misinformation campaigns. Once you know about such tricks, you can challenge them yourself. You can ask someone why they showed such a short temperature record when showing a much longer one is the normal practice.

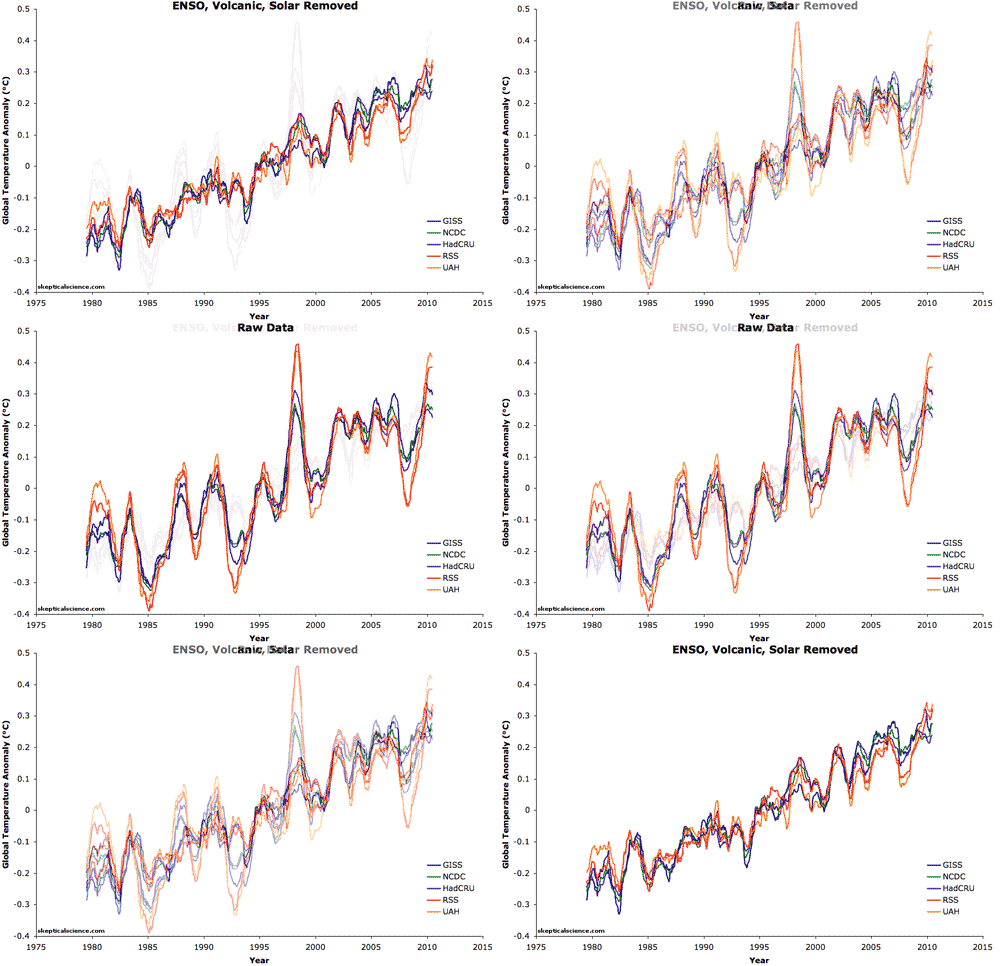
It is difficult but technically possible to filter out the noise described above from temperature datasets. In the paper Foster and Rahmstorf (2011) the authors used the statistical technique of multiple linear regression to filter out the effects of ENSO, solar and volcanic activity (Figure 2). They found that the underlying global surface and lower atmosphere warming trends have in fact remained steady in recent years. There's still noise in there but nowhere near as much. We were still warming all along.

before/after filtering

Figure 2: Five datasets of global surface temperature and lower troposphere temperature are shown before and after removing the short-term effects of the El Niño Southern Oscillation (ENSO), solar variability, and volcanic aerosols.  A 12-month running average was applied to each dataset.

Last updated on 4 June 2024 by John Mason. View Archives

Printable Version  |  Offline PDF Version  |  Link to this page

Argument Feedback

Please use this form to let us know about suggested updates to this rebuttal.

Related Arguments

Further reading

Update

On 21 January 2012, 'the skeptic argument' was revised to correct a minor formatting error.

Denial101x video

Here is a related video lecture from Denial101x - Making sense of climate science denial

Comments

Prev  1  2  3  4  5  6  7  Next

Comments 26 to 50 out of 175:

  1. Riccardo Perhaps my reference to Latif implied I was focusing on a relationship between short term and long term variability. There may be one but that wasn't my intention. But trying to say too much in too few words may have caused confusion. I referred to the "past few years". Being more specific, the GRL data at issue is from 2005 up to 2009. When Trenberth said "...we can't account for the lack of warming at the moment and it is a travesty that we can't" he was referring to a similar period. He wasn't talking about a seasonal or yearly basis. He has subsequently made it clear that, his intent was to say that with todays technology we should be able to find the effect of the increased trapped heat, but we haven't yet been able to. (My reading of his meaning is that we will be able to, given all the effort being put on it.) I've not concluded that "we don't understand enough about the natural forcing elements" as you suggest. The point I was making is that Latif has made that conclusion; specifically about "internal decadal variability". He was talking about the North Atlantic in that particular case. In fact he is "lobbying" for a research program to be able to predict that variability. He wasn't referring to El Nino and neither was I. (I don't think you mean to say that we know enough about all the natural forcing elements except for short term phenomena like El Nino. But your comment seems to imply that.) So, to belabor the "arbitary mixing" a bit further: (a)the lack of warming that Latif suspects is due to natural forcing that we need to understand better and.. (b)Trenberth's frustration with our inability to find the warming that has to be there based on the absorbed/reflected radiation imbalance... are connected in a way. They relate to the same earth during the same period of time. It doesn't seem to arbitrary to wonder if the long term cycle in (a) is in a phase of it's cycle that affects the warming in (b). I shouldn't be so presumptious to think that I know the answer. I don't. But I reserve the right to wonder if understanding the decadal oscillations of the oceans and an improved ability to measure the heat content of the oceans would lead us to an answer.
  2. Doug Cannon, the fact that we still cannot identify the details of how heat goes around in the climate system in the short term (four years is not that much) should not rise any alarm. Altough some phenomena show a (sort of) cyclic behaviour they all average out in the long run. For example, look here for the PDO. In the end, they could at best justify some "noise" in the trend; no overall energy balance has been altered and these "oscillation" can just move around the heat through the climate system. Indeed, this is what Trenberth refers to in the stolen email, look at the other things he said.
  3. Riccardo, "no overall energy balance has been altered" I totally agree. That's the point. Actually, one of my sources for Trenberth's position is last week's "Economist". Unless they have totally misinterpreted his comments he believes the data show an energy imbalance. Since we all know that can't be true, something is wrong with the data. I think a fair paraphrasing of all Trenberth's comments would be: We don't have the right data. Yet. But we'll find it. Then the data will demonstrate there is no imbalance.
  4. Doug Cannon, we get always back to the same point, short and long term. There's nothing wrong in the data, just not accurate enough to details the short term variability which we all would like to account for. The long term global warming is put aside and not questioned at all by Trenberth. Rememebr also that there's not just black or white, we know everything or we know nothing. Indeed, it's well known that part, the largest probably, of the short term variability can be explained by ENSO alone. This part is know, but it's not all; the remainder comes from other, smaller, contributions.
  5. Doug, just after having hit the submit button, i ended up in Trenberth's own words: "It relates to our ability to track energy flow through the climate system. We can do this very well from 1992 to 2003, when large warming occurred, but not from 2004 to 2008. The quote refers to our observation system which is inadequate to observe Earth's energy flows at the accuracy needed to understand small fluctuations in climate;" Take his words, much better than mine.
  6. Does this data only go back to 1950?
  7. Note that NODC has updated the ocean heat content figures through 2009. You may want to update your graph.
  8. If your kid grows an inch and a half each year between fifth grade and eighth grade and then doesn't grow any more through high school, is he still growing? No. And if someone says "but but but his average height during high school is taller than his average height during middle school!" does that change your mind? It's not still warming. It's still warm. Perhaps it shouldn't be - the known natural forcings over the last decade should perhaps have caused cooling but haven't yet. Is 1998 "cherry picking one year?" No. It's one year of natural variability - but 11, going on 12, years of CO2 emissions. And 1998 is warmer than - or if you use GISS, within 0.01 deg C as warm as, each year since then. If 11 becomes 15 or 20, that's the skeptics' point - - if the climate is as CO2-sensitive as is thought, then no single year of natural variability should offset two decades of cumulative CO2 buildup. 11 hasn't become 15 or 20, so I don't think that "it's still warm though it's neither warming nor cooling" disproves your thesis. So one has to ask, why continue to belabor the point? I understand that "it's still warm even though perhaps it shouldn't be" is complex and you might lose people at the lowest common denominator, but when you oversimplify to the point that you've reduced the thesis to a statement that isn't really accurate, you lose some critical thinkers - as with the "anthropogenic cause of tree ring divergence," this practice probably fuels more skepticism than it quells.
    Response: I understand the use of metaphors but eventually metaphors get so tortured, the usefulness fades. In the case of the 'growing kid' metaphor, an appropriate comparison would be if you had a child that would grow 2 inches in one year, shrink 1 inch the next year, grow 1.5 inches the year after that, shrink .5 inches the next year. His height is shooting up and down but gradually in the long term rising. But really, that's just a weird metaphor!

    Don't be beguiled by the year 1998. Be aware that the HadCRUT record which finds 1998 as the hottest year on record doesn't include the whole globe - it excludes regions where the warming trend is greatest. A fully global temperature record finds 2005 as the hottest year on record, 2009 as the 2nd hottest year on record and a statistically significant warming trend throughout this period.
  9. .....and GISS is Northern Hemisphere-biased. Either way, even the measures that put 2005 as the warmest put it at 0.01 deg C above 1998. I.e., about even. 1 year of natural variability offsetting 11 years of CO2 isn't "cherry picking one year." If it's "still warming" then the temperature should still be rising - rather than simply still warm relative to the recent past. The height analogy is a good one because the temperature has remained within a few tenths of a degree C below to, by some measures one hundredth of a degree above the 1998 mean. It's been flat. Perhaps it's been flat DESPITE natural forcings that ought to have pushed it down. So say that.
  10. Pat T, simplification is a quite risky game. Thinking of a monotonic warming when a monotonic forcing is applied is such a game. Look at the instrumental record and you'll see many periods of no warming and yet overall the temperature has increased. From 2002 to 2009 all the yearly averaged temperatures are within about 0.14 °C, i.e. +/- 0.07 °C. This is what the numbers say, undisputable. But this is only the begining of the story, not the end. Next step is understand what those numbers mean. To do this you have to look at how temperature behaves. You'll soon discover that there's an interannual varibility of about +/- 0.1 °C and that, in turn, in ten years you can not (statistically) assess a trend lower than about 0.2 °C/decade. Look at this graph (thanks to Tamino); temperature fluctuates between the lower and the upper bounds. You can (statistacally) say that temperature is still following the trend line until it goes out of the bounds. We are not there, not even close. This is as far as the numbers are concerned. Then comes the physics, explained by John in this post. Not the numbers nor the physics make us think it's cooling.
  11. Great site and page thank you! One very small cavil ... "Since 1970, the Earth's heat content has been rising at a rate of 6 x 10^21 Joules per year. In more meaningful terms, the planet has been accumulating energy at a rate of 190,260 GigaWatts. Considering a typical nuclear power plant has an output of 1 GigaWatt, imagine 190,000 nuclear power plants pouring their energy output directly into our oceans." The value 6 x 10^21 Joules per year has one significant digit (similar in accuracy to other figures one the page, like 0.77 ± 0.11). So it gives a misleading idea of accuracy to say "190,260 GigaWatts", with 5 significant digits. It would be better to stick to one significant digit, and conclude: "the planet has been accumulating energy at a rate of about 200,000 GigaWatts" and then also adjust the nuclear power plan count accordingly (bearing mind as well that Barry Brook's comment 5 above challenged the 1GW per plant estimate).
  12. nice article, very clear what you are getting at. Question: Don't the models take the Oceans (as a heat sink) into account? If so, how have they got it so wrong?
  13. Very interesting article. About the 6 x 10^21 Joules per year (200,000 GWth), the comparison to nuclear power plants is an unfounded comparison because what is heating the earth is the sun. If we consider that the sun is hitting the earth with 1300 W/m^2, and the radius of the earth is 6.3 x 10^6 meters, the energy input by the sun is: Insolation x Area = 1300 W/m^2 * pi*((6.3*10^6)^2) = approx. 160,000,000 GW. Compared to 200,000 GW of warming. I think this is a better comparison. So approximately 0.12% of the insolation hitting the earth is being absorbed and held. If 200,000 GW is entering an ocean of 100,000,000 mi^2 and 0.25 miles deep, the change in ocean temperature is (200,000x10^6 kJ/s)/((100,000,000 mi^2)(0.25mi)*(4x10^9 m^3/mi^3)*(1000kg/m^3)*(4.184kJ/kgK)) = 5*10^-10 K/s = 0.015 K/year = 1.5 Kelvin/century which is close to the temperature change of the earth. Kudos goes to the person who made the very good estimation in the above article of the change in internal energy of the oceans. However, I am an experimentalist. The second comment I would like to pose is about taking temperature data. The scope of the experiment is that the earth's surface area is 200,000,000 mi^2, and temperature data from 1880 - 1961(Tiros I launched) was taken with < 1,000-10,000 thermometers and averaged to get a full year's average temperature. Making a gross assumption that the thermometers are homogeneously dispursed around the globe, each thermometer must have encompassed a region from >20,000 - 200,000 mi^2. To put that into perspective, Texas is 250,000 mi^2 and West Virginia is approximately 25,000 mi^2. I question whether the data obtained can produce an average annual temperature value within 0.5°C, let alone 0.1°C. If these values are certain, as given by Smith and Reynolds (2004,2005) found on the NOAA website, I question what can be deduced from them. The average surface temperature of the earth is not measured directly just like the temperatures from past climates were not measured directly. However, past climates deviated in degrees over millenia compared to tenths of a degree over decades. The same analysis goes for any water temperature measurement that was done. To derive an average water temperature from measurements of an ocean that is on the order of 100,000,000 mi^2 in surface area and on the order of 0.25 miles deep is unfounded. It is a vast volume to extrapolate precise and accurate temperature data from. This analysis provides me with enough skepticism to wait for more conclusive data.
  14. kwoods01, you're right that absolute temperatures can vary at fine spatial scales, such that it would be difficult to calculate an accurate average temperature based on a limited number of thermometers. But temperature anomalies are spatially correlated over very broad areas. Thus, it's possible to come up with a very good estimate of changes in the global mean surface temperature based on a relatively small number of stations (i.e., hundreds, not millions) as long as they're reasonably well distributed. Finally, "waiting for more conclusive data" isn't actually possible, since we can't freeze all emissions of greenhouse gases while we wait. The decision to continue with business as usual or to start reducing emissions will have to be made with imperfect information. If we decide to just continue with business as usual while we wait for the scientists to do their thing, that will lock in a lot of warming that can't then be recalled if we later decide that the science is convincing after all.
  15. April has been record breaking in Connecticut for warm temperatures. Today it will be 77 degrees- after a month that has been 6.7 degrees above normal. Tomorrow 85 degrees, and Sunday 90. Of course this is day to day weather- however, warming of this magnitude after years of milder winters and earlier springs is troubling to say the least. The climate models always predicted that after 2010 we would begin to see record warming-is this 'that' beginning?
  16. And its been 90 here (on the coast of that great bowl of oil and vinegar we call the Gulf of Mexico) already - two days running. However, this new study suggests that we ain't seen nothing yet. "Researchers for the first time have calculated the highest tolerable "wet-bulb" temperature and found that this temperature could be exceeded for the first time in human history in future climate scenarios if greenhouse gas emissions continue at their current rate."
  17. Oh joy, we're about to get another revival of this argument http://climatedepot.com/a/6574/search.asp?cx=partner-pub-2896112664106093%3Am5ewh74pu5c&cof=FORID%3A9&ie=ISO-8859-1&q=global+cooling "Geologist Declares 'global warming is over' -- Warns U.S. Climate Conference of 'Looming Threat of Global Cooling' "
  18. We have just experienced the warmest January-April period on record when considering the combined land and ocean temps. Here is the link. http://www.ncdc.noaa.gov/sotc/index.php#global_highlights
  19. I'm sorry but I think I'm missing something. Both surface and atmospheric measurements show cooling, or, at least, minimal warming since 2002. How can the planet be accumulating heat when over the course of 8 years global temperature records show it has not really warmed at all?
  20. Michael, I think one of the things you're missing is taking a moment to read John's post, or if you have and believe you've found something wrong there, perhaps you could mention it?
  21. michaelkourlas - why do you think John spends time on discussing the ocean heat above? Pay particular attention to John's first 2 sentences above.
  22. Aloha All, I am new here but I am not new to the subject matter. Pardon me for writing simply. I am retired and simplicity appeals to me. It is becoming difficult to pretend nothing is happening. Even if we discard anthropogenic causation, we cannot disregard our observations. The earth is getting warmer every year. 2010 is already the hottest year on record. 128.3°F was measured at the town of MohenjuDaro, Pakistan, on Wednesday, May 26. As I write this, temperatures in parts of India are 125°F and both the flora and fauna are dying. How is that possible? Well, in fact, it IS possible. The earth used to be much warmer than it is now. Before humans existed. Whether the fluctuation is natural or not doesn't concern me any longer. People will rationalize arguments that the ecosphere is not warming because they don't want to believe it is. Either way the outcome is the same. We are entering an extinction event. We will last longer than Atlantic Bluefin tuna; they will be extinct within a couple of years. The human race may have 25 years left...or fifty...or ten. Even assuming that we are simply at the beginning of the next natural Milankovitch warming cycle or, on a shorter scale, a Bond Event or a natural orbital perturbation or a solar max or for no discernible reason whatsoever, we can interpolate that the oceans will become net exporters of CO2 before 2040 just as the forests are now. By that time we will have a CH4 problem. If we happen to be in one of the 'abrupt' climate changes, we can expect temperature increases within a few years to a few decades, depending on the causality, to increase right past the sweet spot at which humans can survive. Potentially thirty to fifty degrees Fahrenheit warmer. We have an historical record of those sorts of temperatures. And that assumes the 20 BILLION tons of CO2 we are happily pumping into the atmosphere annually is not a factor. That the 7 billion people on earth are not a factor. That the hydrological cycle is beginning to fluctuate is not a factor. That the annual loss of millions of Hectares of arable land to erosion and millions more to desertification are not factors. Because, in fact, they are no longer factors if we have jumped the shark. The tropics have encroached into sub-tropical zones by four degrees of longitude in the recent past. The weather, never predictable, was at least stable within recorded history. Now it isn't. Now EVERY flood is a 'hundred year' or 'thousand year' flood. Now there are going to be hurricanes for which another level of intensity will have to be made. Category 6. Now the once-predictable seasons of the year are changing. Everywhere. Given that weather is dynamic, I still defy anyone to tell me the weather where they are is not anomalous. The type of anomaly and the direction of temperature variation at any given point is of no import. That we cannot account for some of the trapped heat merely means we don't know where to look. It could be hiding in the AMO but it could just as easily be involved in a previously unobserved chemical reaction of which we know nothing. My suspicion is that it is charging the clathrate gun but I do not care to debate postulates. Imagine a spinning top as a metaphor. As the rotation decreases, a wobble begins but it wobbles through it's steady state enough that the wobble is barely noticeable. During that period three observers could debate whether it is speeding up, slowing down or naturally imbalanced at a steady momentum. The only way to know is when it collapses. Predicting the collapse event is not possible until it happens; there is a real possibility that it might never collapse. Schrödinger's top. My belated point is this: If you live on Easter Island, cutting down coconut trees for the nuts might seem like a good idea until you have cut down the last one. After that, further debate about whether to do it becomes meaningless. a hui hou T
  23. Mahalo and Aloha, Dr. Tom!
  24. Aloha e, Doug. Mahalo for your kind words. I shall not post regularly but it is really a very pleasant place to visit. a hui hou, kakoa T
  25. It has been unusually quiet from Mr. Svensmark and the rest of the "it's the sun" fraction of the denialist movement over the last six months. For good reason. Instead of continuing cooling as they predicted in 2008 and early 09, temperatures bounced back with a vengeance once the La Nina calmed down. The last 12 months is the hottest 12 months in recorded history, with even the skeptic run UAH dataset setting records, despite continuing tweaks to bring the anomalies down. With all time high temperature records being set when the cooling effect from the deepest solar minimum in more than a century is at its peak, Svensmarks hypothesis has failed in a spectacular fashion. It would be good if the MSM would start focusing their attention on the massive failures of the denialist predictions instead of harassing the real scientists.

Prev  1  2  3  4  5  6  7  Next

Post a Comment

Political, off-topic or ad hominem comments will be deleted. Comments Policy...

You need to be logged in to post a comment. Login via the left margin or if you're new, register here.

Link to this page


The Consensus Project Website

THE ESCALATOR

(free to republish)


© Copyright 2024 John Cook
Home | Translations | About Us | Privacy | Contact Us