Climate Science Glossary

Term Lookup

Enter a term in the search box to find its definition.

Settings

Use the controls in the far right panel to increase or decrease the number of terms automatically displayed (or to completely turn that feature off).

Term Lookup

Settings


All IPCC definitions taken from Climate Change 2007: The Physical Science Basis. Working Group I Contribution to the Fourth Assessment Report of the Intergovernmental Panel on Climate Change, Annex I, Glossary, pp. 941-954. Cambridge University Press.

Home Arguments Software Resources Comments The Consensus Project Translations About Support

Bluesky Facebook LinkedIn Mastodon MeWe

Twitter YouTube RSS Posts RSS Comments Email Subscribe


Climate's changed before
It's the sun
It's not bad
There is no consensus
It's cooling
Models are unreliable
Temp record is unreliable
Animals and plants can adapt
It hasn't warmed since 1998
Antarctica is gaining ice
View All Arguments...


Username
Password
New? Register here
Forgot your password?

Latest Posts

Archives

Global cooling - Is global warming still happening?

What the science says...

Select a level... Basic Intermediate

All the indicators show that global warming is still happening.

Climate Myth...

It's cooling

"In fact global warming has stopped and a cooling is beginning. No climate model has predicted a cooling of the Earth – quite the contrary. And this means that the projections of future climate are unreliable." (source: Henrik Svensmark)

At a glance

Earth's surface, oceans and atmosphere are all warming due to our greenhouse gas emissions, but at different rates. Some places are also warming much faster than others: parts of the Arctic for example. That variability is partly because other phenomena act to offset or enhance warming at times. A good example are the effects of La Nina and El Nino, an irregular variation in winds and sea surface temperatures over the tropical eastern Pacific Ocean that can influence temperatures and rainfall patterns right around the world.

El Nino causes even warmer years whereas La Nina tends to peg temperatures back to an extent. Thus 2023 – an El Nino year - was the warmest year on record, according to the USA-based National Oceanic and Atmospheric Administration, but other recent years have not been far behind – 2016 and 2019 are in second and third place respectively. The worrying thing is that 2019 only saw a mild El Nino. And even with a La Nina featuring, 2021 and 2022 were, respectively, still the seventh and sixth hottest years on record.

The year 1998 featured a massive El Nino and consequent temperature spike that was a strong outlier, well above the steady upward trend. That spike and the subsequent return to a more “normal” warming pattern led to claims in the popular media that global warming had “paused” or had even stopped. This was a typical misinformation tactic that, as usual, time has proved wrong. As things currently stand, the top ten warmest years have all been since 2010 and 1998 is nowhere to be seen any more. By modern standards, it simply wasn't warm enough.

Please use this form to provide feedback about this new "At a glance" section. Read a more technical version below or dig deeper via the tabs above!


Further details

In the years following 1998, at the time the hottest year on record, there was a concerted misinformation campaign to convince the public that global warming had variously slowed down, stopped or even that we were entering a period of cooling. Of course, we now know that such claims were nowhere near correct. In today's top ten ranking of warmest years, the year 1998 is nowhere to be seen. It simply wasn't warm enough. So let's take a look at how the claims came about, because they reveal insights into the methodology of those who design and spread misinformation.

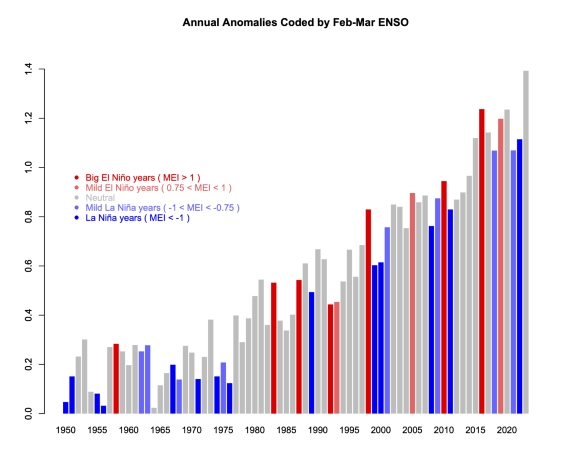
The entire planet continues to accumulate heat due to the energy imbalance created through our greenhouse gas emissions. Earth's atmosphere is warming. Oceans are accumulating energy. Land absorbs energy and ice absorbs heat to melt. Year to year ups and downs in these things are simply noise, reflecting variations in how that heat is moved around the planet and what other influences are at work, such as the irregular El Nino Southern Oscillation (ENSO) that can nudge the global temperature one way or another by up to 0.3C. That's why 1998 was such a warm outlier: it coincided with a very strong El Nino. El Nino conditions always warm things up whereas La Nina conditions cool things down (figure 1).
GISTEMP-ENSO-coded-plot from RealClimate

Figure 1: GISTEMP anomalies to end-2023 (with respect to late 19th Century), coded for ENSO state in the early spring - red is El Nino, blue La Nina. 2023 is in grey because that El Nino did not develop until later in the year. Graphic courtesy of Realclimate.

Climatologists routinely use multi-decadal blocks of time when presenting temperature trends for a very good reason. Such blocks allow you to stand back and look at the bigger picture. Due to the noise, taking a much shorter time-span – say just five or ten years – allows you to say anything you like about trends, depending on the particular block you pick.

For example, if you picked a short run of 5-10 years ending in 1998, you could have – if you were so inclined – said, “look how fast it's warming!” Likewise, taking a number of years starting with 1998, you could have made the equally invalid claim that global warming had stopped. And of course, that claim was made, vociferously, in the early-mid 2000s. It was a classic example of cherry-picking: the manifestly unscientific practice of choosing the data that supports the argument one is paid to make on behalf of those who sponsor misinformation campaigns. Once you know about such tricks, you can challenge them yourself. You can ask someone why they showed such a short temperature record when showing a much longer one is the normal practice.

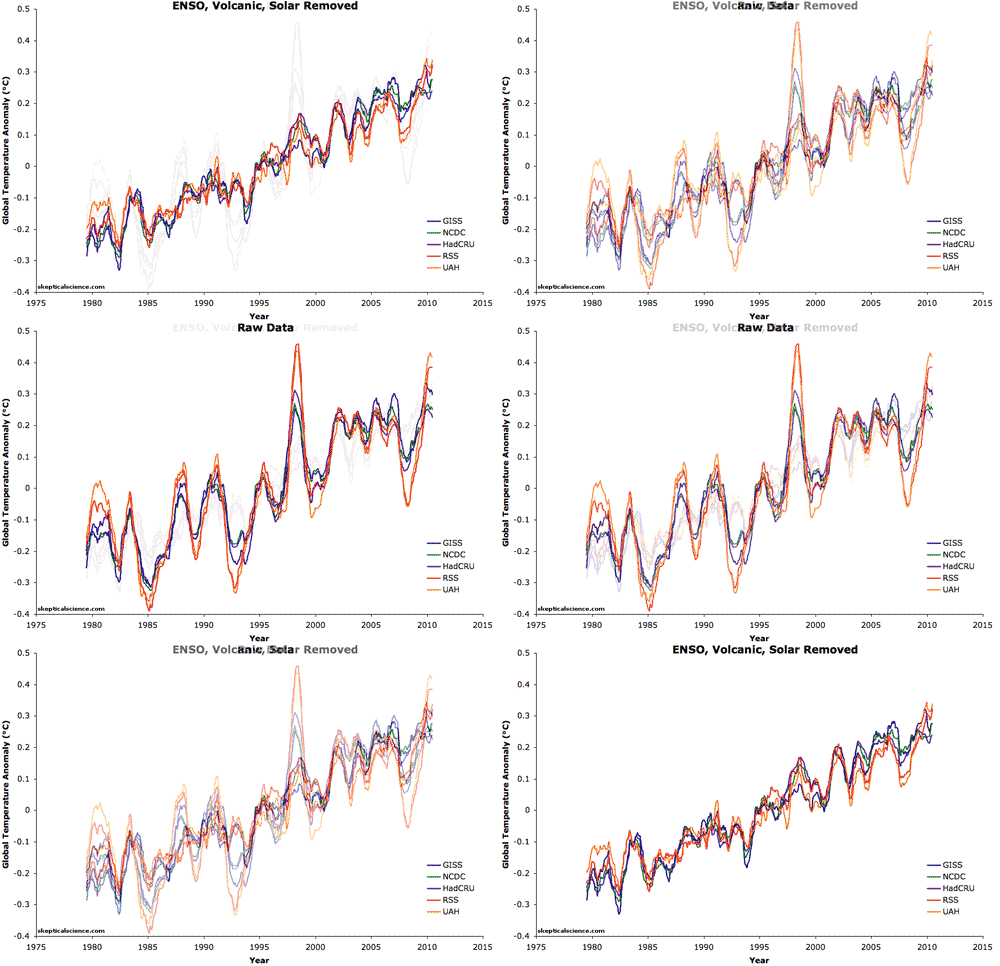
It is difficult but technically possible to filter out the noise described above from temperature datasets. In the paper Foster and Rahmstorf (2011) the authors used the statistical technique of multiple linear regression to filter out the effects of ENSO, solar and volcanic activity (Figure 2). They found that the underlying global surface and lower atmosphere warming trends have in fact remained steady in recent years. There's still noise in there but nowhere near as much. We were still warming all along.

before/after filtering

Figure 2: Five datasets of global surface temperature and lower troposphere temperature are shown before and after removing the short-term effects of the El Niño Southern Oscillation (ENSO), solar variability, and volcanic aerosols.  A 12-month running average was applied to each dataset.

Last updated on 4 June 2024 by John Mason. View Archives

Printable Version  |  Offline PDF Version  |  Link to this page

Argument Feedback

Please use this form to let us know about suggested updates to this rebuttal.

Related Arguments

Further reading

Update

On 21 January 2012, 'the skeptic argument' was revised to correct a minor formatting error.

Denial101x video

Here is a related video lecture from Denial101x - Making sense of climate science denial

Comments

Prev  1  2  3  4  Next

Comments 51 to 75 out of 86:

  1. Is "Global dimming" an issue here at all? Or does it exist?
  2. Thanks for the reminder, Theodore. Yes, "global dimming" does exist. John Cook talks about it in a related thread called Why did climate cool in the mid-20th Century?. He's got a reference to Wild et al. 2007, which discusses global dimming in some detail.
  3. Thank you. I have mostly followed the science through documentaries and some times it is hard to know what is accepted by the scientific community and what not. Good to know I have not been telling porkie pies whilst explaining climate change to people :)
  4. Response: Levitus' data covers only the upper ocean heat which shows more variability than the total ocean heat. Measurements of ocean heat down to 2000 metres deep show that the oceans are still accumulating heat. Would you please cite a source for that statement? I am unable to find such a measurement and following the link only dumps you back at this site. The NODC data shows a suggestive resemblance to atmospheric temperature data, delayed a few years.
    Response: The source is von Schuckmann 2009:


    Figure 2: Time series of global mean heat storage (0–2000 m), measured in 108 Joules per square metre.
  5. Can anyone suggest a mechanism by which greenhouse warming bypasses the atmosphere, bypasses the upper 700 m of ocean, and warms the ocean between 700 and 2000 m? This seems like it will be required for the earth to continue warming.
  6. TomJones at 03:01 AM on 6 August, 2010 Not sure I understand your argument Tom, since the observed increase in deep ocean heat (e.g. [*]) doeesn't require that this bypasses the surface. For example we know that during La Nina years there is a shift in the location of the thermocline in the Pacific with enhanced upwelling of deep cold waters. This will have the effect of transferring heat from warmer waters above the thermocline to the deeper oceans. Likewise there is increasing evidence on some of the mechanisms by which thermal energy can be transferred to deeper ocean waters in a warming world [**] There's nothing surprising about this. The oceans must warm in the response to radiative forcing. [*] the work of Greg Johnson and his collaborators is a good starting point; e.g.: Johnson GC et al. (2006) Recent western South Atlantic bottom water warming Geophys. Res. Lett. 33, L14614 Johnson GC et al. (2007) Recent bottom water warming in the Pacific Ocean J. Climate 20, 5365-5375. Johnson GC (2008) Warming and Freshening in the Abyssal Southeastern Indian Ocean J. Climate 21, 5351-5363. Ozaki H et al. (2009) Long-term bottom water warming in the north Ross Sea J. Oceanograph. 65, 235-244. Johnson GC et al. (2009) Deep Caribbean Sea warming Deep Sea Research. 1 –Oceanograph. Res. 56, 827-834. Johnson GC (2008) Reduced Antarctic meridional overturning circulation reaches the North Atlantic Ocean Geophys. Res. Lett. 35, L22601 [**] e.g. S. Masuda et al. (2010) Simulated Rapid Warming of Abyssal North Pacific Waters Science 329, 319 - 322
  7. Chris, thanks for the references. Upwelling is an interesting mechanism. It would seem like it should leave footprints, though. The cold water would have to absorb sunlight near the surface and become relatively warmer before it was driven down, and that warmer water would have to escape detection.
  8. TomJones - the thermohaline circulation perhaps? If you watch the ENSO forecasts you will see cross-sections of the tropical ocean showing the downwelling. It doesnt escape detection.
  9. Susan Wijffels presentation for OceanObs 2009 had a slide that she credited to Palmer 2007 that compared eight different analyses down to 700 m. They all disagreed but had visibly the same shape, and averaged 0.3 W/m**2 over about 50 years. The von Schuckman 2009 paper obviously took advantage of the Argo network, went down to 2000 m, but estimated power at 0.77W/m**2. Furthermore, the 700m analyses had about four times as much accumulated heat. Either von Schuckman has discovered something new and exciting, or the Argo system still has a few bugs. In either case, the world is going to be full of papers which are going to examine the Argo data in detail, and compare it to predecessor data. It might be a real good idea to let the dust settle before using the data.
  10. Full text of von Schuckman here (pdf).
  11. Doug: Thank you for the von Schuckmann paper.
  12. It is surely curious that the chart of ocean temperature stops at 2005. The oceans have been clearly cooling since 2006. How about an update and a new discussion?
    Response: It's a good question - I actually asked the same question to Dan Murphy, author of the paper where the total heat content data comes from  (from Figure 1 above). The data actually ends in 2003. This is because the ocean heat data taken from Domingues et al. 2008 ends in 2003. This is why I post the von Schuckmann data in Figure 2 - this continues onto 2008.
  13. Voila, Charles.
  14. Hello all, I'm very new here to Skeptical Science, so bear with me if I have posted in the wrong section and too late. I found this site via my day to day viewing of "Ice age now", quite an interesting read, of which in one of Robert Felix's pages he mentioned this site, and I must thank him for it. This is certainly a grade above the rest, and truly is good to see facts over fiction. My question is: How is it, that if I do a quick check on every Australian city regarding the daily mean max temp since the start of Jan 2010, has shown an increase to the yearly average ? Thus far. If according to people like Robert Felix that the sun is in a quiet period and that the earth has not warmed lately and is cooling, how on "earth" can this be happening ? My monies on something called a "Greenhouse effect". And again, my apologies if have posted inappropriately. Richo.
    Response: Playing devil's advocate, one might answer that question by saying you can't gauge global temperature trends by looking at the temperature at a few selected cities or even over a single country. What you need to do is look at the global temperature record. Of course, what this shows is the hottest 12 months on record had just transpired recently: June 2009 to May 2010. So yes, we end up with the same question - if the sun has been cooling, why are we experiencing record warm temperatures this year?

    NASA GISS global temperature - hottest 12 months on record June 2009 to May 2010
  15. Re: Richo (64) I would recommend a primer in the science to get yourself a good background. There are many uninformed commenters and websites out there, so it can often be difficult to discern the wheat from the chaff. I would begin by starting here Then go here And also watch this. Then come back to Skeptical Science if you have additional concerns, type a few words describing your concern in the Search box in the upper left of every page and see what has already been covered on that topic here. On those threads, many of your questions may have already been answered. If not, find the most appropriate thread and post your question there. Feed a hungry man a fish, and he will be full - for a while. Teach a hungry man to fish and he will never be hungry again. The Yooper
  16. Thanks very much for that, Best regards, Richo.
  17. Oh dear, selti, the link you provided shows someone attempting to refute a decades-long trend with just a few cherry-picked data points. This is either a very basic misunderstanding of science, mathematics, and especially statistics, or a very poor attempt at deliberately misleading people. When you look at the full dataset, and include up-to-date data (beyond 2008, this year happens to be 2010), then the trend clearly remains unbroken, and IPCC is fully vindicated. If Girma Orssengo, MASc, PhD was intending to mislead then shame on him. If he honestly believes his presentation is an attempt at honest discourse then he should go to wherever he got his PhD and ask for his money back.
  18. adrian smits wrote (on the Isn't global warming just 2 °C and isn't that really small? thread) : "According to UHA satellite data the last week hasn't been this cold in many years for this old rock and I expect before this la Nina ends its gonna get a lot colder yet! Lets just wait 4 maybe 5 more years and see where we are at before doing anything rash.After 14 years of nearly flat temperatures that's 1996 to now. Three or four years of actual cooling should put a stake in the heart of the AGW agenda." Firstly, could you provide the link to that amazingly devastating data ? (Well, you seem to think it is) Secondly, last month was higher than the same month of the previous year, as was every other month - and, generally, some of the highest ever recorded. Where is the cooling you believe in ? Thirdly, are you agreeing that if there are 4 or 5 more years of warming, you will finally admit that your so-called skepticism has been wrong ? Fourthly, you have already been shown to be wrong about your belief in cooling over the last 14 years, but perhaps you have some hidden evidence you would like to show ? If so, please prove that your belief has some substance. Lastly, what do you believe this hidden agenda is ? Some sort of conspiracy ?
  19. Adrian- well I expect that next La Nina will start the chorus "start of cooling trend" again - until the next El nino. Not a constructive way to look at it perhaps? Wouldnt it be better to look that the temperature and compare with temperatures the last time the world have a similar magnitude of El Nino/ La Nina? With a TOA energy imbalance, you need iron-clad wishful thinking to propose that we are going to get cooler. On the other hand, if you are prepared abandon your denialism if its warmer in 5 years, then that would be progress.
  20. The deniers jumped on the same cooling train back in 2008 and predicted that we were going to enter a Maunder Miniumum due to the combination of the lowest solar minimum in more than 100 years and a negative PDO. With 2010 smashing all sorts of records, the deniers were proven dead wrong, but they are getting away with it. The MSM is all over tiny dicrepancies in the predictions of the real scientists, but dead quiet on the massive failure of the skeptic cooling predictions from 2008. Those predictions were all over the blogs and deniers even went on television proclaiming rapid cooling. Henrik Svensmark is one of the most high profile ones. Last month was the warmest (by far) in the UAH record, despite maximum cooling effect from the lowest solar slump in more than a century, despite the cooling effect from the much heralded (by deniers) negative PDO, and despite the onset of the second strongest La Nina on record. Nature is turning all the natural drivers to Max Cool and September was still the warmest by far. Food for thought. 2011 will flatten out and perhaps cool slightly, due to the strong La Nina, so the deniers will make their usual noise and the MSM will bite, hook, line and sinker and make first page material out of pretty much every single bit of denier disinformation. 2012 temperatures will come back with a vengeance, however, as we will likely enter an El Nino, and the solar cycle will have gained some momentum, in addition to the always present and increasing warming from the increasing concentrations of greenhouse gases.
  21. This page is correct that this is the best overall way to measure the Earth's heat, but in terms of the global warming discussion this argument is disingenuous. The IPCC sets the terms for the discussion. It is their argument that must be validated or disproven. The skeptics are simply responding to them. For example, when the IPCC makes a statement such as, "current temperatures are probably warmer than any other time in 1,000 years," or "The current rate of warming is unprecedented," this is based on a comparison with historic surface temperatures. According to the NAS even surface temperatures from proxies like tree rings are not that reliable earlier than about 500 years ago. But there is no way at all to get total ice volume or temps from specific layers of the ocean from the medieval warm period or earlier. For all we know, if we take all this into account, we might not be warming that much at all right now compared to 1,000 years ago. Skeptics talk in terms of surface temperatures because that is how the IPCC tends to talk. To respond to the skeptics with this argument is comparing apples to oranges.
    Response: This topic is addressed on the page Hockey stick is broken.
  22. Since Adrian was so easily convinced by the UAH temperatures, he should take another look at the graph and realize that we are in big trouble after all: Channel 5 is now once again smashing the all time record, despite the second strongest La Nina on record.
  23. So after my post @ 71 it says my statement is addressed on the hockey stick page. Yet the hockey stick page does not talk about total ice volume or total heat content. I think someone was missing the point of my comment.
  24. Re: erikbays (71, 73) Your claim was that:
    "According to the NAS even surface temperatures from proxies like tree rings are not that reliable earlier than about 500 years ago. But there is no way at all to get total ice volume or temps from specific layers of the ocean from the medieval warm period or earlier."
    This claim is addressed both in the linked post you were given as well as linked from there directly to this 161-page NAS document, 'Surface Temperature Reconstructions for the Last 2,000 Years'. I would direct your attention to FIGURE S-1 on p 17 and then these quotes from the summary on p 18:
    "It can be said with a high level of confidence that global mean surface temperature was higher during the last few decades of the 20th century than during any comparable period during the preceding four centuries."
    and
    "Less confidence can be placed in large-scale surface temperature reconstructions for the period from A.D. 900 to 1600."
    Less confidence does not mean unreliable or no confidence. Compare the confidence expressed in those two quotes to that in this (also from the summary on p 18):
    "Very little confidence can be assigned to statements concerning the hemispheric mean or global mean surface temperature prior to about A.D. 900 because of sparse data coverage and because the uncertainties associated with proxy data and the methods used to analyze and combine them are larger than during more recent time periods."
    So, the NAS has little confidence in surface temps prior to A.D. 900, and high confidence in temps post-1600 A.D., with temps 900 - 1600 A.D. falling somewhere in-between, confidence-wise. This, based on multiple, converging lines of evidence. Thus, the post you were directed to did indeed refute your claim. I believe that is why the Moderator directed you to the prior post. I'd recommend reading the entire NAS report. There's some good stuff in there. If your point was otherwise, I'd recommend re-phrasing it more narrowly & resubmitting it. Hope that helps. The Yooper
  25. Found this poking around on Kelly O'Day's site. Data through 10-26-2010. The chart can be found here. The Yooper

Prev  1  2  3  4  Next

Post a Comment

Political, off-topic or ad hominem comments will be deleted. Comments Policy...

You need to be logged in to post a comment. Login via the left margin or if you're new, register here.

Link to this page


The Consensus Project Website

THE ESCALATOR

(free to republish)


© Copyright 2024 John Cook
Home | Translations | About Us | Privacy | Contact Us