Climate Science Glossary

Term Lookup

Enter a term in the search box to find its definition.

Settings

Use the controls in the far right panel to increase or decrease the number of terms automatically displayed (or to completely turn that feature off).

Term Lookup

Settings


All IPCC definitions taken from Climate Change 2007: The Physical Science Basis. Working Group I Contribution to the Fourth Assessment Report of the Intergovernmental Panel on Climate Change, Annex I, Glossary, pp. 941-954. Cambridge University Press.

Home Arguments Software Resources Comments The Consensus Project Translations About Support

Bluesky Facebook LinkedIn Mastodon MeWe

Twitter YouTube RSS Posts RSS Comments Email Subscribe


Climate's changed before
It's the sun
It's not bad
There is no consensus
It's cooling
Models are unreliable
Temp record is unreliable
Animals and plants can adapt
It hasn't warmed since 1998
Antarctica is gaining ice
View All Arguments...


Username
Password
New? Register here
Forgot your password?

Latest Posts

Archives

Are we heading into a new Ice Age?

What the science says...

Select a level... Basic Intermediate

Worry about global warming impacts in the next 100 years, not an ice age in over 10,000 years.

Climate Myth...

We're heading into an ice age

"One day you'll wake up - or you won't wake up, rather - buried beneath nine stories of snow. It's all part of a dependable, predictable cycle, a natural cycle that returns like clockwork every 11,500 years.  And since the last ice age ended almost exactly 11,500 years ago…" (Ice Age Now)

At a glance

In something like a Day after Tomorrow scenario, the idea that a new ice-age was just around the corner was the subject of a book, a DVD and a website created in 2002. The author was a retired architect, by the way. Fortunately for us, both the movie and the quote above are figments of someone's fertile imagination. But let's have a quick look at ice-ages and what makes them tick, after which we hope you will agree that the notion that another ice-age is just around the corner is nonsensical.

Ice-ages, also known as glacials, are cold periods that occur in a cyclic fashion within an Icehouse climate state. Earth's climate has been mostly of the Hothouse type (no Polar ice-sheets). However, on occasion it has cooled down into Icehouse, as has been the case in the last few million years. There are regular variations in Earth's orbit around the Sun, taking place over tens of thousands of years. These affect the amount of Solar radiation reaching our planet. During the Icehouse state, such variations can lower and raise planetary temperature sufficiently to trigger swings between cold glacials – when ice-sheets expand towards the Equator – and mild interglacials – when the ice retreats back polewards.

To give an idea of the time-scales involved, Europe and North America have seen glacials and interglacials come and go repeatedly over the last 2.5 million years, this being known as the Quaternary Period of geological time. The last glacial period started 115,000 years ago and the Last Glacial Maximum (LGM), when the greatest ice extent was reached, was around 22,000 years ago. The current interglacial – also known as the Holocene, commenced 11,700 years ago.

A general pattern may be seen here with a long cooling down towards Glacial Maximum but a relatively quick warming into an interglacial. The speed of the warming-up part of the cycle is due to climate feedbacks. Removal of pale, reflective snow and ice cover revealing the darker ground beneath allows more solar heat energy to be soaked up. Melting of permafrost releases carbon dioxide and methane. These and other feedbacks serve to amplify the warming effect, speeding it up.

However, our burning of fossil fuels has happened on such a vast scale that we have blown such factors apart. The atmospheric concentration of CO2 has risen well above the 180-280 ppm range typical of recent glacial-interglacial cycles. The current level, getting on for 420 ppm, is more typical of the mid-Pliocene. That was a geological epoch that happened around a million years before the start of the Quaternary. Mid-Pliocene ice-sheets were much smaller than those of the present day. Rather than being due another glaciation, we can expect a continued transition towards mid-Pliocene conditions.

Please use this form to provide feedback about this new "At a glance" section, which was updated on May 27, 2023 to improve its readability. Read a more technical version below or dig deeper via the tabs above!


Further details

Because our current interglacial (the Holocene) has already lasted approximately 12,000 years, it has led some to claim that a new ice age is imminent. Is this a valid claim? No.

To explore this topic further, it is necessary to understand what has caused the cyclic shifts between ice ages and interglacials during the Quaternary period (fig. 1). Such shifts are in part a response to regular changes in the Earth’s orbit and tilt, which affect the amount of summer sunlight reaching high northern latitudes and were described by the Milankovitch Cycles, first proposed in the early 20th Century by Serbian mathematician Milutin Milankovitch (1879-1958). For more about Milankovitch cycles this NASA page offers lots of graphics and explanations.
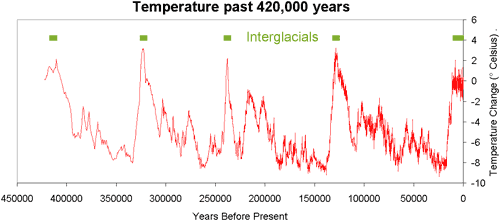
Figure 1: Temperature change through the late Quaternary from the Vostok ice-core, Antarctica (Petit et al. 2000). The timing of warmer interglacials is highlighted in green; our current interglacial, the Holocene, is the one on the far right of the graph.

When incoming sunlight declines in the high north, the rate of summer snow and ice-melt declines and the ice sheets begin to grow. When incoming sunlight increases, the opposite happens. So where are we in these cycles today? Changes in both the orbit and tilt of the Earth do indeed indicate that – were they singularly responsible for climate shifts - the Earth should be slowly cooling. However, recent research shows that is too simple. That's because we now have analyses of ice-cores going back 800,000 years or more. We have devised ways to use stable isotope ratios of various elements in things like fossils and we have developed many other proxy methods for telling us more about conditions in the relatively recent past that the Quaternary represents.

A number of irregularities in glacial-interglacial cycles have been determined, for example times when interglacials were skipped when orbital patterns suggest they should have happened. (Koehler and Van de Wal 2021). Such research has also been aimed at resolving the question of why Earth's 41,000 year obliquity cycle was a strong driver of glacial-interglacial transitions up until around one million years ago. Since then, glacials have instead typically lasted for much longer - around 100,000 years.

The importance of feedbacks within Earth's climate system has been increasingly recognised as the decades have gone by. A good example is the speed of transition from glacial to interglacial, which is relatively rapid because certain very effective climate feedbacks are involved. One such feedback involves albedo, defined as the ability of different bodies to absorb or reflect sunlight (e,g, Thackeray and Fletcher 2016).

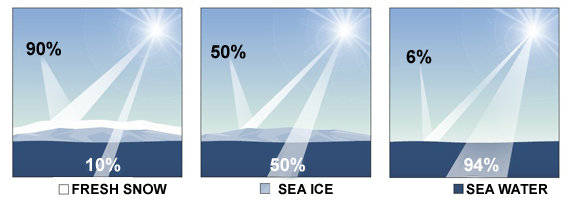
Albedo is expressed on a scale of 0 (black body, absorbs everything) to 1 (white body, reflects everything. Fresh snow has a high albedo of as much as 0.9, whereas the muck revealed when old snow and ice cover melts has a much lower one in the range 0.2 to 0.4 – it can absorb lots more solar energy. So melting snow and ice leads to more heat energy retention, amplifying the warming (Fig. 2). 
Albedo Explainer (John Mason)

Fig. 2: Albedo feedback explained. Freshly-fallen snow is highly reflective of incoming sunshine, so that most of the solar energy is simply bounced back towards space. Bare sea ice can potentially absorb about half of the incoming energy, so if conditions become warmer, causing the snow to melt, there’s more energy retained on Earth. If the sea ice melts too, then almost all of the incoming solar energy is absorbed by the much darker surface of the sea. So an initial warming directly results in further warming. Graphic: John Mason.

Another feedback happens when permafrost gets thawed out, since the ground is then able to release previously trapped CO2 and methane. During a glacial, the extent of permafrost is vast, so as it thaws, the release of such gases occurs on an enormous scale – again, amplifying the warming.

Researchers have also modelled ice-sheet dynamics, investigating how the sheets behaved as they melted, for example. It has been found that the shorter-lived, lower latitude Northern Hemisphere ice-sheets that existed prior to one million years ago were much thinner and therefore easier to melt. So ice-sheet dynamics looks to have a role in the much longer freeze-ups of the past million years. This all goes to show that glacial periods arise through a whole lot of factors interacting with one another, of which orbital cycles are but one, albeit important, cog in the gearbox and are not necessarily able to drive the climate system from one state (glacial) to another (interglacial) in total isolation (e.g. Bintanja and Van de Wal 2008; Berends et al. 2021).

Talking of cogs in the gearbox, we are another – and a big one. Our intentional disturbance of carbon reservoir rocks – what we do when we seek, extract and burn the fossil fuels – is unique in the geological record. It's a one-off in the planet's 4.56 billion year long history and while the consequent overloading of atmospheric CO2 levels is still insufficient to take Earth back into a Hothouse state yet, it is perfectly adequate to prevent another glaciation any time soon.

Last updated on 27 May 2023 by John Mason. View Archives

Printable Version  |  Offline PDF Version  |  Link to this page

Argument Feedback

Please use this form to let us know about suggested updates to this rebuttal.

Further reading

Tamino discusses predictions of future solar activity in Solar Cycle 24.

Acknowledgements

Many thanks to Sami Solanki for his invaluable advice and feedback as well as John Cross for his very helpful comments.

Further viewing

potholer54 published a video tackling this myth on June 27, 2020


Dave Borlace explains why we are not headed towards an ice age in this "Just have a think" video published in December 2019:


Denial101x video

Comments

Prev  1  2  3  4  5  6  7  8  9  10  11  12  13  14  15  16  17  Next

Comments 151 to 175 out of 411:

  1. This article is quite interesting as well. It explains ice sheet/bedrock dynamics, and explains the rapid deglaciation. He also contends that ice sheet/earth crust dynamics are enough to explain the 100,000 year cycle. He contends that raised bedrock and low summer insolation are enough to start the next glaciation cycle. http://igitur-archive.library.uu.nl/phys/2007-0730-200322/oerlemans_80_modelexperiments100000yr.pdf Chris Shaker
  2. #150: "poor ability to predict the glacial cycle using models" You are aware that the Oerlemans paper you refer to bases its explanation on a model study? Experiments with a Northern Hemisphere ice-sheet model show that the 100,000-yr cycle and its sawtooth shape may be explained by ice sheet/bedrock dynamics alone. This cycle seems to be an internally generated feature and is not forced by variations in the eccentricity of the Earth's orbit. Too bad just about everybody else goes with the orbital variations.
  3. Muoncounter: yes, and they talked about tweaking the model to get it to reflect the 100,000 year cycles. I found the whole idea of the ice-sheet bedrock uplift fascinating. I have not yet found newer studies which attempt to model and predict the glacial cycle. Is it still an active area of research? Chris Shaker
  4. cjshaker - Note that 100,000 year cycle isnt the main player in glacial cycle - are you seriously suggesting that you dont think the Milankovich cycles are the primary forcing? Modelling of ice age on the whole is fairly crude - running models that are used for predicting the next 100 years over a million years isnt feasible with current computer power, so yes, its still active research. You have competing explanations for the relative importance of various feedbacks in reproducing the cycle and so far no clear winner. For discussion of research and pointers to the papers on the models, then you cant go past Chp 6 of IPCC WG1.
  5. scaddenp: I'm not suggesting it. The author of that paper was suggesting it is possible. The idea was fascinating to me. Been obsessed with reading about the ice age cycle lately. I have read Barney Oliver's analysis of the energy difference due to the Milankovich cycles. Such an elegant and sparse argument he made. Was a brilliant man. Chris Shaker
  6. Mostly, I've been able to find temperature proxy data from the ice cores. I've read about temperature proxy records from tree rings. Any good pointers to background on other temperature proxy data? How do we get temperature proxy data from the tropics? Thank you, Chris Shaker
  7. I am curious as to how we study the impact of the 100,000 year glacial cycles in the tropics, ie - what temperature proxy data do we use? The wiki on the temperature record offers some information on other proxy data. It appears that coral growth rates are used to estimate temperatures in tropical regions? http://en.wikipedia.org/wiki/Temperature_record I assume that they are measuring coral growth rates based on calcium carbonate deposits, which will slow down as CO2 increases, and will slow down as the temperature changes, up or down. Even changes in salinity will affect their growth rate. Seems like it would be hard to get high quality temperature proxy data from coral growth rates. Given how fragile coral is, I'm amazed that they survive at all. http://en.wikipedia.org/wiki/Coral "Seaweed/Algae can destroy a coral reef. In the Caribbean and tropical Pacific, direct contact between ~40 to 70% of common seaweeds and coral cause bleaching and death to the coral via transfer of lipid–soluble metabolites.[26] Seaweed and algae proliferate given adequate nutrients and limited grazing by herbivores. Coral die if surrounding water temperature changes by more than a degree or two beyond their normal range or if water salinity drops." Chris Shaker
  8. Temperature proxies for tropics - isotope data from forams in sediment core for ocean temps. (Used everywhere). Stalactites from cave systems. Lake productivity from sediment core. All proxies have problems of one sort of other usually with both temperature and age calibration so need to understand proxies in terms of constraining possible models. As coral - killing coral is easy but the carbonate skeleton is preserved. And you assume wrong about how they work. The method is based on oxygen isotopes and Sr/Ca ratios. Use google scholar for detail.
  9. Regarding lines 127-136 (sorry for the delayed response - life got in the way) To JMurphy in particular, I appreciate the time you spent providing all of those links. And, I have to apologize, as it appears that I may have been unclear in the main points of my previous post. My points were only: 1. to questioning the quality of the scientists and 2. questioning CO2 impact on temperature Your links to the hockey stick issue don't change the fact that two different sets of data were concatenated. AGW promoters find this acceptable, the rest of us do not. I'd like to discuss the urban heat effect, but fear we would just talk past each other. Daniel stated that GHG effect of CO2 is "not seriously questioned by any competent scientist anywhere". The only purpose in sending the link to the Petition Project was to show that over 31,000 scientists - surely some of whom must be "competent scientist" somewhere - provided a detailed explanation for their disagreement with AGW. I also took issue with his definition of "competent scientist" and provided links to support my position. It wasn't my intention to open a direct discussion on the petition project or climategate, but to offer those issues as causing legitimate doubt. JMurphy - most of your links regarding the IPCC back up what I said - the IPCC either lied or "misread" data. Furthermore, that happened because their reports were NOT peer viewed. Further promoting my point that they are not an entirely reliable source. That IPCC link represents meager 831 scientists. Additionally, my concerns remain about the quality of the scientists behind the IPCC. The IPCC states that their procedures provide for the InterAcademy Council to "assemble an international panel of experts". Now, you may trust that their basis of selection is unbiased and only considers the credentials of those selected, but I do not. Item 7 of this report gives me pause for concern on that topic as well.
  10. My second main point was questioning whether CO2 leads or follows global warming. To this point, Rob and Daniel were direct: CO2 leads global warming because it's basic physics. Okay - lets talk "physics". Anthropogenic CO2 emissions are about 30 Gtons per year . Total CO2 emissions are about 250 Gtons per year (for this, I estimated a consistent 2% per year increase) - making man responsible for about 12% of all CO2 emissions world wide (this includes CO2 sink effects). The impact CO2 has on GHE is, at its upper limit, about 26%. That means that anthropogenic CO2 emissions - WORLD WIDE - have, at most, a 3.12% impact on the green house effect. And for that, I should be hysterical? The problem here is that the most influential GHG is water vapor (since you all seem to trust the IPCC implicitly, please see their First Assessment Report by Working Group I). By the logic of suppressing GHGs, should we stop cooking and boiling water? Sound ridiculous? That is how I feel about CO2 emissions causing globe disasters. I've stated my reasons. I've tried to give reasonable supporting documents to the reasons for my doubts about AGW. We may have to just agree to disagree.
    Response: The point about human CO2 emissions being a small percentage of the total is addressed here.
    The point about CO2 lagging temperature is addressed here.
    The point about water vapor being the most dominant GHG is addressed here.

    In the future, please review the List of Skeptic Arguments before posting and place your individual arguments in the appropriate thread (ideally after reading what the post has to say). This will ensure that your points will be readily available to anyone reviewing the discussion of the relevant subject.

    Per the comment policy of this site, any future off-topic posts will be deleted.
  11. To Rob (127) - I have to ask: did you even read Doran's 2009 document? Exactly 75 climatologist agreed - NOT with your Orwellian claim that climate scientists believe that "climate change is real", what fool ever said it isn't? - but, that "human activity is a significant contributing factor in changing mean global temperatures". (do you understand the distinction?) Since you are the master of percentages, just what percentage of ALL climatologist would this be?
  12. Muoncounter (132): If "Artic sea ice falls to third-lowest extent", that means there were at least two extents that were greater. Here is the chart from the link that you sent - please notice that 2007 is the lowest point and 2008 - 2010 show a greater sea ice extent. While I stand corrected on one point: the increase has been for only two of the last three years; the main point remains: if accumulated CO2 is causing the globe to warm, then - by the AWG logic - 2008 through 2010 would be below 2007.
  13. NQoA Do you mean that you think that global warming means that every year should show a progressive increase or decrease in each indicator? And that any indicator not showing such a response in any year shows that the globe is not warming?
  14. NQoA @162, it is very easy to look up Doran's paper and see that it was 75 of 77 climatologists actively publishing in climatology that answered yes. So that would be 97.4% of that restricted sample. Or are you, perhaps trying to suggest it was only 75 out of the surveyed climatolotists that answered yes? That is certainly what you asserted, but it is false. In fact, of around 157 climatologists surveyed, around 138, or 88% answered yes to that question. Further, 2580 of all respondants (82%) answered yes to question 2. Even if we inflate the figures from the Oregon petition to allow for the effect of responce rates, we still have 97% of scientist who actually know the science of climate change support the basic veracity of the IPCC reports, while apparently, around 0.3% are very ill informed.
  15. NQoA wrote: "if accumulated CO2 is causing the globe to warm, then - by the AWG logic - 2008 through 2010 would be below 2007." That's not any 'AGW logic' I've ever heard of. First, sea ice extent is a measure of ice area and how spread out the ice is. The 2007 value was noted at the time to have been in part caused by wind conditions causing the ice to mass up in a small area (which 'skeptics' took as an excuse to ignore it). Now we've had three subsequent years where we haven't seen winds pack the ice into such a small area but the extent has been nearly as low in two of them, because there is now less ice... as we can see from looking at ice volume values, which have continued to drop each year since 2007. Second, there is something called weather which can cause large fluctuations in all kinds of climate readings. The Arctic winds contributing to the low extent in 2007 are one example. In this case the volume (aka 'actual amount') of Arctic sea ice has declined each of the past few years... but if it were to tick up for a few years that wouldn't be contrary to AGW in any way. Just expected natural variation.
  16. NQuestofApollo wrote : "Your links to the hockey stick issue don't change the fact that two different sets of data were concatenated. AGW promoters find this acceptable, the rest of us do not. I'd like to discuss the urban heat effect, but fear we would just talk past each other." The facts are stated in the links I gave previously, so you should comment on one of those threads if you want to outline any objections that aren't answered there. You can discuss Urban Heat here, here or here. NQuestofApollo wrote : "The only purpose in sending the link to the Petition Project was to show that over 31,000 scientists - surely some of whom must be "competent scientist" somewhere - provided a detailed explanation for their disagreement with AGW." No, that "detailed explanation" was provided by Robinson, Robinson and Soon, with such gems as a first graph which purports to show the MWP much, much warmer than now (using the Sargasso Sea as the world, and projecting world temperature from that from 1975 to 2006 - but you find that acceptable, supposedly ?); and mentioning the "colonization of Greenland" - again, acceptable 'facts' for you ? NQuestofApollo wrote : "I also took issue with his definition of "competent scientist" and provided links to support my position." Couldn't find the links you are referring to, which "support your position". Could you point them out, please ? NQuestofApollo wrote : "most of your links regarding the IPCC back up what I said - the IPCC either lied or "misread" data. Furthermore, that happened because their reports were NOT peer viewed. Further promoting my point that they are not an entirely reliable source." Again, you will have to point out the bits that made you decide to believe that the "IPCC either lied or 'misread' data". As for the IPCC itself, I suggest you have a look at the WIKIPEDIA description : The IPCC does not carry out its own original research, nor does it do the work of monitoring climate or related phenomena itself. A main activity of the IPCC is publishing special reports on topics relevant to the implementation of the UN Framework Convention on Climate Change (UNFCCC), an international treaty that acknowledges the possibility of harmful climate change. Implementation of the UNFCCC led eventually to the Kyoto Protocol. The IPCC bases its assessment mainly on peer reviewed and published scientific literature. If you need to link to Monckton's website to get your information, I would suggest you are limiting your understanding a great deal.
  17. Re: NQ/A (159) I have replied to your comment over here in order to not be a further distraction to this thread. The Yooper
  18. To CBDunkerson (165) - following are three examples that support (in my opinion) the AGW promoters logic that accumulated CO2 would cause the sea ice extent to continue to decline: IPCC TAR 2001 The systematic decrease in spring and summer Arctic sea-ice extent in recent decades is broadly consistent with increases of temperature over most of the adjacent land and ocean. NASA 2003 "Researchers have suspected loss of Arctic sea ice may be caused by changing atmospheric pressure patterns over the Arctic that move sea ice around, and by warming Arctic temperatures that result from greenhouse gas buildup in the atmosphere. Warming trends like those found in these studies could greatly affect ocean processes, which, in turn, impact Arctic and global climate…As the oceans warm and ice thins, more solar energy is absorbed by the water, creating positive feedbacks that lead to further melting." And my favorite headline: Argentine glacier advances despite global warming June 2009 'We're not sure why this happens,' said Andres Rivera, a glacialist with the Center for Scientific Studies in Valdivia, Chile. 'But not all glaciers respond equally to climate change.' It is interesting to see AGW promoters suddenly embrace the "expected natural variation" explanation. That's pretty much what the "Climate Change Deniers" have been saying all along.
  19. To Tom Curtis (164) - I was responding directly to post #127. If you are so inclined, please read #127 then read #161. If you still don't understand the point of my post, I will attempt to provide a better explanation.
  20. NQuest @168, I have responded to your comment here so as not to distract from the topic of this thread.
  21. NQoA, so... the IPCC noting that Arctic sea ice extent has shown consistent declines over the past few decades translates in your mind to them claiming that it will show consistent declines every year going forward? I'm afraid that's a disconnect between your brain and reality. If you look at the past data you will see that it did not go down every single year then either. However, if you take the trend line for each decade it did indeed decline consistently each decade. Including the decade 2000-2009. The 2010-2019 decade has just started, but you'd have to be a fool to bet that it isn't going to show another decline below 2000-2009. The difference between the 'natural variability' which has always been part of AGW theory and that promoted by the 'skeptics' is that the variability considered in AGW scenarios actually exists... there are past precedents for it. The variability promoted by 'skeptics' exceeds all past experience and any possible explanation consistent with the laws of physics.
  22. #168: "Argentine glacier advances... " Missed this little tidbit from the lead paragraphs of the article: Argentina's Perito Moreno glacier is one of only a few ice fields worldwide that have withstood rising global temperatures. Nourished by Andean snowmelt, the glacier constantly grows even as it spawns icebergs the size of apartment buildings into a frigid lake, maintaining a nearly perfect equilibrium since measurements began more than a century ago. -- emphasis added So to say that a glacier "advances" when it is merely maintaining equilibrium is a tad disingenuous. However, since NQoA has such definite opinions in the context of this thread, it would be interesting to see how he lines up on the question of 'are we heading into a new ice age?' Especially interesting if he could provide some actual substantiation (beyond a mis-read of a news clip) for what must be very strongly-held opinions. Because that would provide him some credibility; without credibility, opinions are ... just opinions.
  23. @NQoA: "That's pretty much what the "Climate Change Deniers" have been saying all along." Actually, that isn't true. There are still many deniers/politically-motivated skeptics who still dispute we are in a warming trend. Indeed, many of those who have been trying to prop up the failed manufactured Climategate scandal (which has now been thoroughly eclipsed by Cablegate) are saying just that. The fact that you seem to believe warming should be linear is also a sign you are gravely mistaken: complex systems do not react in linear fashion. Look at the Stock Market if you don't believe me...
  24. CBDunkerson (171) - would you be kind enough to send me a couple of links to examples, pre 2005, were the IPCC or friends specifically stated that they expected the sea ice extent to increase, glaciers to increase or record cold temperature to occur post 2005. Not some vague statement that could be interpreted any which way - but, an explicit statement along the lines of: regardless of the current warming trend, we fully expect glaciers to occasionally expand and record cold temperatures to occur. muoncounter (172) - I didn't miss anything, I was pointing out that the AGW team - up until recently, promoted the expectation that the ice sheets and glaciers would continue to recede; as evidenced by the statement: 'We're not sure why this happens'.. On the question of "are we heading into a new ice age?" - that only matters if one presupposes that human activity in some way affects the temperature of the Earth. You, obviously, presuppose that we do. archiesteel (173) - I'm not the one expecting that warming should be linear.
    Response: Well, you could start with this post: It’s freaking cold!
  25. #174: "I didn't miss anything," Right. Your 'favorite headline' cherrypick stated this glacier was advancing; you tried to make something of the legitimate statement made by a knowledgeable scientist that he couldn't explain everything. As if that's some kind of weakness in the whole picture. And you missed the whole bit about the glacier being in equilibrium -- or else you wouldn't have used that poor an example to illustrate your 'point'. Here's a glaciar nearby that's not in equilibrium: Upsala Glacier, Argentina, 1928 Same spot, 2004: This is not how an ice age is supposed to look. Any questions?
    Response: {Daniel Bailey} Topical of you to bring this glacier up. Check this out:

Prev  1  2  3  4  5  6  7  8  9  10  11  12  13  14  15  16  17  Next

Post a Comment

Political, off-topic or ad hominem comments will be deleted. Comments Policy...

You need to be logged in to post a comment. Login via the left margin or if you're new, register here.

Link to this page


The Consensus Project Website

THE ESCALATOR

(free to republish)


© Copyright 2024 John Cook
Home | Translations | About Us | Privacy | Contact Us