Climate Science Glossary

Term Lookup

Enter a term in the search box to find its definition.

Settings

Use the controls in the far right panel to increase or decrease the number of terms automatically displayed (or to completely turn that feature off).

Term Lookup

Settings


All IPCC definitions taken from Climate Change 2007: The Physical Science Basis. Working Group I Contribution to the Fourth Assessment Report of the Intergovernmental Panel on Climate Change, Annex I, Glossary, pp. 941-954. Cambridge University Press.

Home Arguments Software Resources Comments The Consensus Project Translations About Support

Twitter Facebook YouTube Mastodon MeWe

RSS Posts RSS Comments Email Subscribe


Climate's changed before
It's the sun
It's not bad
There is no consensus
It's cooling
Models are unreliable
Temp record is unreliable
Animals and plants can adapt
It hasn't warmed since 1998
Antarctica is gaining ice
View All Arguments...


Username
Password
New? Register here
Forgot your password?

Latest Posts

Archives

Are we heading into a new Ice Age?

What the science says...

Select a level... Basic Intermediate

Worry about global warming impacts in the next 100 years, not an ice age in over 10,000 years.

Climate Myth...

We're heading into an ice age

"One day you'll wake up - or you won't wake up, rather - buried beneath nine stories of snow. It's all part of a dependable, predictable cycle, a natural cycle that returns like clockwork every 11,500 years.  And since the last ice age ended almost exactly 11,500 years ago…" (Ice Age Now)

At a glance

In something like a Day after Tomorrow scenario, the idea that a new ice-age was just around the corner was the subject of a book, a DVD and a website created in 2002. The author was a retired architect, by the way. Fortunately for us, both the movie and the quote above are figments of someone's fertile imagination. But let's have a quick look at ice-ages and what makes them tick, after which we hope you will agree that the notion that another ice-age is just around the corner is nonsensical.

Ice-ages, also known as glacials, are cold periods that occur in a cyclic fashion within an Icehouse climate state. Earth's climate has been mostly of the Hothouse type (no Polar ice-sheets). However, on occasion it has cooled down into Icehouse, as has been the case in the last few million years. There are regular variations in Earth's orbit around the Sun, taking place over tens of thousands of years. These affect the amount of Solar radiation reaching our planet. During the Icehouse state, such variations can lower and raise planetary temperature sufficiently to trigger swings between cold glacials – when ice-sheets expand towards the Equator – and mild interglacials – when the ice retreats back polewards.

To give an idea of the time-scales involved, Europe and North America have seen glacials and interglacials come and go repeatedly over the last 2.5 million years, this being known as the Quaternary Period of geological time. The last glacial period started 115,000 years ago and the Last Glacial Maximum (LGM), when the greatest ice extent was reached, was around 22,000 years ago. The current interglacial – also known as the Holocene, commenced 11,700 years ago.

A general pattern may be seen here with a long cooling down towards Glacial Maximum but a relatively quick warming into an interglacial. The speed of the warming-up part of the cycle is due to climate feedbacks. Removal of pale, reflective snow and ice cover revealing the darker ground beneath allows more solar heat energy to be soaked up. Melting of permafrost releases carbon dioxide and methane. These and other feedbacks serve to amplify the warming effect, speeding it up.

However, our burning of fossil fuels has happened on such a vast scale that we have blown such factors apart. The atmospheric concentration of CO2 has risen well above the 180-280 ppm range typical of recent glacial-interglacial cycles. The current level, getting on for 420 ppm, is more typical of the mid-Pliocene. That was a geological epoch that happened around a million years before the start of the Quaternary. Mid-Pliocene ice-sheets were much smaller than those of the present day. Rather than being due another glaciation, we can expect a continued transition towards mid-Pliocene conditions.

Please use this form to provide feedback about this new "At a glance" section, which was updated on May 27, 2023 to improve its readability. Read a more technical version below or dig deeper via the tabs above!


Further details

Because our current interglacial (the Holocene) has already lasted approximately 12,000 years, it has led some to claim that a new ice age is imminent. Is this a valid claim? No.

To explore this topic further, it is necessary to understand what has caused the cyclic shifts between ice ages and interglacials during the Quaternary period (fig. 1). Such shifts are in part a response to regular changes in the Earth’s orbit and tilt, which affect the amount of summer sunlight reaching high northern latitudes and were described by the Milankovitch Cycles, first proposed in the early 20th Century by Serbian mathematician Milutin Milankovi? (1879-1958). For more about Milankovitch cycles this NASA page offers lots of graphics and explanations.

Figure 1: Temperature change through the late Quaternary from the Vostok ice-core, Antarctica (Petit et al. 2000). The timing of warmer interglacials is highlighted in green; our current interglacial, the Holocene, is the one on the far right of the graph.

When incoming sunlight declines in the high north, the rate of summer snow and ice-melt declines and the ice sheets begin to grow. When incoming sunlight increases, the opposite happens. So where are we in these cycles today? Changes in both the orbit and tilt of the Earth do indeed indicate that – were they singularly responsible for climate shifts - the Earth should be slowly cooling. However, recent research shows that is too simple. That's because we now have analyses of ice-cores going back 800,000 years or more. We have devised ways to use stable isotope ratios of various elements in things like fossils and we have developed many other proxy methods for telling us more about conditions in the relatively recent past that the Quaternary represents.

A number of irregularities in glacial-interglacial cycles have been determined, for example times when interglacials were skipped when orbital patterns suggest they should have happened. (Koehler and Van de Wal 2021). Such research has also been aimed at resolving the question of why Earth's 41,000 year obliquity cycle was a strong driver of glacial-interglacial transitions up until around one million years ago. Since then, glacials have instead typically lasted for much longer - around 100,000 years.

The importance of feedbacks within Earth's climate system has been increasingly recognised as the decades have gone by. A good example is the speed of transition from glacial to interglacial, which is relatively rapid because certain very effective climate feedbacks are involved. One such feedback involves albedo, defined as the ability of different bodies to absorb or reflect sunlight (e,g, Thackeray and Fletcher 2016).

Albedo is expressed on a scale of 0 (black body, absorbs everything) to 1 (white body, reflects everything. Fresh snow has a high albedo of as much as 0.9, whereas the muck revealed when old snow and ice cover melts has a much lower one in the range 0.2 to 0.4 – it can absorb lots more solar energy. So melting snow and ice leads to more heat energy retention, amplifying the warming (Fig. 2). 

Albedo Explainer (John Mason)

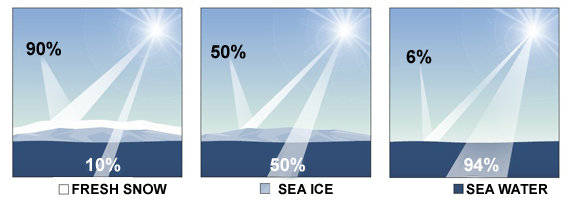
Fig. 2: Albedo feedback explained. Freshly-fallen snow is highly reflective of incoming sunshine, so that most of the solar energy is simply bounced back towards space. Bare sea ice can potentially absorb about half of the incoming energy, so if conditions become warmer, causing the snow to melt, there’s more energy retained on Earth. If the sea ice melts too, then almost all of the incoming solar energy is absorbed by the much darker surface of the sea. So an initial warming directly results in further warming. Graphic: John Mason.

Another feedback happens when permafrost gets thawed out, since the ground is then able to release previously trapped CO2 and methane. During a glacial, the extent of permafrost is vast, so as it thaws, the release of such gases occurs on an enormous scale – again, amplifying the warming.

Researchers have also modelled ice-sheet dynamics, investigating how the sheets behaved as they melted, for example. It has been found that the shorter-lived, lower latitude Northern Hemisphere ice-sheets that existed prior to one million years ago were much thinner and therefore easier to melt. So ice-sheet dynamics looks to have a role in the much longer freeze-ups of the past million years. This all goes to show that glacial periods arise through a whole lot of factors interacting with one another, of which orbital cycles are but one, albeit important, cog in the gearbox and are not necessarily able to drive the climate system from one state (glacial) to another (interglacial) in total isolation (e.g. Bintanja and Van de Wal 2008; Berends et al. 2021).

Talking of cogs in the gearbox, we are another – and a big one. Our intentional disturbance of carbon reservoir rocks – what we do when we seek, extract and burn the fossil fuels – is unique in the geological record. It's a one-off in the planet's 4.56 billion year long history and while the consequent overloading of atmospheric CO2 levels is still insufficient to take Earth back into a Hothouse state yet, it is perfectly adequate to prevent another glaciation any time soon.

Last updated on 27 May 2023 by John Mason. View Archives

Printable Version  |  Offline PDF Version  |  Link to this page

Argument Feedback

Please use this form to let us know about suggested updates to this rebuttal.

Further reading

Tamino discusses predictions of future solar activity in Solar Cycle 24.

Acknowledgements

Many thanks to Sami Solanki for his invaluable advice and feedback as well as John Cross for his very helpful comments.

Further viewing

potholer54 published a video tackling this myth on June 27, 2020


Dave Borlace explains why we are not headed towards an ice age in this "Just have a think" video published in December 2019:


Denial101x video

Comments

Prev  1  2  3  4  5  6  7  8  9  10  11  12  13  14  15  16  17  Next

Comments 126 to 150 out of 411:

  1. scaddenp - obliviously diamonds are not emissions, but then neither is Carbon. I was being sarcastic to make the point that any reference to "Carbon" emissions is disingenuous. Unfortunately, this short hand is causing (otherwise intelligent people) to claim that "carbon emissions from cars are combining with ozone and causing a depletion in the ozone layer". Daniel, I appreciate all of the information you provided here and would like to challenge you on your definition of a "competent scientist". Remember Michael Mann's "hockey stick graph" - the one trotted out by Al Gore and the IPCC as proof positive that AGW exists? If in fact the Earth is warming - why did Mann feel the need to concatenate two different data sets? If I wanted to prove that sports scores have been increasing over the last 100 years and I take baseball scores for the first sixty years and plot them - then I take basketball scores for the last 40 years and tack them on the end of my graph, would my graph be taken seriously? Supporting articles here and here. Distressingly, this is the same IPCC that "misread" the year the Himalayan glaciers were "likely to disappear" due to global warming: Mr Cogley says it is astonishing that none of the 10 authors of the 2007 IPCC report could spot the error and "misread 2350 as 2035". IPCC error Equally distressing is the suggestion that they may have done so on purpose. IPCC error intentional Here's a question I literally cannot find an answer to: How many scientist work for the IPCC and what are their names? I've heard 1000, I've heard 2000 - yet, I cannot find a comprehensive list of the people involved in promoting AGW. On the other hand, here is a list of over 31,000 scientist that think AGW is a bunch of bunk. All their names are listed - right there. (I know, I know - they were ALL bought off by Big Oil.) Petition Project There has been some chatter on this site about not looking at thermometer reading to assess the global warming situation (too bad nobody mentioned that to Michael Mann) - I've been told to look at the sea ice extent. So, I have - it has increase for the last three years. The counter to this point is that the ice is thin - but, of course young ice is thin. The point is that the extent has NOT receded in the last three years. Now, how can that be with all of that accumulated, globe warming carbon? Sea Ice Extent Also, if accumulated CO2 definitively causes the globe to warm, why did they think the globe was cooling for the 30 years prior to the 1970s? But, this, I think, is the primary question: since CO2 will increase as the globe warms (due to melting, CO2 containing glaciers), why should I assume that CO2 CAUSES global warming? Sure the globe has been warming (for the last 10,000 years), sure there is more CO2, but what if you have your cause and effect relationship inversed?
  2. NQuestofApollo... You've posted such a long list of baseless information that it's a little hard to respond. Let me take the "31,000 scientists" issue first. We are all aware of the Oregon Petition. What you are ignoring about it is that figure requires a denominator to have any meaning at all. The petition defines "scientist" as anyone with a BS or equivalent. That encompasses nearly 30,000,000 people in the US alone. You can likely double that number or more looking outside the US. So, even at best you are presenting a figure that is about 1/10th of one percent. If you poll actual working climate scientist who are currently working in this field you get quite the opposite number. Doran 2009 shows that 97% of climate scientists believe that climate change is real.
  3. NQuestofApollo, your post gives lots of opportunity for everyone here to point out your misunderstandings, but I would like to start with your first assertion : "Remember Michael Mann's "hockey stick graph" - the one trotted out by Al Gore and the IPCC as proof positive that AGW exists? If in fact the Earth is warming - why did Mann feel the need to concatenate two different data sets?" You should read further on this website (by using the 'Search' box in the top left) but I will start you out : Go here, here, here and here. If no-one else can be bothered to point you in the right direction for your other misinformed points (and I wouldn't blame anyone else for not wanting to go over all this again), I will return to this later.
  4. NQuestofApollo says... "why should I assume that CO2 CAUSES global warming?" Because it's basic physics? Actually, the globe has not been warming for the past 10,000 years. If you look at the Holocene optimum we've been slightly cooling over that period. It's only in the past 100 years that we've reversed that trend. Honestly, this site provides information that responds to everything you've said here much better than I can in a short post. I would urge you to take some time to read some of the articles and follow the cited sources.
  5. More for NQuestofApollo to read, this time concerning Himalayan glaciers : Go here, here, and here.
  6. More for NQuestofApollo to read, this time concerning the IPCC : Go here and you will see links to the 831 authors and the membership of the task groups. Wasn't difficult to find.
  7. 126: "I've been told to look at the sea ice extent. So, I have - it has increase for the last three years." Sorry, but that's just flat wrong. Someone has been feeding you some bogus information. See SkS articles here, here and here, among others; also Arctic sea ice falls to third-lowest extent; downward trend persists
  8. More for NQuestofApollo to read, this time concerning the Arctic : Go here, here, here, here, and here.
  9. More for NQuestofApollo to read, this time concerning mid-century cooling : Go here. There are three different versions there, so pick the one you feel most comfortable with.
  10. More for NQuestofApollo to read, this time concerning CO2/temperature correlation : Go here, an external website for a change. Very technical, though, so be warned.
  11. Re: NQuestofApollo (126) To summarize: You have taken issue with this statement I made earlier:
    "We have known about the GHG effect of CO2 for nearly two centuries - this is well-understood and not seriously questioned by any competent scientist anywhere. Google Tyndall, Arrhenius or Fourier sometime."
    Am I correct? Proceeding as if so; granted its been some 25 years since my college days, but it's my understanding that the GHE is basic physics, taught in high-schools these days. Please correct me if I'm wrong on that. It doesn't change the fact that the GHE is basic physics; numerous videos are available on Youtube attesting to and demonstrating that fact that you can replicate in your home by you, if so inclined.
    "It should be possible to explain the laws of physics to a barmaid." ~ Albert Einstein
    I think I'll go out right now to ascertain how performable this is for the GHE; wish me luck... PS: To make the moderators life here a little easier, please keep in mind the topic of the thread you post questions on. For example, this thread is about "Are we heading into a new Ice Age?". For question other than the focus of this thread, such as your references to the Oregon Petition or Climategate, please use the search function in the upper left of each page to find a more appropriate thread to post those concerns on. Comments deemed off-topic will be deleted. Thanks in advance! The Yooper
  12. Looking at the graph of temperature over the past 420,000 years of the the glacial cycle, in Figure 1. Why is the left side of the graph so much 'skinnier' than the right side? The line representing temperature on the left side of the graph is quite thin and looks maybe 'smoothed'? Compare it to the much fatter and fuzzier looking temperature signal line on the right side of the graph. Why is the difference so striking? Thank you, Chris Shaker
  13. cjshaker, I suspect the line on the left side of the figure is skinnier than on the right side, because the line on the left side is smoother, because there are fewer samples of times longer ago. The author of the graph could have created a best-fit smoothed line through the entire graph, but probably refrained in order to present as much useful information, including uncertainty, as possible.
  14. cjshaker - the deeper down (further back in time) you go with ice core, the more resolution you lose due to compaction and consequent changes in the ice - so yes, the data going back is effectively smoothed. Its the nature of the record. As to worrying about the next ice age... The milankovitch forcing that drives ice age is due to change in forcing that is about 0.25W/m2 per hundred years at 65N. Globally, its maybe a tenth of that. By comparison, anthropogenic GHG is about 3.7W/m2 over last 100 years on a GLOBAL scale. Ie the +ve anthropogenic forcings far exceeds the negative milankovich forcing. Estimate are that we arent going to see an ice age for 50,000 years.
    Response: No all-caps, please.
  15. Also "AGW believers don't seem to want to admit that the glacial cycle is happening, as it has been happening for millions of years. We're supposed to believe that the glacial cycle has magically stopped working just because the CO2 level is elevated." This from over in 1500 year cycle borders on the offensive. You will find no science published that asserts milankovich cycles arent continuing. Only that what causes the ice age is just one of the forcings affecting climate and its being trumped by high CO2 - just as it was when world had more CO2. Do think the milankovich cycles werent operating "magically" to use your word, at times before we had ice caps?
  16. scaddenp said at 07:05 AM on 23 March, 2010 "I hate to be reiterating an old point but its all about rate. The transition into and out of ice age is extremely slow by human terms. (around 10,000 years). The rate of warming we are creating is by comparison very fast. Rates of change that overwhelm species capacity to adapt are the danger." It seems that these claims are incorrect. Natural systems have caused huge and rapid temperature change in the recent past. http://www.scientificamerican.com/article.cfm?id=ice-core-reveals-how-quickly-climate-can-change "Following this abrupt shift, as much as 20 degrees Fahrenheit (10 degrees Celsius) of warming occurred over the subsequent decades—a change that ultimately resulted in at least 33 feet (10 meters) of sea-level rise as the ice melted on Greenland." http://www.sciencedaily.com/releases/2008/06/080619142112.htm "The ice core showed the Northern Hemisphere briefly emerged from the last ice age some 14,700 years ago with a 22-degree-Fahrenheit spike in just 50 years, then plunged back into icy conditions before abruptly warming again about 11,700 years ago. Startlingly, the Greenland ice core evidence showed that a massive "reorganization" of atmospheric circulation in the Northern Hemisphere coincided with each temperature spurt, with each reorganization taking just one or two years, said the study authors." Note that the Woolly Mammoth, giant sloth, and Sabre tooth tiger went extinct during one of the most recent temperature excursions, only 12,900 years ago. Chris Shaker
  17. Thank you for the explanations about the graph. What you say makes sense. I think this implies that the cores are sampled for analysis every so many mm? Chris Shaker
  18. Re: cjshaker (142) From the literature I've read, the Vostok and Epica cores were sampled every 0.5 to 2 meters, depending upon the depth (I don't recall offhand the spacing intervals from Greenland cores). The final several hundred meters of the Vostok core was deemed unusable due to heat penetration upwelling from Lake Vostok lying underneath the borehole at that point. The larger sampling interval actually carries with it fewer questions about the resulting resolution, due to the spacing involved. More frequent sampling might yield more data, but the resulting data would not necessarily add anything new. Changes in CO2 and temps in the paleo record occurred much more slowly than what we are physically measuring today. The Yooper
  19. Re: cjshaker This is a reply to your comment over on the 'It's a 1500 year cycle' thread: ---------------------------------------------------------------------------------------------------------- Re: cjshaker
    "I think the bottom line is that climate modelers don't really understand the glacial cycle, nor how it really works."
    And your source for that claim would be...? You may want to actually read up on models. Suggested starting points can be found here, here, here, here and here. The Yooper
  20. #143 Daniel Bailey at 00:14 AM on 4 December, 2010 Changes in CO2 and temps in the paleo record occurred much more slowly than what we are physically measuring today. We do not know that. At least the ice core record does not tell us anything about the swiftness of past changes. Or do you have other, undisclosed data sources to support your valiant claim? Here is the Historical CO2 Record from the Vostok Ice Core. As you can see the difference between Age of ice and Mean age of air in it is anywhere between 1879 and 6653 years (at depth 506.4 m and 3119.51 m respectively). Therefore it takes several millennia for carbon dioxide to get enclosed in Antarctic ice. With such a heavy smoothing the present spike or anything comparable to it is rendered invisible. In general it is a grave error to conclude from the fact you can't see an invisible thing that it does not exist either.
  21. Looking at the graph of temperature in the past 420,000 years, one thing that strikes me is that although the current interglacial period appears as though it may be lengthier than some previous ones, it doesn't appear to have reached the same peak value as some of the previous one's, actually falling significantly short (at present). Of course 5 datasets isn't much to go on, and the earth has been around for many million years, not just 420,000 years. But who am I to argue?
  22. #145: "it takes several millennia for carbon dioxide to get enclosed in Antarctic ice." How is that physically possible? "On average, the transformation of névé into glacial ice may take 25 to 100 years." Once the ice is fully frozen, why would there be any further aging of the air? How credible are these reported age discrepancies between ice age and air age?
  23. BP, the rate of change associated with YD type events is also assessed from lake records but I dont have reference handy - but read it in recent review by Wally Broecker. cjshaker - I agree that emerging from ice age, there is good evidence for very fast changes - too fast I think for modern agriculture to cope. We have too many hypotheses and insufficient data to start with total certainty the causes are but we take comfort from fact that these effects appear to only happen as climate emerges from glacial and not during interglacial, and that these appear to be hemispherical events not global events. The review in IPCC WG1, Chapter 6 on this is well worth reading.
  24. #147 muoncounter at 03:54 AM on 4 December, 2010 Once the ice is fully frozen, why would there be any further aging of the air? How credible are these reported age discrepancies between ice age and air age? It is explained here. Basically it's because ice is cold & accumulation rate is low. Bubbles are enclosed only near the firn-ice transition zone, about 90 m below surface. I am not sure however, that gas diffusion is stopped as soon as bubbles get enclosed. There's a microscopically thin boundary layer between ice grains where impurities get concentrated and supercooled liquid water is retained even at temperatures well below freezing.
  25. Daniel Bailey asks And your source for that claim would be...? Re: cjshaker >"I think the bottom line is that climate modelers don't really understand the glacial >cycle, nor how it really works." I make that claim because of articles like this one, which appear to show poor ability to predict the glacial cycle using models http://www.igsoc.org/annals/5/igs_annals_vol05_year1984_pg213-214.pdf And this one, which attempts to use spectral analysis to predict future behavior of the glacial cycle http://www.nosams.whoi.edu/PDFs/papers/surveysingeo_time_series.pdf Chris Shaker

Prev  1  2  3  4  5  6  7  8  9  10  11  12  13  14  15  16  17  Next

Post a Comment

Political, off-topic or ad hominem comments will be deleted. Comments Policy...

You need to be logged in to post a comment. Login via the left margin or if you're new, register here.

Link to this page


The Consensus Project Website

THE ESCALATOR

(free to republish)


© Copyright 2024 John Cook
Home | Translations | About Us | Privacy | Contact Us