Climate Science Glossary

Term Lookup

Enter a term in the search box to find its definition.

Settings

Use the controls in the far right panel to increase or decrease the number of terms automatically displayed (or to completely turn that feature off).

Term Lookup

Settings


All IPCC definitions taken from Climate Change 2007: The Physical Science Basis. Working Group I Contribution to the Fourth Assessment Report of the Intergovernmental Panel on Climate Change, Annex I, Glossary, pp. 941-954. Cambridge University Press.

Home Arguments Software Resources Comments The Consensus Project Translations About Support

Twitter Facebook YouTube Mastodon MeWe

RSS Posts RSS Comments Email Subscribe


Climate's changed before
It's the sun
It's not bad
There is no consensus
It's cooling
Models are unreliable
Temp record is unreliable
Animals and plants can adapt
It hasn't warmed since 1998
Antarctica is gaining ice
View All Arguments...


Username
Password
New? Register here
Forgot your password?

Latest Posts

Archives

Are we heading into a new Ice Age?

What the science says...

Select a level... Basic Intermediate

Worry about global warming impacts in the next 100 years, not an ice age in over 10,000 years.

Climate Myth...

We're heading into an ice age

"One day you'll wake up - or you won't wake up, rather - buried beneath nine stories of snow. It's all part of a dependable, predictable cycle, a natural cycle that returns like clockwork every 11,500 years.  And since the last ice age ended almost exactly 11,500 years ago…" (Ice Age Now)

At a glance

In something like a Day after Tomorrow scenario, the idea that a new ice-age was just around the corner was the subject of a book, a DVD and a website created in 2002. The author was a retired architect, by the way. Fortunately for us, both the movie and the quote above are figments of someone's fertile imagination. But let's have a quick look at ice-ages and what makes them tick, after which we hope you will agree that the notion that another ice-age is just around the corner is nonsensical.

Ice-ages, also known as glacials, are cold periods that occur in a cyclic fashion within an Icehouse climate state. Earth's climate has been mostly of the Hothouse type (no Polar ice-sheets). However, on occasion it has cooled down into Icehouse, as has been the case in the last few million years. There are regular variations in Earth's orbit around the Sun, taking place over tens of thousands of years. These affect the amount of Solar radiation reaching our planet. During the Icehouse state, such variations can lower and raise planetary temperature sufficiently to trigger swings between cold glacials – when ice-sheets expand towards the Equator – and mild interglacials – when the ice retreats back polewards.

To give an idea of the time-scales involved, Europe and North America have seen glacials and interglacials come and go repeatedly over the last 2.5 million years, this being known as the Quaternary Period of geological time. The last glacial period started 115,000 years ago and the Last Glacial Maximum (LGM), when the greatest ice extent was reached, was around 22,000 years ago. The current interglacial – also known as the Holocene, commenced 11,700 years ago.

A general pattern may be seen here with a long cooling down towards Glacial Maximum but a relatively quick warming into an interglacial. The speed of the warming-up part of the cycle is due to climate feedbacks. Removal of pale, reflective snow and ice cover revealing the darker ground beneath allows more solar heat energy to be soaked up. Melting of permafrost releases carbon dioxide and methane. These and other feedbacks serve to amplify the warming effect, speeding it up.

However, our burning of fossil fuels has happened on such a vast scale that we have blown such factors apart. The atmospheric concentration of CO2 has risen well above the 180-280 ppm range typical of recent glacial-interglacial cycles. The current level, getting on for 420 ppm, is more typical of the mid-Pliocene. That was a geological epoch that happened around a million years before the start of the Quaternary. Mid-Pliocene ice-sheets were much smaller than those of the present day. Rather than being due another glaciation, we can expect a continued transition towards mid-Pliocene conditions.

Please use this form to provide feedback about this new "At a glance" section, which was updated on May 27, 2023 to improve its readability. Read a more technical version below or dig deeper via the tabs above!


Further details

Because our current interglacial (the Holocene) has already lasted approximately 12,000 years, it has led some to claim that a new ice age is imminent. Is this a valid claim? No.

To explore this topic further, it is necessary to understand what has caused the cyclic shifts between ice ages and interglacials during the Quaternary period (fig. 1). Such shifts are in part a response to regular changes in the Earth’s orbit and tilt, which affect the amount of summer sunlight reaching high northern latitudes and were described by the Milankovitch Cycles, first proposed in the early 20th Century by Serbian mathematician Milutin Milankovi? (1879-1958). For more about Milankovitch cycles this NASA page offers lots of graphics and explanations.
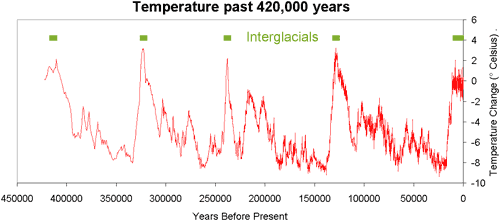
Figure 1: Temperature change through the late Quaternary from the Vostok ice-core, Antarctica (Petit et al. 2000). The timing of warmer interglacials is highlighted in green; our current interglacial, the Holocene, is the one on the far right of the graph.

When incoming sunlight declines in the high north, the rate of summer snow and ice-melt declines and the ice sheets begin to grow. When incoming sunlight increases, the opposite happens. So where are we in these cycles today? Changes in both the orbit and tilt of the Earth do indeed indicate that – were they singularly responsible for climate shifts - the Earth should be slowly cooling. However, recent research shows that is too simple. That's because we now have analyses of ice-cores going back 800,000 years or more. We have devised ways to use stable isotope ratios of various elements in things like fossils and we have developed many other proxy methods for telling us more about conditions in the relatively recent past that the Quaternary represents.

A number of irregularities in glacial-interglacial cycles have been determined, for example times when interglacials were skipped when orbital patterns suggest they should have happened. (Koehler and Van de Wal 2021). Such research has also been aimed at resolving the question of why Earth's 41,000 year obliquity cycle was a strong driver of glacial-interglacial transitions up until around one million years ago. Since then, glacials have instead typically lasted for much longer - around 100,000 years.

The importance of feedbacks within Earth's climate system has been increasingly recognised as the decades have gone by. A good example is the speed of transition from glacial to interglacial, which is relatively rapid because certain very effective climate feedbacks are involved. One such feedback involves albedo, defined as the ability of different bodies to absorb or reflect sunlight (e,g, Thackeray and Fletcher 2016).

Albedo is expressed on a scale of 0 (black body, absorbs everything) to 1 (white body, reflects everything. Fresh snow has a high albedo of as much as 0.9, whereas the muck revealed when old snow and ice cover melts has a much lower one in the range 0.2 to 0.4 – it can absorb lots more solar energy. So melting snow and ice leads to more heat energy retention, amplifying the warming (Fig. 2). 
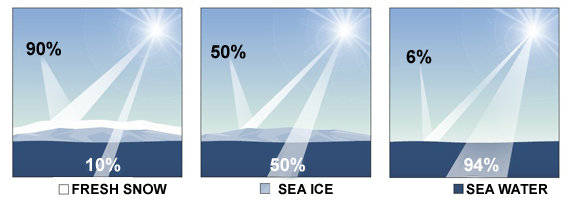
Albedo Explainer (John Mason)

Fig. 2: Albedo feedback explained. Freshly-fallen snow is highly reflective of incoming sunshine, so that most of the solar energy is simply bounced back towards space. Bare sea ice can potentially absorb about half of the incoming energy, so if conditions become warmer, causing the snow to melt, there’s more energy retained on Earth. If the sea ice melts too, then almost all of the incoming solar energy is absorbed by the much darker surface of the sea. So an initial warming directly results in further warming. Graphic: John Mason.

Another feedback happens when permafrost gets thawed out, since the ground is then able to release previously trapped CO2 and methane. During a glacial, the extent of permafrost is vast, so as it thaws, the release of such gases occurs on an enormous scale – again, amplifying the warming.

Researchers have also modelled ice-sheet dynamics, investigating how the sheets behaved as they melted, for example. It has been found that the shorter-lived, lower latitude Northern Hemisphere ice-sheets that existed prior to one million years ago were much thinner and therefore easier to melt. So ice-sheet dynamics looks to have a role in the much longer freeze-ups of the past million years. This all goes to show that glacial periods arise through a whole lot of factors interacting with one another, of which orbital cycles are but one, albeit important, cog in the gearbox and are not necessarily able to drive the climate system from one state (glacial) to another (interglacial) in total isolation (e.g. Bintanja and Van de Wal 2008; Berends et al. 2021).

Talking of cogs in the gearbox, we are another – and a big one. Our intentional disturbance of carbon reservoir rocks – what we do when we seek, extract and burn the fossil fuels – is unique in the geological record. It's a one-off in the planet's 4.56 billion year long history and while the consequent overloading of atmospheric CO2 levels is still insufficient to take Earth back into a Hothouse state yet, it is perfectly adequate to prevent another glaciation any time soon.

Last updated on 27 May 2023 by John Mason. View Archives

Printable Version  |  Offline PDF Version  |  Link to this page

Argument Feedback

Please use this form to let us know about suggested updates to this rebuttal.

Further reading

Tamino discusses predictions of future solar activity in Solar Cycle 24.

Acknowledgements

Many thanks to Sami Solanki for his invaluable advice and feedback as well as John Cross for his very helpful comments.

Further viewing

potholer54 published a video tackling this myth on June 27, 2020


Dave Borlace explains why we are not headed towards an ice age in this "Just have a think" video published in December 2019:


Denial101x video

Comments

Prev  1  2  3  4  5  6  7  8  9  10  11  12  13  14  15  16  17  Next

Comments 251 to 275 out of 411:

  1. Randy, setting aside the fact that we have absolutely NO idea what technology will be like in 50,000 years... the CO2 we have already released into the atmosphere is sufficient to prevent the next glaciation cycle. Basically, instead of the next Milankovitch swing taking us into a global glaciation it is now more likely to see a return to the sort of climate we had two hundred years ago. If we continue increasing atmospheric CO2 levels we may actually skip the next several glaciation events. However, again, we are talking about time-frames so large that circumstances could change completely due to things we cannot predict.
  2. 'good chance that the arctic melting will stop the Atlantic conveyer by dumpling lots of fresh (therefore lighter) water into the North Atlantic.' I dont believe there is any science supporting this, but please feel free to cite some. There is a postulate (and evidence) that the massive dump of fresh water from ice sheet melting caused a slow down and thus the YD event. However, this was an extremely rapid dump of a lot of water. Summer melt of seaice over many years is in a different order. Even if the Milankovich cycles were strong enough to cause another glacial with CO2 levels this high, the onset is extremely slow - 2 orders of magnitude less than current rate of change. It not a question of whether we would prefer warm or cold - its the rate of change that is dangerous.
  3. scaddenp @252, this press release from NASA details some of the latest research. In essence, models predict a slowing of the Atlantic Conveyor with increased melt water because fresh water is less dense than salty, and hence less prone to sink. Josh Willis has used buoy data and satellite data to show the Atlantic Conveyor sped up by 20% from 1993 to 2009, contradicting earlier ship-based data. There has been no statistically significant change from 2002-2009. The acceleration is attributed to a possible natural cycle. However, I would note that Greenland ice melt has primarily been in areas where it would feed the Labrador current. Further, because of the reducing volume of sea ice, it is not clear the more extensive summer melt back results in more fresh water being introduced to the Arctic Ocean. The point is that there are obvious complexities in this issue, not all of which I have covered (or are competent to cover). If you want to become up to date on the issue, this google scholar search will get you started ;)
  4. Tom, this seems to back my view - current melting isnt going to do anything dramatic, especially not another ice age. From the release: "No one is predicting another ice age as a result of changes in the Atlantic overturning," said Willis. In short, worry about warming, not a coming ice age.
  5. Randy Subers @248, you are missing the obvious point that well before the 50 K years the Greenland Ice Sheet will have melted away, as will the Arctic Sea Ice (much earlier). Therefore in 50 K years there will not be massive charges of melt water to slow the conveyor because there will be no melt water remaining from our entry into the anthropocene. Whether we could return to an ice age in 50,000 years depends critically on how much CO2 we emit in the coming 100 to 200 years. If we keep it below 1000 tonnes of carbon, then in 10,000 years CO2 levels may have declined enough so that Milankovitch cycles can restart the recent pattern of glacials and interglacials. Should we continue at business as usual, however, even 50 thousand years from now, CO2 levels may still be too high for that process to recommence.
  6. Phil/Tom, there's also this paper: Effect of the potential melting of the Greenland Ice Sheet on the Meridional Overturning Circulation and global climate in the future - Hu (2011). I always save copies of papers that interest me when I'm trawling the internet, and your discussion rang a few bells. The modelling shows that even high rates of Greenland icesheet melt over the coming centuries will only slow global warming by a few tenths of a degree. Hardly enough to start a new ice age. If only eh?
  7. OK this is stupid, we can predict things, but only to a degree. Apparently we are also long overdue for a super volcano eruption under yellow stone park, but it hasnt happened yet. The only thing that we have actually proved right from prediction, is that there is 365 days in a year, not counting leap years, So everyone can calm down, I dont think we will be in an ice age in any time soon.
  8. "The degree" varies wildly however. You can predict sunrise etc with very high degree of accuracy. You can also predict the changes in insolation due to the Milankovitch cycles which drive the ice cycle with a very high degree of accuracy, but climatic effect of that change also depends on other factors - especially level of GHGs. On the other hand, volcanoes are unpredictable with no known physical basis to a "cycle". A statistical recurrance period should never be confused with a prediction. Saying we are "long overdue" for an eruption smacks of pop-sci documentaries, and I would be interested if you have a science paper that says that. The basis for saying that there wont be an iceage soon is a/ Berger, A. and Loutre, M. F. (2002) which consider that orbital drivers, and b/ our GHG levels are getting to Pliocene levels - too high for an iceage.
  9. This is very interesting. In the past there were short and "very warm", but now we are in a semi long "warm" phase. According to the chart global temperatures were way higher in the past than they are now so the heat doesn't seem so bad compared to back then.
  10. Depends on your definition of bad. Global sea level was many metres higher during the last interglacial, the Eemian, despite global temperatures being equivalent to either, the mid-twentieth century, or perhaps 1-2°C warmer than now. When one considers the amount of infrastructure put at risk by such a rise in sea level, I'd classify that as bad. And that is but one consequence of a future warmer world.
  11. qwop, it never was about the absolute temperature. It's about the rate of change. Go back through the data and see how many periods you find that feature a 3C global temp increase over 300 years. You might check out the PETM event for starters. Of course, that event was 24x slower.
  12. The isotope proxies for temperature and glacial ice volume correlate with the Earth’s orbital variations, but the correlations are far from perfect. The “internal” climate drivers of glacial-ice area, oceanic circulation, and water vapor transport interact to cause the large 100,000-year spikes and other noise variation in the long-term records of Vostok ice and ocean sediments. One such driver is the loss of northern perennial polar ocean sea ice due to CO2 warming. That ice may be gone by 2020 according to a simple extrapolation. There is a plausible connection between its loss and the initiation of the last ice age 120,000 years ago, and the next ice age may likewise begin in the next decade – because of our current warming. I am working on it, so stay tuned.
  13. Nonsense. You forget about the most important forcing present today, the previously-sequestered, anthropogenically-derived fossil-fuel CO2 slug we are injecting back into the carbon cycle. This forcing simply wasn't present at previous interglacial/glacial transitions. But then, actual scientists have already looked into this (as opposed to semimythical cycles); let's examine the facts, shall we: The oceans have been absorbing an extra 2 Hiroshima-bombs-worth of energy, PER SECOND, since 1960. That warming continues to this day, unabated. Per Tzedakis et al 2012
    glacial inception would require CO2 concentrations below preindustrial levels of 280 ppmv
    (for reference, we are at about 391 right now…and climbing). Earlier, Tyrrell et al 2007 examined this, concluding that we have already skipped the next glacial epoch. Furthermore, Tyrrell concludes that if we continue our present fossil fuel consumption,
    "Our research shows why atmospheric CO2 will not return to pre-industrial levels after we stop burning fossil fuels. It shows that it if we use up all known fossil fuels it doesn't matter at what rate we burn them. The result would be the same if we burned them at present rates or at more moderate rates; we would still get the same eventual ice-age-prevention result."
    and
    "Burning all recoverable fossil fuels could lead to avoidance of the next five ice ages."
    So no glacial epochs the next million years… Facts, like tiggers, are wonderful things, for those who have them.
  14. Daniel, all facts are not relevant, but this fact is: lower temperatures did not trigger the last ice age, 120,000 years ago. The severe climate with its winter sea ice vanished in northern Baffin Bay in a warming implied by unusual willow pollen and the more negative oxygen isotope ratios at the bedrock base of the Devon ice core (Koerner et al, 1988). East of southern Baffin Island at the site of sediment core HU75-58, 60% of the foraminifera were warm water species, now absent in today’s cold seas (Fillon, 1985). The warmer waters west of Greenland imply a cyclonic circulation and cloudy weather with heavy snowfall over Baffin Island, Quebec and Labrador. The heavy precipitation increased erosion that is confirmed by the large abrupt ~500 year pulse of hematite-containing sediment in a deep-sea record (Adkins et al., 1997). During that 500-year interval glacioeustatic sea level fell about 2.5 m, as measured on presently uplifted Barbados (Johnson, 2001) at the Cane Vale B site. Ice-free seas west of Greenland may again trigger an ice age. Ice-free seas can be established only if there is no sea-surface stratification there, and that only if the less dense polar water inflow through the Nares Strait ceases, and that only if the perennial sea ice on the polar ocean goes away, consequently enabling a warmer polar atmosphere in winter and a lower atmospheric pressure that reduces or eliminates polar water inflow through the Nares Strait. Indeed, the increasing atmospheric CO2 may eventually terminate our next ice age hundreds of years later, but during the first century after year 2020 when the perennial polar sea ice is gone, it is very likely that Canada will see widespread thickening snow fields on now bare summer tundra, and temperate climate trees in northern Europe will vanish, like their pollen vanished from the record 120,000 years ago (Field et al., 1994). You only need to wait another ten years to see if this triggering prediction is right or wrong.
  15. Again, human fossil fuel bolus injections were not around in previous interglacials so you still are comparing apples to guavas. I'll trust what the science has to say about this current interglacial. And the verdict is that ice ages are not recurring anytime soon. Not while human activities are acting to retard their formation. Not on our watch, as they say. See? No waiting necessary.
  16. Robert, Can you provide a citation to peer reviewed data supporting your wild hand waving or is this original thought of yours unsupported by actual data?
  17. As a wise man once said: “ It’s not what we don’t know that slows our progress, it’s what we think we know that isn’t true.” Conventional wisdom says that the last ice age began by cooling in the Baffin Island area, but a detailed examination of the evidence shows that it began by a large precipitation increase under warmer oceanic conditions. Please note that the Penney and Barnes ice caps on Baffin Island and the Devon Island ice cap have survived to this day, and would surely grow if they had a large moisture supply. To argue the next ice age climate change about the year 2020, we need to consider the known evidence for the last initiation, explain that evidence, and apply that explanation to the next decade or so. There are two parts to this argument: (1) the evidence, and (2) the explanation. Here are the references for Part 1: For a warmer ice-free Baffin Bay precisely when new glaciation began: Koerner, R.M., Bourgeois, J.C., and Fischer, D.A., 1988, Pollen analysis and discussion of time-scales in Canadian ice cores: Annals of Glaciology, v. 110, p. 85-91. For extreme warmth in the Labrador Sea east of southern Baffin Island: Fillon, R.H., 1985, Northwest Labrador Sea Stratigraphy, sand input and paleoceanography during the last 150,000 years: in Andrews, J.T., ed., Quaternary Environments: Eastern Canadian Arctic, Baffin Bay and Western Greenland, Boston: Allen and Unwin, p. 210-247. For the ~500 year pulse of clay and hematite showing heavy regional precipitation and erosion: Adkins, J.F., Boyle, E.A., Kegwin, L., and Cortijo, E., 1997, Variability of North Atlantic thermohaline circulation during the last interglacial period: Nature, v. 390, p. 154-156. For the glacioeustatic sea level fall in that ~500 year interval, see the Cane Vale B transect in fig. 2 in : Johnson, R.G., 2001, Last interglacial sea stands on Barbados and an early anomalous deglaciation timed by differential uplift: Journal of Geophysical Research, v. 106, no. C6, p. 11543-11551. In Part 2, the key to the explanation was the collection of data in 2011 using the ESA ENVIISAT system that showed that atmospheric pressure differences dominate the flow of polar water into Baffin Bay, and the realization that a lower polar pressure could cause an ice-free Labrador Sea and Baffin Bay. The ice-free Baffin Bay in the absence of polar water stratification has a perfect analog in the ice-free Greenland Sea extending northward to Svalbard to where the ice on the polar ocean can form due to the river discharge stratification there. The timing of year 2020 is obtained from the web site: http://arctic.atmos.uiuc.edu/cryosphere/ where you can draw your own curve through the points of seasonal minimum sea-ice area, a curve that I extrapolate to zero about 2020. The reason why and when the warm Baffin-Labrador Sea conditions ended, together with the other physical, meteorological and oceanic parts of the explanation, are embodied in a paper too long for this forum and which was rejected recently by “Geology,” perhaps because of the wise man effect, above. The next ice age may not last for thousands of years under rising CO2 concentrations, but a short-term validation of this prediction will make Canada and northern Eurasia much more unpleasant and will result in very difficult political and societal problems. It would be better to recognize the coming change sooner than later.
  18. Sorry, I omitted the Field et al. reference for the absence of temperate climate trees in northern Germany: Field, M.H., Huntley, B., and Müller, H., 1994, Eemian climate fluctuations observed in a European pollen record: Nature, v. 376, p. 779-783.
  19. Robert, Why did scientists stop producing papers that you can cite over a decade ago? Can you cite a paper that suggests that warm temperatures over Baffin Island initiated the ice ages? The Milankovitch cycles are generally presumed to initiate the ice ages by cooling the Northern Hemisphere. This slow cooling allows snow to accumulate in Northern Canada. Please provide a recent citation that claims warm water in the Baffin area initiated the ice ages. Your supposition that an ice free arctic, deduced by eyeballing the Cyrosphere Today graph, will cause snow to accumulate is the opposite of the snow records observed at the National Snow lab at Rutgers. Those records show a dramatic decrease in the summer snow levels across the Northern Hemisphere.
  20. Further to Michael Sweet's comment @269, Milankovitch cycles are supposed to initiate glacials by cool summers failing to melt snow, thereby increasing albedo with a progressive cooling over time as a result. Merely piling more snow onto a preexisting ice cap will not increase albedo, and so cannot initiate an glacial. As it happens, with a warmer world, NH summer snow extent has decreased significantly, the reverse of that required to initiate a new glacial (July shown): What is more, ice caps are not accumulating ice on Baffin Island, rather they are melting. Zdanowicz et al (2012) report:
    "At latitude 67°N, Penny Ice Cap on Baffin Island is the southernmost large ice cap in the Canadian Arctic, yet its past and recent evolution is poorly documented. Here we present a synthesis of climatological observations, mass balance measurements and proxy climate data from cores drilled on the ice cap over the past six decades (1953 to 2011). We find that starting in the 1980s, Penny Ice Cap entered a phase of enhanced melt rates related to rising summer and winter air temperatures across the eastern Arctic. Presently, 70 to 100% (volume) of the annual accumulation at the ice cap summit is in the form of refrozen meltwater. Recent surface melt rates are found to be comparable to those last experienced more than 3000 years ago. Enhanced surface melt, water percolation and refreezing have led to a downward transfer of latent heat that raised the subsurface firn temperature by 10°C (at 10 m depth) since the mid-1990s. This process may accelerate further mass loss of the ice cap by pre-conditioning the firn for the ensuing melt season. Recent warming in the Baffin region has been larger in winter but more regular in summer, and observations on Penny Ice Cap suggest that it was relatively uniform over the 2000-m altitude range of the ice cap. Our findings are consistent with trends in glacier mass loss in the Canadian High Arctic and regional sea-ice cover reduction, reinforcing the view that the Arctic appears to be reverting back to a thermal state not seen in millennia."
    Fisher et al (2012) report:
    "There has been a rapid acceleration in ice-cap melt rates over the last few decades across the entire Canadian Arctic. Present melt rates exceed the past rates for many millennia. New shallow cores at old sites bring their melt series up-to-date. The melt-percentage series from the Devon Island and Agassiz (Ellesmere Island) ice caps are well correlated with the Devon net mass balance and show a large increase in melt since the middle 1990s. Arctic ice core melt series (latitude range of 67 to 81 N) show the last quarter century has had the highest melt in two millennia and The Holocene-long Agassiz melt record shows that the last 25 years has the highest melt in 4200 years. The Agassiz melt rates since the middle 1990s resemble those of the early Holocene thermal maximum over 9000 years ago."
    Sharp et al (2011) report:
    "Canada's Queen Elizabeth Islands contain ∼14% of Earth's glacier and ice cap area. Snow accumulation on these glaciers is low and varies little from year to year. Changes in their surface mass balance are driven largely by changes in summer air temperatures, surface melting and runoff. Relative to 2000–2004, strong summer warming since 2005 (1.1 to 1.6°C at 700 hPa) has increased summer mean ice surface temperatures and melt season length on the major ice caps in this region by 0.8 to 2.2°C and 4.7 to 11.9 d respectively. 30–48% of the total mass lost from 4 monitored glaciers since 1963 has occurred since 2005. The mean rate of mass loss from these 4 glaciers between 2005 and 2009 (−493 kg m−2 a−1) was nearly 5 times greater than the 1963–2004 average. In 2007 and 2008, it was 7 times greater (−698 kg m−2 a−1). These changes are associated with a summer atmospheric circulation configuration that favors strong heat advection into the Queen Elizabeth Islands from the northwest Atlantic, where sea surface temperatures have been anomalously high."
    Finally, Schrama et al, (2011) report:
    "In this paper we discuss a new method for determining mass time series for 16 hydrological basins representing the Greenland system (GS) whereby we rely on Gravity Recovery and Climate Experiment (GRACE) mission data. In the same analysis we also considered observed mass changes over Ellesmere Island, Baffin Island, Iceland, and Svalbard (EBIS). The summed contribution of the complete system yields a mass loss rate and acceleration of −252 ± 28 Gt/yr and −22 ± 4 Gt/yr2 between March 2003 and February 2010 where the error margins follow from two glacial isostatic adjustment (GIA) models and three processing centers providing GRACE monthly potential coefficient sets. We describe the relation between mass losses in the GS and the EBIS region and found that the uncertainties in all areas are correlated. The summed contribution of Ellesmere Island, Baffin Island, Iceland, and Svalbard yields a mass loss rate of −51 ± 17 Gt/yr and an acceleration of −13 ± 3 Gt/yr2 between March 2003 and February 2010. The new regional basin reconstruction method shows that the mass loss within the southeastern basins in the GS has slowed down since 2007, while mass loss in western basins increased showing a progression to the north of Greenland."
    The reported ice mass loss for Baffin Island alone is -10.8 Gt/year. In sum, ice sheets and ice caps in the Canadian archipelago are loosing ice with warmer weather, the opposite to the effect predicted by Robert. His theory is therefore falsified.
  21. Tom, Thanks for the references. I checked the Rutgers snow lab and only 0.16 million km2 of snow cover remained in week 31 this year, not counting Greenland. At least the anomaly will stop going up, since all the snow is gone. A lot of permafrost is also melting, but I do not have a reference at hand. NSIDC probably has something. Robert, what is your response to this data?
  22. Wait, didn't I see a movie about this once?
  23. Michael, (-snip-).
    Response: [DB] Ignoring the proof citation challenges and the challenges of physical reality contravening your hypothesis put forth earlier by Michael Sweet and by Tom Curtis, it is not helpful to avoid dealing with those challenges and to blithely comment away. You must first deal with those before moving on. Soliloquy snipped.
  24. Worry about global warming impacts in the next 100 years, not an ice age in over 10,000 years.


    Looking at fig1,it appears that an ice age is due any minute, not in 10,000 years. 

    Another bit of information to take from fig 1, it looks as if  all the previous interglacials were warmer than the current one.  Who decided that the temp after the industrial revolution was the "accurate" temperature the earth should be at, and that we are exceeding that perfect temp?

  25. @ Kevin

    "Looking at fig1,it appears that an ice age is due any minute, not in 10,000 years. "

    Umm, got any physical basis for that?  Any at all?  "Eyecrometers" do not count.


    Frankly, your entire above comment is an example of simplistic thought, tired fake-skeptic talking points and unsupported rhetoric constituting sloganeering (a violation of the Comments Policy here).

Prev  1  2  3  4  5  6  7  8  9  10  11  12  13  14  15  16  17  Next

Post a Comment

Political, off-topic or ad hominem comments will be deleted. Comments Policy...

You need to be logged in to post a comment. Login via the left margin or if you're new, register here.

Link to this page


The Consensus Project Website

THE ESCALATOR

(free to republish)


© Copyright 2024 John Cook
Home | Translations | About Us | Privacy | Contact Us