


 Arguments


Global cooling - Is global warming still happening?
What the science says...
| Select a level... |
 Basic
Basic
|
 Intermediate
| |||
|
All the indicators show that global warming is still happening. |
|||||
Climate Myth...
It's cooling
"In fact global warming has stopped and a cooling is beginning. No climate model has predicted a cooling of the Earth – quite the contrary. And this means that the projections of future climate are unreliable." (source: Henrik Svensmark)
At a glance
Earth's surface, oceans and atmosphere are all warming due to our greenhouse gas emissions, but at different rates. Some places are also warming much faster than others: parts of the Arctic for example. That variability is partly because other phenomena act to offset or enhance warming at times. A good example are the effects of La Nina and El Nino, an irregular variation in winds and sea surface temperatures over the tropical eastern Pacific Ocean that can influence temperatures and rainfall patterns right around the world.
El Nino causes even warmer years whereas La Nina tends to peg temperatures back to an extent. Thus 2023 – an El Nino year - was the warmest year on record, according to the USA-based National Oceanic and Atmospheric Administration, but other recent years have not been far behind – 2016 and 2019 are in second and third place respectively. The worrying thing is that 2019 only saw a mild El Nino. And even with a La Nina featuring, 2021 and 2022 were, respectively, still the seventh and sixth hottest years on record.
The year 1998 featured a massive El Nino and consequent temperature spike that was a strong outlier, well above the steady upward trend. That spike and the subsequent return to a more “normal” warming pattern led to claims in the popular media that global warming had “paused” or had even stopped. This was a typical misinformation tactic that, as usual, time has proved wrong. As things currently stand, the top ten warmest years have all been since 2010 and 1998 is nowhere to be seen any more. By modern standards, it simply wasn't warm enough.
Please use this form to provide feedback about this new "At a glance" section. Read a more technical version below or dig deeper via the tabs above!
Further details
In the years following 1998, at the time the hottest year on record, there was a concerted misinformation campaign to convince the public that global warming had variously slowed down, stopped or even that we were entering a period of cooling. Of course, we now know that such claims were nowhere near correct. In today's top ten ranking of warmest years, the year 1998 is nowhere to be seen. It simply wasn't warm enough. So let's take a look at how the claims came about, because they reveal insights into the methodology of those who design and spread misinformation.
The entire planet continues to accumulate heat due to the energy imbalance created through our greenhouse gas emissions. Earth's atmosphere is warming. Oceans are accumulating energy. Land absorbs energy and ice absorbs heat to melt. Year to year ups and downs in these things are simply noise, reflecting variations in how that heat is moved around the planet and what other influences are at work, such as the irregular El Nino Southern Oscillation (ENSO) that can nudge the global temperature one way or another by up to 0.3C. That's why 1998 was such a warm outlier: it coincided with a very strong El Nino. El Nino conditions always warm things up whereas La Nina conditions cool things down (figure 1).
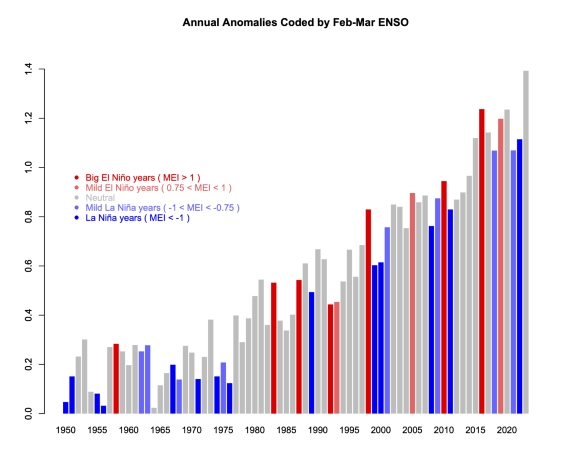
Figure 1: GISTEMP anomalies to end-2023 (with respect to late 19th Century), coded for ENSO state in the early spring - red is El Nino, blue La Nina. 2023 is in grey because that El Nino did not develop until later in the year. Graphic courtesy of Realclimate.
Climatologists routinely use multi-decadal blocks of time when presenting temperature trends for a very good reason. Such blocks allow you to stand back and look at the bigger picture. Due to the noise, taking a much shorter time-span – say just five or ten years – allows you to say anything you like about trends, depending on the particular block you pick.
For example, if you picked a short run of 5-10 years ending in 1998, you could have – if you were so inclined – said, “look how fast it's warming!” Likewise, taking a number of years starting with 1998, you could have made the equally invalid claim that global warming had stopped. And of course, that claim was made, vociferously, in the early-mid 2000s. It was a classic example of cherry-picking: the manifestly unscientific practice of choosing the data that supports the argument one is paid to make on behalf of those who sponsor misinformation campaigns. Once you know about such tricks, you can challenge them yourself. You can ask someone why they showed such a short temperature record when showing a much longer one is the normal practice.
It is difficult but technically possible to filter out the noise described above from temperature datasets. In the paper Foster and Rahmstorf (2011) the authors used the statistical technique of multiple linear regression to filter out the effects of ENSO, solar and volcanic activity (Figure 2). They found that the underlying global surface and lower atmosphere warming trends have in fact remained steady in recent years. There's still noise in there but nowhere near as much. We were still warming all along.
Figure 2: Five datasets of global surface temperature and lower troposphere temperature are shown before and after removing the short-term effects of the El Niño Southern Oscillation (ENSO), solar variability, and volcanic aerosols. A 12-month running average was applied to each dataset.
Last updated on 4 June 2024 by John Mason. View Archives


According to the NCDC, last winter was the 62 coolest winter (December 2103-Feb 2014) in Vermont. On the other hand, it was the warmest ever recorded winter in California. Jetfuel needs to check his "facts" before he posts. They are currently having large wildfires in California since it was so warm in the winter. Globally (since it is called Global Warming) it was the eighth warmest Dec-Feb ever.
I will leave the other"facts" in place as the moderator asks.
<Snip>
[PS] You have already been warned on sloganeering and cherry-picking (2% area of earth, short time intervals). If you can explain why such cherry-picking has any significance then your post will stand. The issue has been explained to you in earlier responses which it appears you did not bother to read.
Jetfuel, I believe you've failed to respond to a wide range of criticisms of your posts. Now you use 1.6% of the Earth's surface to represent the whole. Brilliant, I must say. Such analytical saavy will get you far in major journals such as Energy & Environment. Snort. Bye bye, jetfuel. This was likely the straw--or cherry--that broke the dromedary.
Jetfuel.
Please note that posting comments here at SkS is a privilege, not a right. This privilege can and will be rescinded if the posting individual continues to treat adherence to the Comments Policy as optional, rather than the mandatory condition of participating in this online forum.
Moderating this site is a tiresome chore, particularly when commentators repeatedly submit offensive, off-topic posts or intentionally misleading comments and graphics or simply make things up. We really appreciate people's cooperation in abiding by the Comments Policy, which is largely responsible for the quality of this site.
Finally, please understand that moderation policies are not open for discussion. If you find yourself incapable of abiding by these common set of rules that everyone else observes, then a change of venues is in the offing.
Please take the time to review the policy and ensure future comments are in full compliance with it. Thanks for your understanding and compliance in this matter, as no further warnings shall be given.
This posts suggests that surface temps are not increasing because the energy is going to another part of earth's energy budget (the ocean). I've also seen the Kaufman, et al. arguments (http://www.pnas.org/content/108/29/11790.full) that the 'pause' in warming is due to less energy entering our system due to a variety of reasons. I'm trying to reconcile the two competing ideas: hidden warming (ocean) versus no actual warming. Can anyone shed light on the current thinking regarding these ideas?
Alterna @255:
1) The Earth continues to warm as measured by Global Mean Surface Temperature (GMST). The so called "hiatus" refers to the fact that taken over short time periods, the trend in GMST is not distinguishable from zero. However, it is also not distinguishable from the IPCC projected rate of warming. If the former fact means there is no warming, then by parity of reasoning the later fact must mean we are warming at the IPCC predicted rate. That reasoning leads directly to a contradiction. The correct interpretation is that by our best estimate we are warming at a slightly reduced rate relative to prior periods, but that because of the short term nature of the trend, we are unsure how much the trend has reduced or increased.
2) The unstated assumption of the talk about a "hiatus" is that 1998 (the pivotal year for claims of a hiatus) was a year with a normal, or near normal temperature. If it was not so, determining trends from 1998, or near to but including 1998 is equivalent to a survey claiming the land slopes down as you go inland because most of the land is below the pinacle of a large hill on the coastline. In fact, 1998 was far above the temperature trend of the time, and from 1998 it is not until 2010 that temperatures fall persistently the 1970-1998 trend, as illustrated below:
Of the years falling below the trend after 1998, all have a low MEI score, indicateing La Nina like (or at best neutral) conditions. Using the SOI they are even more strongly La Nina like years. Given this the most natural interpretation is that the ongoing trend since 1970 has continued unabated, and that the "hiatus" is purely an artifact of a transition from a record breaking (or near record breaking, depending on index used) El Nino to a near record breaking (or record breaking, again depending on index) La Nina in 2011/12. If anything, the surprise is why 2011/12 were so close to the continuation of the trend.
The ENSO explanation of the pause is very simply confirmed by seperately taking the trends of El Nino, Neutral, and La Nina years:
The near exact agreement of the trends show that it is the primary explanation of the phenomenon.
It is also essentially the same explanation as the idea that the heat has been moved into the ocean (that being the effect of a shift from El Nino to La Nina).
3) There is also good, and independent indications of reduced forcings over the later half of the purported "hiatus". There is no reason why these two explanations should be contradictory. For all we know, temperature trends may have accelerated without a reduction in forcing, and the ENSO impact. Taking the two sets of information at face value, it would have. We therefore need to judge the evidence of the reduced forcings on its merits and not assume that it somehow renders the ENSO explanation invalid.
Simpleton here with a dumb question. This has probably been answered multiple times but I'm not finding any reference in the main posts. There are 6 long pages of comments that I haven’t read through.
Much has been made of the hiatus in warming. It seems like it is (at present) small compared to the cooling in the 40’s to 70’s. This seems apparent from your graph on the PDO post. I read that the cooling seen from the 40’s to the 70’s was due to aerosols from industrial pollution and volcanism (see New Scientist) and that the temperature began ramping up after clean air legislation in England and Europe followed by similar legislation in the US.
Is there any new data on aerosols from Asia and India and how those may be affecting global average temperatures? Is the aerosol affect still thought to be the main culprit in the post WWII dip? Didn’t I also read that the aerosols were thought to be a factor in shifting rainfall patterns that created multi-year drought conditions in North Africa? Are people looking at how aerosol pollution from Asia may be affecting the drought in the American Southwest?
I am a long time lurker and occasional commenter here and I need some help. I received a link to this article from my Dad yesterday and it is so full of nonsense I dont even know where to start debunking it. I can find no outside information on the 'scientist' John L Casey. All claims about his expertise and history seem to come from the bio on his website.
The Dark Winter linked to reads like an elaborate scam to get money from the gullible and paranoid. It is full or random unsourced claims, about Al Gore, Global Cooling, and scams. Please help me out guys and gals. If there is a more appropriate "Help Me" page
pbjamm - Given comments from long-known denier organizations like JunkScience:
or blogger Tom Nelson, who thinks that SSRC is a scam, and longtime WUWT commenter Leif Svalgaard:
SSRC is not a source to be relied on. Even known loons think so.
Thanks KR. I worked up a response and included Leif Svalgaard's comment. It is kind of long winded but there is so much wrong information in the article that it is hard to cover it all. If anyone is interested I can post it here.
pbjamm - He's clearly a scam artist, there's probably little need to waste time on him, or to give him publicity.
Agreed but I am compelled to respond to my Dad in what I am sure will be a vain attempt to inform him.
pbjamm, if you follow the link to find out how to obtain your free copy of his book (it turns out you can obtain the free book by sending him $5 - and I doubt very much you will be sent the hard cover version shown, and suspect you will be emailed a PDF), you find a list of his basic arguments. They are in order:
1) Climate Science is a conspiracy for financial gain (maintained without evidence, emphasizes the amount at stake by confusing "border protection" with customs and immigration control. Perhaps that is an American usage, but I would have taken border protection to include the entire activities of the Homeland security department plus the military, on which basis his claims are egregiously false.)
2) It has not warmed. Based solely on RSS over the last 39 years. He makes the outrageously false claim that temperatures have only been measured for the last 39 years (news, of course, to the Hadley Center, University of East Anglia, NOAA, GISS, BEST, and the maintainers of the Japanese index, whose name currently escapes me).
3) Global warming has paused (based solely on RSS temperatures which he incorrectly also attributes to NOAA and NASA on the basis that those agencies use the data. If he is a scientist, he knows that his attribution on that basis is fraudulent.
4) The oceans are getting colder, for which his evidence is:
5) Arctic sea ice extent is growing (based on the fact that 2013 had more ice than 2012)
6) There is no consensus (based the fact that Al Gore emits CO2, and on the fraudulent claim that the Cook et al consensus is actually 1%)
7) Climate has changed before; based on the unsupported claim that climate change was a big factor in Alexander the Great's conquest of Persia (which is possible, but news to me), and the LIA.
He then goes into his own version of it's the Sun, based on mathturbation which is presumably in the book so I cannot comment further, except to note that it is not original (not even in 2007) and is definitively refuted by direct measurements of solar forcing.
Finally he finishes with the obligatory UEA email hack out of context quotations.
All these have been copiously discussed on SkS before, and most feature in the climate myths. If you want a more detailed rebutal, you will need to spend $5 US for your "free" book that even the pseudoskeptics consider a scam, but I am not going to waste my money (which is better spent on one seventh of a scientific paper).
A sceptic does not need to prove that some different or opposite phenomenon is taking place. Sceptics check specific theories. To the extent that observed phenomena matter, it is in whether or not the theory's *predictions* have come true.
In the case of climate change theory, the predictions are necessarily over a substantial period of time - at least 10 years in virtually all cases. Why? Because the climatologists making the predictions claimed (and still do) that they are working with "climate" as opposed to "weather", and that the former must necessarily relate to averages taken over time (always at least 10 years' smoothing of annual weather data).
Therefore, for enough new data to "arrive" to determine the climate (without needing to bring in annual data from years that have already happened) we have to wait that long. Thus the most recent predictions we can actually test are at least 10 years old. Or, to put it another way, the "state of the art" of *tested* climate change theory is at least 10 years old (longer for particular varaints of the theory that demand longer averaging times). Everything spoken and written since then is still just *conjecture*.
The theories that are old enough to test speak of "global average surface air temperatures". Be careful about revisionism here - we sometimes see attempts to update the theory to something that could maybe match current measurements, but every time you check them you will find the originals are about surface air temps.
The so-called "pause" may or may not amount to slight cooling or slight warming. But the predicitons as made in 2005 and earlier, all predicted very *large* rises by now. They really have been refuted by the pause.
Attempts to "explain" the pause are all examples of more recent work - to be valid they must produce their own predictions, and we must wait and see (long enough for a true "climate" average to be determined that doesn't depend on annual data already known). Maybe they will succeed (though to even get published they need to be somewhat catastrophic in nature, so unless a catastrophe actually occurs, my prediction is probably not).
Certainly, deep ocean heating is nothing to do with what was predicted. Does deep ocean heating imply an equivalent conclusion? Well, even if it did, that does not make for a successful prediction. If I predict apples will grow but instead get oranges, I am not a successful fruit predictor!
Does deep ocean heating mean we should immediately accept a new kind of global warming based only on current data? In other words, is the fact alone support of a new alarmism without the need for successful predictions? Of course not. Like the surface temperature warming before the pause, deep ocean heating has other explainations including random natural fluctuations.
Oh and finally, why not check how they know the deep oceans are heating. I think you'll find they don't. It hasn't been measured and is only an extrapolation based on an "overall energy budget" theory which itself has no experimental confirmation as well as being heavily reductionist in nature.
A.R.S.Says @ #264 :
Alas, you have got your thoughts into a terrible tangle.
Please read through the educational material on this website, which will help you gain a scientific understanding of the real situation.
(btw, I must commend your sense of humour in choice of your nom-de-plume ~ the abbreviation is priceless.)
[JH] Inflamatory & off-topic.
A Real Skeptic would note that if you wish to test a theory, you test whether the data falls within the uncertainty range of the prediction. If you did so for the last 18 years to date (Sept 2015) on GISTEMP, you would find a trend of 0.118 +/- 0.104 C/decade, giving an upper bound (0.222 C/decade) that includes the model predictions but a lower bound that excludes the possibility of a zero or negative trend. Ergo the model predictions have not been falsified.
It might be claimed that the HadCRUT4 trend (0.079 +/- 0.105 C/decade) falsifies the model predictions, but a Real Skeptic would realize that:
1) HadCRUT4 is not a global index, as it excludes the Arctic (plus parts of Africa and Asia), so the correct comparison would be with a HadCRUT4 mask of the model predictions (which I do not have available);
2) That cherry picking a year in which annual variations have lifted the temperatures well above the trend variation at the time as the start point (such as 1997 or 1998) distorts the statistics, so that the normal statistical test will generate a excess of false negatives relative to the standard case; and
3) That even apart from such distortions, 5% of "failed" statistical results will be false negatives (of which 2.5% will be false negatives showing to low a trend).
Therefore a Real Skeptic would always apply their test across a range of years and compare the resulting PDF to the prediction, rather than just using a small number of cherry picked starting points. Doing this clearly shows the predictions to have not yet been falsified.
Finally, a Real Skeptic would know that the shortest period referred to as a climate normal is 20 years, and the typical period is 30 years. Therefore they would never use less than a 20 year period to test a climate prediction. They would recognize the attempts to use 15 year periods (three years ago) growing up to 18 years (now, so as to carefully keep 1998 as the start year) represent carefull propaganda rather than actual analysis of the climate trend against the climate prediction.
ARRS
You don't define what you mean by deep ocean.
If you mean the true Abyssal ocean, below 2000 meters then there has seemingly been little warming.
If you mean the ocean down to 2000 meters there has been warming And it is not an extrapolation of anything. It is a measurement using the ARGO system.
In April in the NE,USA there was a 'white easter', during the month there was 16 feet of snow in PA, even more in colorado..and it's STILL cold even as of middle of May.. it has snowed for the first time in many tropical area's.. as these agencies claim 'this is the hottest ever' .. they actually said this april was the hottest ever..and april in which it was freezing everyday..makes no sence! There were more hot days in the 30's than there is today here even your friends at nasa-goddard admit there is global cooling:
http://www.nasa.gov/feature/goddard/nasa-study-mass-gains-of-antarctic-ice-sheet-greater-than-losses
you can't say there is global warming when the ice is increasing! Ice is increasing in greenland.. and i been tallying the mini-ice age as it progresses..lets take a look..isn't it about time you briliant scientists admit that the greehouse effect has been greatly exagerated:
Partial List of extreme cold weather anomalies since 2014
2014 ALL US states below freezing RARE
* 92% ice cover on the great lakes US
* cold records broken in NZ
SNOW RECORDS BROKEN AND HEAVY SNOWS:
* 2014,15 heavy snow in Atlanta and Houston RARE
* 2015 Cappricotta Italy one day snow record
* 300 year snow record in Hokkaido, Japan
* 2015 snow fall record broke in Nova Scota
* Hallifax snow 18X higher than normal
* 2015 Boston 270 snow record broke
* Buffalo New York ALLTIME snow record
* Snow in Huntington Beach ca RARE
* 2015 great lake USA ice cover lasting until June, months longer than normal
* 2015 Heavy Snows in Syria & Libya + many other ME countries, very RARE especially so widespread
* Snow last 2 years in Vietnam RARE
* Snow in July in Hawaii at 10,000 feet RARE
* Snow in August in Calgary Canada RARE
* Snow in August in SOUTHERN China RARE
* 2015 August Snow is Montana, and Wyoming
* 2015 August cold records for Billings MT, Denver CO, Mitchell SD, Watertown SD, Shrevepost LA, Monroe LA, Texarkana AR, El Dorado AR, Tyler TX, Longview TX + many others, Broke.
* 2016 January snow for the first time in central Vietnam, heavy snow all over vietnam unbeleivable picts: http://english.vietnamnet.vn/fms/vietnam-in-photos/150560/in-pictures--snowfall-in-central-vietnam-for-the-first-time.html Okinawa-first snow ever. Hiroshima-55 inches of snow, Hong Kong records 3rd coldest day on record.
* 2016 March: cold records broke all over US and more snow in tropics, NY and Boston have coldest March in 100 years. Vietnam had 1 foot of snow 300km south of hanoi.. Heavy snow again in central mexico. New York's Whiteface Mountains reached an insanely cold minus-78.88C ; Taiwan and Kuwait receive first snow on record.
* CROP FAILURE wheat crop fail from intense lanina late colds: http://www.agweb.com/article/concerns-mount-over-freeze-damage-to-winter-wheat-crops-naa-associated-press/
* 2016 Pakistans meteorological dept. issues a report predicting global cooling as a result of solar activity. Pakistan is 2nd government so far to issue global cooling warning after Russia did earlier.
* 2016 March 22 wheat crop damage in US due to freeze. http://www.bloomberg.com/news/articles/2016-03-22/freeze-across-great-plains-has-farmers-watching-winter-wheat
* 2016 Russian wheat crop damaged by ice.
* 2016 April snow in PA,USA in april, media refers to phenomenon as 'snow-showers'. The forcast is then upgraded to 3-12" of snow blanketing PA & MW, and NE region. NY and other states record their coldest April day on record. Heavy snow in Colorado-between 15"-32" snow in April. Snow records for April broken in CO & WY.
* 2016 April 1st snow reported in the Carribian. Guadelupe snow in April described by Dominica News as "extrodinary weather phenomenon"
* 2016 April, less than 5% of wheat and oat crop planted as of mid-April; cold and wind preventing fieldwork http://www.agweb.com/article/cold-wind-hamper-fieldwork-in-north-dakota-naa-associated-press/
way more ice in 2015 than there was a few years ago..oh i know, it's just 'rebounding' yea rebounding from the solar minimum:
2112: LINK
2015: LINK
[RH] Shortened links that were breaking page formatting.
Sam @268 and @269 , you've gone to some trouble to list an impressive number of "cold events". But have you been genuinely skeptical enough to draw up a comparable list of "hot events" occurring during the same 2014-2016 timespan ?
Since sea-levels are rising, and rising at an accelerating rate . . . the obvious conclusion is that your "cold events" are very much smaller in effect than the hot events.
Cherrypicking only what you want to look at, is a tempting occupation, but you should keep the overall picture in mind. And the overall picture is that the Earth is warming. In other words, the NASA and NOAA scientists are correct in their assessment of global warming. You have misunderstood the data and science.
Eclectic @270 No I didn't list 'warm events' because they seem to be in decline, for example off the top of my head from what I have seen on the tony hellar blog: There are less days over 90,95,and 100*F now than there were in the 30s and in the 60's.. the 1930's were very hot..117F in melbourne australia at 8am, 1 year in the 30's (i forgot which one) 45 days over 100*F in Indiana.. so 'hot events' are days that are over 100F, there are less of those now than there were in the past using US HCN weather stations.. and this purported 'sea level rise' is measured in milimeters; I feel that such a thing is easily fudged.. how much could it possibly be if even nasa.goddard is forced to admit (in that link i copied) that ice in antarctica is increasing over time, and you can see from those 2 photos of greenland, also from nasa, those photos there is clearly much more ice in 2015, than there was a few years ago..just another 'rebound'? I think the real culprit are the solar minimums that seed clouds, increase volcanic activity. bend the jet-stream, and radiate less heat toward earth.. that's alot for the greenhouse effect to overcome.. so as of right now, we got more ice and less hot days, intense winters with superblizzartds and winters that drag on..you can only imagine what its going to be like in 2019-24 when the current solar cycle finally reaches it's minimum
[RH] This is running very thin here with cherry picked materials. I'd highly suggest you spend some time looking at actual scientific research over climate denier blogs.
Please note that posting comments here at SkS is a privilege, not a right. This privilege can be rescinded if the posting individual treats adherence to the Comments Policy as optional, rather than the mandatory condition of participating in this online forum.
Please take the time to review the policy and ensure future comments are in full compliance with it. Thanks for your understanding and compliance in this matter.
Sam, I am happy to give you a detailed reply to your latest posting, which has been "half struck out".
In collecting anecdotal evidence and a scattering of selected events, it is all too easy for the human brain to be influenced by unintended bias and subconscious prejudices. That is why a careful and thorough scientific evaluation is the only way we can come to realistic conclusions on a complex and worldwide phenomenon such as climate measured over time.
The most straightforward approach here, is to look for an aggregator which compiles all the net effect of the cold & hot events you are interested in. Such an aggregator is the "global mean sea level" over time. ( You can find recent graphs of Global MSL via the University of Colorado website. )
3 or 4 mm per year may not seem very much when you are standing on the beach on a particular day - but think about what it means over the oceans of the whole planet. Each 1 mm of rise represents the melting of approx. 360 Giga-tons of ice, coming from the ice-sheets of Antarctica, Greenland, and so on (and even from the sadly-depleted Glacier National Park ! ).
360 cubic Km of ice is a colossal amount - try a mental picture of 360 blocks of ice measuring each 3,300 feet tall and wide and long. And don't forget that part of each year's rise in MSL on top of that , is caused by thermal expansion of water in the oceans (thermal expansion because the oceans have been warming up more every year).
Allowing for some minor fluctuations from retention/release of surface water on land (and similar changes in ground-water) , we find that MSL shows a strong upward trend during the 20th Century - as measured by tidal gauges and in recent decades, by the more accurate satellite measurements. And the rising sea level rate has been even stronger during the past 20 years. Look at the Global MSL, and you will see an even more impressive rise during 2015.
These findings all point in one direction - and they are entirely inconsistent with the idea of a preponderance of cold events and more build-up of snow & ice-sheets.
It may seem cold where you are : but the planet itself is telling us a different story. The totality of evidence shows that the Earth is continuing to warm up. Nor can the scientists find any reason for it not to continue warming - and that's because there's more solar radiation entering Earth than radiation leaving Earth (the planet hasn't yet reached equilibrium from the effects of current Greenhouse Gasses - and worse, the GHG's are continuing to rise: e.g. CO2 is now above 400 ppm, and climbing) .
Overall, it is clear that AGW hasn't paused or reversed.
sam @268,
If you wish to set out an argument that "you can't say there is global warming when the ice is increasing," it would be advisable not to link to a NASA press release which demonstrates that you actually can say it -
Of course, some may question the authority of Jay Zwally to make such a statement, but he is the lead author of the work in question and was also clever enough to predict even before its publication that silly denialists will distort his work for their own ends.
Someone believing what they read on Tony "CO2 could fall as snow in Antarctica" Heller's blog has their critical faculties turned off completely.
well ok i appreciate you replies.. I also appreciate that there can be this cherry-picking on both sides of an argument and in different ways, when something 'appears' to show something basic, like Ice-accumulation on antarctica, it can be 'viewed' in a different light. But things like snow in the tropics, first time ever snow in tropical area's-it is what it is.. and what snow in the tropics is-is typical 'mini-ice age' conditions. Do an image search 'gtemps' and you will see a diagram that shows the 'roman warm period' etc. You can see that the roman empire existed during a warm period between 400AD & 500AD the solar minimums came along with their volcanic activity and there was the natural shift to a cold period..It was also about that time that their civilization collapsed. In fact every chinese dynasty collapsed during solar minimums, these things come, agricultural production suffers-next thing you know, famine- death, the emperor's head is on a platter.
After the 70s,early 80's ice age scare-where scientists like George Kukla and Leona Woods Libby mapped out the natural cycles, and then onto the global warming greenhouse gas movement.. what facinates me about the global warming movement is on the one hand they claim to fear the environmental destruction that (man-made) global warming can create, but in talking to the followers of this movement, they also claim that this man-made warming will 'protect' us from mini-ice ages-which have repeatedly ravaged civilizations throught the previous 10,000 year inter-glacial. There can be this sort of 'mitigation' of a MIA. So far the weather patterns are showing this is not the case-notice the cold related crop failures have already started. no one can deny from a historical standpoint: global warming=good times, global cooling=bad times (despite all the wars and conquest that these good times go along with). I believe that history will later see the GW movement as a 'collective psycosis'. It starts with a realistic fear-fear of ice ages; from this fear a group creates a defense mechanism, a 'wrong' ideology that they think will save them, they then collectivly re-inforce it, when one doubts, the others set him strait, when others tell them that their logic is flawed-they insist that these people are evil; in this case a derogotory word is used; "deniers" Deniers are people who secretly work for fossil fuel energy polluters and all they care about is corporate profits-that's their motive so everything they say is evil. But all that aside, this thing (MIA) is coming, it can't be stopped, it can't be mitigated, and there is no escape. Perhaps it could have been mitigated if these western countries had put their resources into protecting their agricultural sectors instead of middle eastern wars; but with 2019 only a few years away, i guess it's too late.
[RH] You're becoming completely nonsensical and that's far from the intent on this website. If you wish to continue posting here you're going to have to come up with substantive scientific research to support your position. Continued speculation and supposition will not suffice.
Please note that posting comments here at SkS is a privilege, not a right. This privilege can and will be rescinded if the posting individual continues to treat adherence to the Comments Policy as optional, rather than the mandatory condition of participating in this online forum.
Moderating this site is a tiresome chore, particularly when commentators repeatedly submit offensive or off-topic posts. We really appreciate people's cooperation in abiding by the Comments Policy, which is largely responsible for the quality of this site.
Finally, please understand that moderation policies are not open for discussion. If you find yourself incapable of abiding by these common set of rules that everyone else observes, then a change of venues is in the offing.
Please take the time to review the policy and ensure future comments are in full compliance with it. Thanks for your understanding and compliance in this matter.