


 Arguments


Global cooling - Is global warming still happening?
What the science says...
| Select a level... |
 Basic
Basic
|
 Intermediate
| |||
|
All the indicators show that global warming is still happening. |
|||||
Climate Myth...
It's cooling
"In fact global warming has stopped and a cooling is beginning. No climate model has predicted a cooling of the Earth – quite the contrary. And this means that the projections of future climate are unreliable." (source: Henrik Svensmark)
At a glance
Earth's surface, oceans and atmosphere are all warming due to our greenhouse gas emissions, but at different rates. Some places are also warming much faster than others: parts of the Arctic for example. That variability is partly because other phenomena act to offset or enhance warming at times. A good example are the effects of La Nina and El Nino, an irregular variation in winds and sea surface temperatures over the tropical eastern Pacific Ocean that can influence temperatures and rainfall patterns right around the world.
El Nino causes even warmer years whereas La Nina tends to peg temperatures back to an extent. Thus 2023 – an El Nino year - was the warmest year on record, according to the USA-based National Oceanic and Atmospheric Administration, but other recent years have not been far behind – 2016 and 2019 are in second and third place respectively. The worrying thing is that 2019 only saw a mild El Nino. And even with a La Nina featuring, 2021 and 2022 were, respectively, still the seventh and sixth hottest years on record.
The year 1998 featured a massive El Nino and consequent temperature spike that was a strong outlier, well above the steady upward trend. That spike and the subsequent return to a more “normal” warming pattern led to claims in the popular media that global warming had “paused” or had even stopped. This was a typical misinformation tactic that, as usual, time has proved wrong. As things currently stand, the top ten warmest years have all been since 2010 and 1998 is nowhere to be seen any more. By modern standards, it simply wasn't warm enough.
Please use this form to provide feedback about this new "At a glance" section. Read a more technical version below or dig deeper via the tabs above!
Further details
In the years following 1998, at the time the hottest year on record, there was a concerted misinformation campaign to convince the public that global warming had variously slowed down, stopped or even that we were entering a period of cooling. Of course, we now know that such claims were nowhere near correct. In today's top ten ranking of warmest years, the year 1998 is nowhere to be seen. It simply wasn't warm enough. So let's take a look at how the claims came about, because they reveal insights into the methodology of those who design and spread misinformation.
The entire planet continues to accumulate heat due to the energy imbalance created through our greenhouse gas emissions. Earth's atmosphere is warming. Oceans are accumulating energy. Land absorbs energy and ice absorbs heat to melt. Year to year ups and downs in these things are simply noise, reflecting variations in how that heat is moved around the planet and what other influences are at work, such as the irregular El Nino Southern Oscillation (ENSO) that can nudge the global temperature one way or another by up to 0.3C. That's why 1998 was such a warm outlier: it coincided with a very strong El Nino. El Nino conditions always warm things up whereas La Nina conditions cool things down (figure 1).
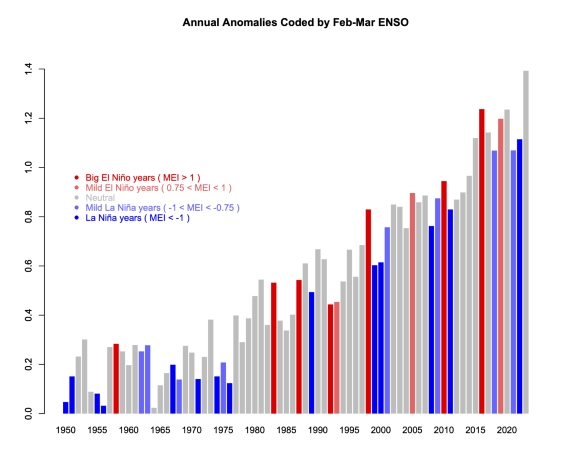
Figure 1: GISTEMP anomalies to end-2023 (with respect to late 19th Century), coded for ENSO state in the early spring - red is El Nino, blue La Nina. 2023 is in grey because that El Nino did not develop until later in the year. Graphic courtesy of Realclimate.
Climatologists routinely use multi-decadal blocks of time when presenting temperature trends for a very good reason. Such blocks allow you to stand back and look at the bigger picture. Due to the noise, taking a much shorter time-span – say just five or ten years – allows you to say anything you like about trends, depending on the particular block you pick.
For example, if you picked a short run of 5-10 years ending in 1998, you could have – if you were so inclined – said, “look how fast it's warming!” Likewise, taking a number of years starting with 1998, you could have made the equally invalid claim that global warming had stopped. And of course, that claim was made, vociferously, in the early-mid 2000s. It was a classic example of cherry-picking: the manifestly unscientific practice of choosing the data that supports the argument one is paid to make on behalf of those who sponsor misinformation campaigns. Once you know about such tricks, you can challenge them yourself. You can ask someone why they showed such a short temperature record when showing a much longer one is the normal practice.
It is difficult but technically possible to filter out the noise described above from temperature datasets. In the paper Foster and Rahmstorf (2011) the authors used the statistical technique of multiple linear regression to filter out the effects of ENSO, solar and volcanic activity (Figure 2). They found that the underlying global surface and lower atmosphere warming trends have in fact remained steady in recent years. There's still noise in there but nowhere near as much. We were still warming all along.
Figure 2: Five datasets of global surface temperature and lower troposphere temperature are shown before and after removing the short-term effects of the El Niño Southern Oscillation (ENSO), solar variability, and volcanic aerosols. A 12-month running average was applied to each dataset.
Last updated on 4 June 2024 by John Mason. View Archives


More inconvenient facts for Sam to digest...
As the world warms, the weather is changing in ways far more dramatic than a little extra heat there, a little less rain there.
Entire weather patterns are shifting, and we're already seeing the results in Australia this autumn.
First up, some dramatic statistics to illustrate the unprecedented Australian temperature anomalies being experienced in Australia this month. Then we'll hear from an expert on why it's happening.
Sydney And Melbourne Copping Record May Heat. The Reason Why Is Scary by Anthony Sharwood, Huffington Post Australia, May 17, 2016
John Hartz @301, the article was written on May 17th, and therefore was grotesquely exagerrating when it says, "Sydney is almost FIVE DEGREES ABOVE AVERAGE for a whole month". That may yet be the case, although that is unlikely.
[DB] A note to all participants: 'sam' has recused himself from further participation here, finding the burden of complying with this venue's Comments Policy too onerous.
Concerning Vietnam's mid-winter snows @298, I did think to have a quick look into GHCN data to check out the most recent winter temperatures. Cao Bang was the station I hit upon, in the hills north of Hanoi at 800ft altitude. The NOAA data (spoilt a bit by an evident data entry error for Jan 2016) shows January 2016 was colder than recent years for its Mean Min Temp (colder than 2011 but not as cold as 1963). The data does show Januarys have been getting colder over the last few years (still not as cold as the 1960s) but the winters have also been getting shorter with Novembers & Marchs getting warmer.
The NOAA data also gives Lowest Min Temp for each month, so we can see at 800ft we come very close to the snow line in January with lowest temperatures dropping below 40ºF in half the Januarys (dropping to 32.7ºF in 2014, & below freezing in 1995). Mid-winter snowfall higher up in the mountains of Vietnam thus should be quite normal.
Where do I find your video experiment with the black color solution that was added to water in a glass container to show the amount of CO2?
plato525 @304, here is the video I think you have in mind:
I am not sure as to whether there is or not a SkS blog post discussing this video.
Here is an example of an argument I see over and over between climate researchers and climate skeptics: https://www.quora.com/What-stage-of-which-Milankovitch-cycle-are-we-in-and-does-this-have-any-bearing-on-current-climate-change. (Sorry, I haven't mastered how to paste the graphics into my comment). It relates to whether the current global average temperature is higher than the medieval maximum. The dueling groups each seem to have their own set of facts. Can someone clear this up for me? Thanks.
[TD] In those Quora responses, David was correct. The GISP2 graph that Allen posted ends in 1855, which is why the spike at the right is absent. Just as problematic is the fact that GISP2 is from a single location and therefore not well representative of the entire world. GISP2 is explained in a three part series here. In the Search field at the top left, enter “Crux of a Core” to find them.
Richieb1234: Regarding the Medieval Warm Period, see this post. For a more recent and better temperature reconstruction see here.
richieb1234 @306,
The GISP2 ice core temperature record is Greenland temperature not global temperature. High Northern latitudes will have cooled more than global averages since the Holocene Climate Optimum (5,000 years ago). As a result, a reconstructed Greenland temperature would show today's Greenland temperatures still below those of the Holocene Climate Optimum.
The GISP2 data is often recycled by denialists (the graph below is from your link) suggesting the final data point represents today when it is actually 95 years before 1950 = 1855. CarbonBrief have a recent factcheck of the GISP2 data's misuse by denialists, along with a Greenland temperature reconstruction from multiple ice cores and brought up-to-date with modern instrument data, the today's temperatures being Berkeley Earth 20-year averages to 2013.
Your link also features the infamous IPCC FAR Fig 7.1c saying "it has become so 'inconvenient' they haven't mentioned it since & some scientists have tried to eliminate it." Again FAR Fig 7.1c has been much misused by denialists. Yet it was always a “schematic diagram of global temperature variations” with the “dotted line nominally represents conditions near the beginning of the twentieth century.” If anybody reads the text of IPCC FAR, it would also indicate plainly just how schematic Fig 7.1c was. Additionally, if Fig 7.1c were meant to be an accurate global temperature record, the 0.15 deg C temperature increase shown for 1900-50 would be a bit of a clue.
I have a question, if the Earth is hotter then ever before, then how come there are tree stumps underneath the Juneau icefield? For the tree stumps to be there, the icefield couldn't been there since trees don't grow in ice. And for the trees to grow there, the Juneau ice field must have formed after the trees grew, then left the trees stumps there after freezing the area. So back then it was hot enough, then the Earth cooled forming the Juneau ice fied. Meaning that this is NOT the hottest period in the Earth's history. Right?
[DB] The Earth is not in radiative balance with forcings and will continue to warm for some time yet until that balance is reached. Beyond that, warming is uneven. Further, current levels of the warming of the globe likely exceed those found both in the Holocene and in the previous interglacial, the Eemian.
Alaska glaciers have only been recently declining, reversing a 8,000 year period of growth and expansion:
Per McKay et al 2018 - The Onset and Rate of Holocene Neoglacial Cooling in the Arctic
"Arctic summer temperatures have decreased for the past 8,000 years, before rapidly warming over the past century. As temperatures cooled, glaciers that had melted began to regrow throughout the Arctic, a phenomenon and a time interval known as Neoglaciation.
This study seeks to understand the nature of this cooling and whether or not this indicates a tipping point in the climate system. Specifically, we use a large database of records from ice cores, lakes, ocean sediment, and more paleoclimate archives to detect patterns of cooling. We investigate these patterns, and climate model simulations, to determine what parts of the Arctic experienced Neoglaciation at the same time, how rapidly it cooled, and what climate models indicate about the causes of cooling.
We find that the Arctic did not cool simultaneously, but different regions cooled at different times and that the climate models perform well when simulating both the timing and amount of Arctic cooling."
Further, recent climate warming in the central Yukon region has surpassed the warmest temperatures experienced in the previous 13,600 years.
Porter et al 2019 - Recent summer warming in northwestern Canada exceeds the Holocene thermal maximum
Warming to match forcings takes time. Be patient.
[TD] See also this post. And then this one. And finally this one. Note that some of those posts have Basic, Intermediate, and Advanced tabbed panes.
Hi,
your comment indicates a lack of familiarity with paleoclimate data and what the science shows for the the more recent times. The moderator's suggestions are good places to start.
I would be wary of the claim "if the Earth is hotter then ever before ". Where did you find this claim? I think we can say with very strong certainty that the earth has been hotter before. Just going back to the Pliocene would be hotter but potentially other interglacials may have been warmer than now. (But note that it can take near a thousand years for earth to come into equilibrium with forcings - ocean mixing rate).
Reconstructions of past climate would suggest that it is likely we are warmer globally than any time in the holocene - the last 12000 years. It is less certain whether the Northern Hemisphere is warmer than past times in the holocene (esp NH Holocene climatic optimum).
The real concern about climate change is not what the temperature is, but how fast it is changing compared to any other time in the past. Rapid change creates adaptation stress for both the natural world and our manmade infrastructure like cities and agricultural systems.
I would also add that glaciers take time to come into equilibrium. Our longest glacier, the Tasman is in rapid retreat. However, even if warming stopped now (temperatures stayed about same), you can see that many more kilometers of the glaciar are basically deadmeat. The lake will continue extending up the valley but it will take a decade or so for that to happen.
I would be grateful for any information on a site called www.temperature.global.org which supposedly shows consistent cooling. Is their methodology flawed? Any thing I can use to counter what they publish would be appreciated.
Rtc1956 @313,
thank you for the reference to website "temperature.global"
. . . where a very strange global temperature chart is shown !
Whatever data processing/ manipulating/ cherry-picking they've done, they have somehow produced a chart which is divorced from reality.
Have a look at 2016 figures ~ global temperature (presumably some sort of average) is shown as varying by over 3 degreesC in the course of that year !!! How on earth that could happen, requires a Harry Potter explanation.
They claim they are using "unadjusted" METARS (weather stations at airports) collated by NOAA/NCDC . . . which would be very heavily weighted to Northern Hemisphere landmasses of course. Which would not represent an honest global picture. Yet they also claim to use buoy data (presumably oceanic) which might add some sort of Southern Hemisphere weighting . . . but that sounds funny too, in view of the colossal 3 degree fluctuation in 2016. None of it seems to make sense.
Rtc1950, it is IMO just someone playing silly burgers with selected data.
There are two other commonsense filters that can be applied :-
(A) If world temperature has been cooling (and recent years being persistently cool, according to that website's temp chart) . . . then we would be seeing an increase in world ice, and a lowering of global sea level. Which ain't in evidence.
(B) There would be massive headlines & news reports around the world . . . cheering millions celebrating in the streets . . . and Miss Greta Thunberg would be promptly demoted from her (just announced) front cover of Times Magazine as "Person of the Year for 2019" ;-)
Recommended supplermental rearding:
Claims of a coming 30-year “mini ice age” are not supported by science, Edited by Scott Johnson, Climate Feedback, Feb 6, 2020
if you want to measure trends in temperature there is no reason to weigh land temperatures differently from sea surface temperatures. There was also no reason for you to exclude a third of the Earth's surface from your "logical and mathematical approach". There was also no reason to exclude 21% of the data in time. Including the data from 1871 to 1899 shows that the pattern you claim only have detected in a single cycle does not mean the same go for other periods.
Global warming is definitely still happening, and there are many factors that show this. Saying that the earth is “cooling” does not make any sense, due to the many indicators that it is such as snow covers, ice melts, and the temperatures over the land and ocean. I really like the quote: The question of global warming stopping is often raised in the light of a recent weather event...For climate change, it is the long term trends that are important; measured over decades or more, and those long term trends show that the globe is still, unfortunately, warming.” I think it sums up the entire argument well and makes it very simple for people who still may be confused to understand.
Welcome to Skeptical Science, Sun and anika.
One of the things that you will notice here is that no discussions are ever closed. But you do need to pay attention to when comments were made, as very old discussions may not be active.
Sun: you mention several items, but it is not clear if you are responding to the main article, or comments from others. It helps if you refer to the comment number, or the portion of the post you are responding to. In looking at global temperatures, "global" will assign a weighting to the land temperature record based on the global land area, while sea surface temperatures will be weighted according to ocean area. As for older data: global coverage is much less dense in the 1800s, so for some purposes the older data may be too unreliable to be able to say that it represents "global" conditions.
Anika: you raise an important point. Each individual characteristic (temperature, ice cover, vegetation, etc.) will have short-term variation that makes it harder to see the long-term trend - but when you see similar response in a wider variety of characteristics it becomes much less likely that any single one is "by chance". There is a "big picture" that is more than just the sum of the parts.
The Earth is not in radiative balance with forcings and will continue to warm for some time yet until that balance is reached. Even the warming is uneven. Further, current levels of the warming of the globe likely exceed those found both in the Holocene and in the previous interglacial.
I've been browsing through this website and find it all very interesting. However there are some fundamentals that concern me. At the top of each page there are two sections titled "What the science says" and "Climate myth". Is this really how science and discovery is supposed to work? That opposing opinions are divided into "fact" and "myth"? Hasn't it been so that throughout recorded history that individuals have stood alone against 99% opposing consensus, even to the point of enduring persecution and cancellation? In fact haven't many of the greatest discoveries of all time been railed at by the majority? The fact is that there is always the possibility of a factor hidden from the multitude that's staring one lone individual right in the face. Isn't your "Climate myth" section a modern day equivalent of the medieval pillory with the data you have on hand the equivalent of fruit for the throwing?
I was very interested to note in the comments back in 2010 where a contributor calling himself Dr Tom stated unequivocally that Atlantic Bluefin Tuna would be extinct by 2012 and humans possibly as early as 2020. 12 years on and Atlantic Bluefin Tuna now have a conservation status of least concern. As to humans, I can't see too much evidence of extinction at the moment. Moral of the story is, don't fall for climate alarmism/extremism or characterise sceptics as misinformation peddlers. That's medieval and we really don't know what's around the next corner or what new discoveries may blow all conventional wisdom to kingdom come.
Rationalise @320,
My personal beliefs (open to improvement) include:
That is what science pursues - improved understanding of what is actually going on. Science can be especially helpful when it exposes new areas of improved understanding, like discovering harmful consequences of popular and profitable pursuits of personal benefit that had not been investigated or were attempted to be hidden or be doubted by people benefiting from harm done.
Based on those beliefs (understandings), I am pretty sure that the inconsistencies of each Climate Myth vs. the available evidence and a more consistent, but open to improvement (common sense), understanding has been presented. Of course, new evidence (not different opinions) could change the developed, open-to-improvement understanding.
Rationalise @ 320.
Welcome to Skeptical Science. Glad to hear that you are looking through the material available here - there is much useful information available.
This web site has a specific goal: to take many of the myths that exist in the understanding of climate science and show what the science actually says. These are labelled myths because there is strong evidence that they are incorrect. They are not dismissed because they are speculative, or because their "conclusions" are disliked - they are dismissed because of the evidence, which is the way science works.
One of the other things you will find here is information on the rhetorical and logical tactics and fallacies that are often used in promoting these myths. For example, the argument that you appear to be making - that science advances through ideas that run contrary to established thinking - is known as the Galileo gambit. Not all "contrary thinking" is a Galileo gambit, but it is one false argument that has been commonly used in the climate science "debates". We even have a page devoted specifically to it here at Skeptical Science:
https://skepticalscience.com/climate-skeptics-are-like-galileo.htm
Also note that here at Skeptical Science, there is a strong desire to keep comments on topic. Please review the Comments Policy, where this is one of the key points. (There is also a link to the policy above the box you use to enter comments.) If you wish to pursue your line of thinking, the above Galileo post is a better place than here, where the myth being debunked is that the globe is cooling.
Also note that each myth debunking usually has Beginner, Intermediate, and (sometimes) Advanced tabs that can be read for more and more detail.
Rationalise - "Dr Tom" is just another anonymous person on the internet. It would correct to be very skeptical about such pronouncements. It is another story however when looking peer-reviewed scientific papers and another again when looking at a strong scientific consensus. The IPCC reports try to capture that consensus in their reports. If you want to see what that consensus is on impacts, then look at WG2. It is sobering enough.
Please note: the basic version of this rebuttal has been updated on <date> and now includes an "at a glance“ section at the top. To learn more about these updates and how you can help with evaluating their effectiveness, please check out the accompanying blog post @ https://sks.to/at-a-glance
Thanks - the Skeptical Science Team.
I kind of feel like the global temperature escalator should be featured on rebuttals for every debunked argument against the increasing temperature trend.