


 Arguments


Is the CO2 effect saturated?
What the science says...
| Select a level... |
 Basic
Basic
|
 Intermediate
|
 Advanced
| ||||
|
The notion that the CO2 effect is 'saturated' is based on a misunderstanding of how the greenhouse effect works. |
|||||||
Climate Myth...
CO2 effect is saturated
"Each unit of CO2 you put into the atmosphere has less and less of a warming impact. Once the atmosphere reaches a saturation point, additional input of CO2 will not really have any major impact. It's like putting insulation in your attic. They give a recommended amount and after that you can stack the insulation up to the roof and it's going to have no impact." (Marc Morano, as quoted by Steve Eliot)
At-a-Glance
This myth relies on the use (or in fact misuse) of a particular word – 'saturated'. When someone comes in from a prolonged downpour, they may well exclaim that they are saturated. They cannot imagine being any wetter. That's casual usage, though.
In science, 'saturated' is a strictly-defined term. For example, in a saturated salt solution, no more salt will dissolve, period. But what's that got to do with heat transfer in Earth's atmosphere? Let's take a look.
Heat-trapping by CO2 in the atmosphere happens because it has the ability to absorb and pass on infra-red radiation – it is a 'greenhouse gas'. Infra-red is just one part of the electromagnetic spectrum, divided by physicists into a series of bands. From the low-frequency end of the spectrum upwards, the bands are as follows: radio waves, microwaves, infrared, visible light, ultraviolet, X-rays, and gamma rays. Gamma rays thus have a very high-frequency. They are the highest-energy form of radiation.
As our understanding of the electromagnetic spectrum developed, it was realised that the radiation consists of particles called 'photons', travelling in waves. The term was coined in 1926 by the celebrated physicist Gilbert Lewis (1875-1946). A photon's energy is related to its wavelength. The shorter the wavelength, the higher the energy, so that the very high-energy gamma-rays have the shortest wavelength of the lot.
Sunshine consists mostly of ultraviolet, visible light and infra-red photons. Objects warmed by the sun then re-emit energy photons at infra-red wavelengths. Like other greenhouse gases, CO2 has the ability to absorb infra-red photons. But CO2 is unlike a mop, which has to be wrung out regularly in order for it to continue working. CO2 molecules do not get filled up with infra-red photons. Not only do they emit their own infra-red photons, but also they are constantly colliding with neighbouring molecules in the air. The constant collisions are important. Every time they happen, energy is shared out between the colliding molecules.
Through those emissions and collisions, CO2 molecules constantly warm their surroundings. This goes on all the time and at all levels in the atmosphere. You cannot say, “CO2 is saturated because the surface-emitted IR is rapidly absorbed”, because you need to take into account the whole atmosphere and its constant, ongoing energy-exchange processes. That means taking into account all absorption, all re-emission, all collisions, all heating and cooling and all eventual loss to space, at all levels.
If the amount of radiation lost to space is equal to the amount coming in from the Sun, Earth is said to be in energy balance. But if the strength of the greenhouse effect is increased, the amount of energy escaping falls behind the amount that is incoming. Earth is then said to be in an energy imbalance and the climate heats up. Double the CO2 concentration and you get a few degrees of warming: double it again and you get a few more and on and on it goes. There is no room for complacency here. By the time just one doubling has occurred, the planet would already be unrecognisable. The insulation analogy in the myth is misleading because it over-simplifies what happens in the atmosphere.
Please use this form to provide feedback about this new "At a glance" section. Read a more technical version below or dig deeper via the tabs above!
Further details
This myth relies on the use of a word – saturated. When we think of saturated in everyday use, the term 'soggy' comes to mind. This is a good example of a word that has one meaning in common parlance but another very specific one when thinking about atmospheric physics. Other such words come to mind too. Absorb and emit are two good examples relevant to this topic and we’ll discuss how they relate to atmospheric processes below.
First things first. The effect of CO2 in the atmosphere is due to its influence on the transport of 'electromagnetic radiation' (EMR). EMR is energy that is moving as x-rays, ultraviolet (UV) light, visible light, infrared (IR) radiation and so on (fig. 1). Radiation is unusual in the sense that it contains energy but it is also always moving, at the speed of light, so it is also a form of transport. Radiation is also unusual in that it has properties of particles but also travels with the properties of waves, so we talk about its wavelength.
The particles making up radiation are known as photons. Each photon contains a specific amount of energy, and that is related to its wavelength. High energy photons have short wavelengths, and low energy photons have longer wavelengths. In climate, we are interested in two main radiation categories - firstly the visible light plus UV and minor IR that together make up sunshine, and secondly the IR from the earth-atmosphere system.
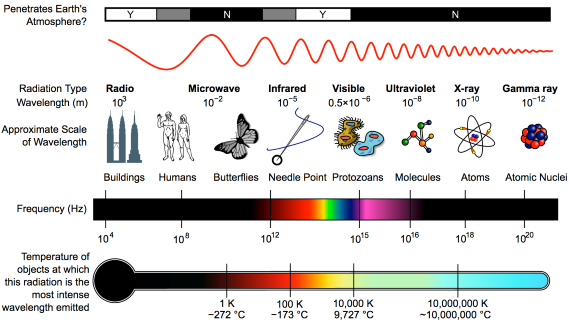
Fig. 1: diagram showing the full electromagnetic spectrum and its properties of the different bands. Image: CC BY-SA 3.0 from Wikimedia.
CO2 has the ability to absorb IR photons – it is a 'greenhouse gas'.So what does “absorb” mean, when talking about radiation? We are all familiar with using a sponge to mop up a water spill. The sponge will only absorb so much and will not absorb any more unless it's wrung out. In everyday language it may be described, without measurements, as 'saturated'. In this household example, 'absorb' basically means 'soak up' and 'saturated' simply means 'full to capacity'. Scientific terms are, in contrast, strictly defined.
Now let's look at the atmosphere. The greenhouse effect works like this: energy arrives from the sun in the form of visible light and ultraviolet radiation. A proportion reaches and warms Earth's surface. Earth then emits the energy in the form of photons of IR radiation.
Greenhouse gases in the atmosphere, such as CO2 molecules, absorb some of this IR radiation, then re-emit it in all directions - including back to Earth's surface. The CO2 molecule does not fill up with IR photons, running out of space for any more. Instead, the CO2 molecule absorbs the energy from the IR photon and the photon ceases to be. The CO2 molecule now contains more energy, but that is transient since the molecule emits its own IR photons. Not only that: it's constantly colliding with other molecules such as N2 and O2 in the surrounding air. In those collisions, that excess energy is shared with them. This energy-sharing causes the nearby air to heat up (fig. 2).
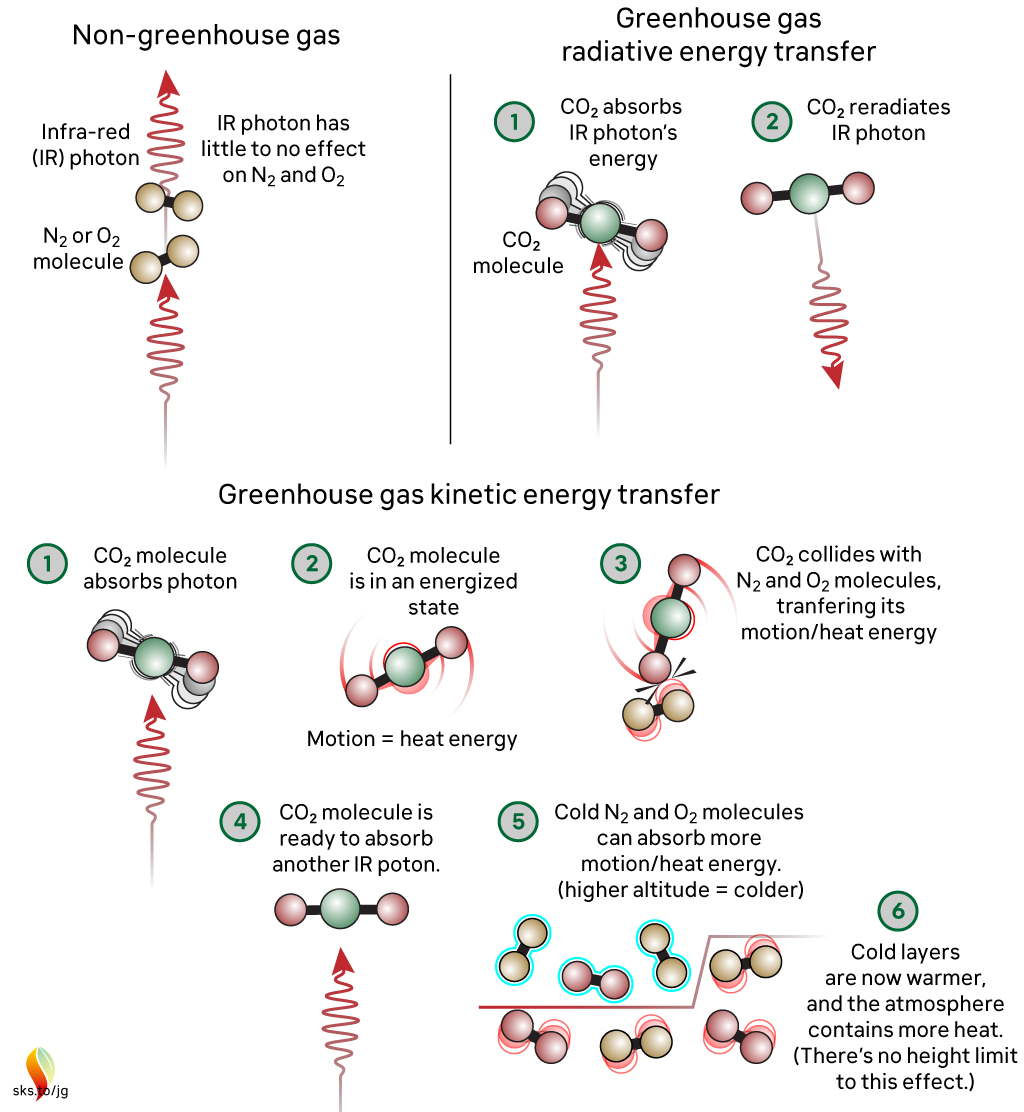
Fig. 2: The greenhouse effect in action, showing the interactions between molecules. The interactions happen at all levels of the atmosphere and are constantly ongoing. Graphic: jg.
The capacity for CO2 to absorb photons is almost limitless. The CO2 molecule can also receive energy from collisions with other molecules, and it can lose energy by emitting IR radiation. When a photon is emitted, we’re not bringing a photon out of storage - we are bringing energy out of storage and turning it into a photon, travelling away at the speed of light. So CO2 is constantly absorbing IR radiation, constantly emitting IR radiation and constantly sharing energy with the surrounding air molecules. To understand the role of CO2, we need to consider all these forms of energy storage and transport.
So, where does 'saturation' get used in climate change contrarianism? The most common way they try to frame things is to claim that IR emitted from the surface, in the wavelengths where CO2 absorbs, is all absorbed fairly close to the surface. Therefore, the story continues, adding more CO2 can’t make any more difference. This is inaccurate through omission, because either innocently or deliberately, it ignores the rest of the picture, where energy is constantly being exchanged with other molecules by collisions and CO2 is constantly emitting IR radiation. This means that there is always IR radiation being emitted upwards by CO2 at all levels in the atmosphere. It might not have originated from the surface, but IR radiation is still present in the wavelengths that CO2 absorbs and emits. When emitted in the upper atmosphere, it can and will be lost to space.
When you include all the energy transfers related to the CO2 absorption of IR radiation – the transfer to other molecules, the emission, and both the upward and downward energy fluxes at all altitudes - then we find that adding CO2 to our current atmosphere acts to inhibit the transfer of radiative energy throughout that atmosphere and, ultimately, into space. This will lead to additional warming until the amount of energy being lost to space matches what is being received. This is precisely what is happening.
The myth reproduced at the top – incorrectly stating an analogy with roof insulation in that each unit has less of an effect - is misleading. Doubling CO2 from 280 ppm to 560 ppm will cause a few degrees of warming. Doubling again (560 to 1130 ppm) will cause a similar amount of additional warming, and so on. Many doublings later there may be a point where adding more CO2 has little effect, but recent work has cast serious doubt on that (He et al. 2023). But we are a long, long way from reaching that point and in any case we do not want to go anywhere near it! One doubling will be serious enough.
Finally, directly observing the specific, global radiative forcing caused by well-mixed greenhouse gases has - to date - proven elusive. This is because of irregular, uncalibrated or limited areal measurements. But very recently, results have been published regarding the deep reinterrogation of years of data (2003-2021) from the Atmospheric Infrared Sounder (AIRS) instrument on NASA's Aqua Satellite (Raghuraman et al. 2023). The work may well have finally cracked the long-standing issue of how to make finely detailed, consistent wavelength-specific measurements of outgoing long-wave radiation from Earth into space. As such, it has opened the way to direct monitoring of the radiative impact (i.e. forcing + feedback) of greenhouse gas concentration changes, thereby complimenting the Keeling Curve - the longstanding dataset of measured CO2 concentrations, down at the planet's surface.
Note: Several people in addition to John Mason were involved with updating this basic level rebuttal, namely Bob Loblaw, Ken Rice and John Garrett (jg).
Last updated on 31 December 2023 by John Mason. View Archives


MThompson @275, that mental picture is largely correct. What is missing at this point is that the probability of a CO2 molecule absorbing a photon falls of towards the wings of the absorption band so that near those wings, the distance before nearly all light is absorbed is 100s of meters, or at the very fringes, thousands.
More important, however, is the next step, which is described here (which, if you have not already covered that material, I recomend you read before going further).
Excuse me, I am but a poor and ignorant engineer. Also, as MThompson , above, I have not read all the pages.
so, with that, I venture the following question:
with ring down IR spectrophotometers with path lenghts of hundreds of meters, would not the premise that "saturation" in the heating of the atmosphere from increasing CO2 occurs..
also mean that the spectrophotometers might become useless at a % CO2 level which intercepts all their source laser IR energy?
Which doesn't happen, up to 100% CO2.
Probably I'm missing something here, your elucidation is solicited.
davidwell, regarding comment 277"
If a ring-down optical path lengh was say 900 meters, then the pulse duration would be 3 microseconds. If the lifetime of the v2 CO2* state is much longer than that would some probe beam intensity survive even at 100% CO2? I ask this because I'm guessing that the excited state (v2 CO2*) does not absorb the probe beam. Anyway, I'm just a guy that likes science, and your question is interesting to me.
I am technically a laymen in the world of climate change, but I have a decent understanding of climate change principles. I am by no means near the level of understanding as all the people posting on here. But I have a quick question that I don't think would require much thought for most of you.
I was in a back and forth with someone on a comment board and he brought up the saturation argument. I then sent him the link to this article. He then said that this article contradicts the IPCC:
"CO2 has reached its reflective saturation limit, we accept that. However, rising CO2 levels cause a rise in relative atmospheric humidity and water vapor is amount the most powerful global warming forces. So CO2 causes higher humidity and that causes global warming. This is the OFFICIAL IPCC explanation that there is a supposed consensus on.
If you can’t see how your source contradicts the actual explanation the climate scientists give at IPCC and you can’t admit that you had no clue as to the actual explanation, we are done, I have no more time to waste on you."
I don't see what the contradiction is. Am I missing something? Thanks for any thoughts.
[JH] You are correct. There are no contradictions between the OP and the IPCC report. The role of water vapor is explained in the SkS rebutal article, Explaining how the water vapor greenhouse effect works.
Dan Smith @279, your respondent is thoroughly confused, having mistaken a response to temperature increases (the water vapour feedback) for the initial cause of temperature increase (the radiative forcing). The theory that CO2 is saturated, ie, that increases in CO2 in the atmosphere will cause not increase in radiative forcing does, however, contradict the IPCC:
In fact the IPCC gives the formula for radiative forcing due to a change in concentration of CO2 as being:
ΔF = 5.35 x ln(C/C0),
where ΔF is the change in radiative forcing, C is the atmospheric CO2 concentration in part per million by volume (ppmv, or ppm), and C0 is the CO2 concentration in the period to which you are comaring, and ln is the natural logarithm. The specify this in the supplementary material to chapter 8 (section 8.SM.3), as they have done in the two preceding reports.
Anybody who thinks CO2 is saturated does not understand the basics of the greenhouse effect. The change in CO2 concentration reduces IR radiation to space. Ignoring the stratosphere, any increase in CO2 concentration means the IR radiation to space must come from a higher level, and hence cooler level. Because the amount that a gas will radiate depends on its temperature, this means it will radiate less to space, and hence the total IR from the Earth to space will decrease. To restore radiative balance, some change in the atmosphere will need to occur. As changes in the atmosphere are driven by changes in temperature, and as increasing temperature increase radiation (and hence radiation to space), that will certainly require an increase in temperature. I have explained this in more detail here.
Dan Smith @279. Further to Tom Curtis's response I would add that the following statement is incorrect.
However, rising CO2 levels cause a rise in relative atmospheric humidity .... So CO2 causes higher humidity and that causes global warming.
There is no physical mechanism that allows CO2 to "suck" more water vapour into the atmosphere except its ability to warm the atmosphere itself. In other words, if the CO2 warming potential is saturated (which it is not) then water vapour concentrations in the atmosphere would not be able to rise.
This is the OFFICIAL IPCC explanation that there is a supposed consensus on.
This statement is simply incorrect. I would challenge your respondent to find this explanation in the IPCC reports, available here.
That clarifies things. Thank you all very much for your thorough explanations.
CO2 and similar assymetric species are necessary in order to radiate IR into space, for the same reason that they absorb IR.
IR frequencies are those of the bond-stretching modes and couple to the EM field via molecular dipoles (and molecular rotation to conserve angular momentum).
Suppose the upper atmosphere contained only N2 and O2. These molecules' bond motions cannot couple to the EM field [to 1st order] so cannot radiate IR. The heat would be trapped until the temperature rose enough to allow electron modes to radiate.
But there is CO2. And if the partial pressure of the CO2 is increased, that should provide more opportunities for the upper atmosphere to radiate, and so cool the upper atmosphere.
We already know that vertical heat transport in the lower atmosphere is dominated by convection [the IR "greenhouse effect is saturated there].
So doesn't that mean that extra CO2 in the upper atmosphere is an advantage to shedding IR into space?
I suspect that human changes to land use will turn out to be the dominant anthopogenic contribution to climate change.
rational being - I'm not entirely certain what your question is. CO2 at the top of the atmosphere radiates energy into space in the IR bands, with an effective emission altitude generally defined as where 50% or more of the emission escapes without absorption. That altitude is determined by the total amount of IR absorbing gases above that point in the atmosphere, and is rather directly related to the partial pressure of GHGs.
As CO2 levels increase, that effective emission altitude increases. Given the lapse rate, an increase in altitude means a decrease in temperature, hence a reduction in the IR energy radiated, an imbalance at the top of the atmosphere. That imbalance will persist as energy accumulates on the surface, warming the entire atmospheric column including the CO2 at the effective radiating altitude, until the energy radiated equals the energy incoming from the sun.
Summary: Increased GHGs -> increased radiating altitude thus colder radiating gases -> less energy leaves -> climate warms -> upper atmosphere warms as a result -> amount radiated equals amount received.
rational being @284, the Earth's surface emits IR radiation upward at approximately 390 W/m^2. Absent IR absorbing molecules in the atmosphere, that IR radiation would radiate to space, making the total IR radiation to space from the Earth 390 W/m^2.
As it happens, some of that IR radiation is trapped by IR absorptive molecules, which then radiate based on their temperature. On average, IR radiation from water vapour radiates from an altitude of (very approximately) 4 km. At that altitude, temperatures are on average 26 K cooler than at the surface due to the lapse rate, so the IR radiation to space from water vapour is at (very approximately) 267 W/m^2. On average IR radiates to space from 10 km altitude, and hence from a temperature of 213 K. Consequently its IR radiation is at (very approximately) 116 W/m^2.
Combined across all factors, including the IR radiation from cloud tops, the IR radiation from the surface through the atmospheric window, and the differences in altitudes in radiation at different latitudes (along with the differences in surface temperatures), the total IR radiation to space averages at 240 W/m^2. That is, it very closely matches the incoming solar radiation averaged across the Earth's surface. Absent the IR active gases, however, it would radiate at the much higher level of the Earth's surface. That, of course, would create an energy imbalance leading to the rapid cooling of the Earth's surface until outgoing IR radiation matched incoming solar radiation again, with the Earth's average surface temperature near 255 K.
Thank you Tom Curtis and KR for taking the time to reply.
Are we saying that increasing upper atmosphere CO2 raises the altitude of the tropopause? And is the warming argument, then, that the temperature of the tropopause is fixed by the needs of radiative balance, so that a higher tropopause implies a warmer surface?
The altitude of the tropopause varies over the globe from around 9km at the poles to almost double in the tropics. I suppose it is where convective heat transport gives way to radiation as the dominant mode. The details are complex enough that I am not sure simple averaging arguments work well.
rational being - That's correct, increased GHGs (not just CO2) raise the tropopause, the slope of the lapse rate remains constant, and the entire atmosphere and surface are warmer as a result of increased effective radiating altitude. There's a fair bit of literature on that (see Google Scholar here), for example Santer et al 2003 states:
rational being @286, the increased warmth of the atmosphere from the increased greenhouse effect does in fact raise the tropopause, but it does so by increased convection due to the surface warming. The change in radiative forcing would occur whether or not that happened. I have explained the actual method of warming in greater detail and clarity than I can in a comment here. I recommend you read it and comment further on that thread if you want to explore the issue in detail.
I agree that averageing across the Earth's surface creates a multitude of problems. They are not as large as often imagined, however, because at the effective altitude of radiation to space, temperatures are far more similar over a range of latitudes than they are at the surface (in part because of the higher tropopause in the tropics). However, the alternative to using globally averaged values is (more or less) to develop a full scale AOGCM, which is a bit much for blog comments. As it is, observations and AOGCM's show that globally averaged values give good back of the envelope estimates, though not accurate enough for detailed prediction (obviously).
I was attracted to this particular article because I think that the causality case can be made most convincingly from the properties of the Carbon Dioxide molecule itself... especially its absorption spectrum.
I have got into the practice of screen-recording things as I learn it, so that three to six months from now when I have the opportunity to pick up where I left off, I might remember some of what I was thinking.
LINK
Here is a short list of where I think I'm still confused.
•What is the meaning of "Brightness Temperature" Isn't brightness usually measured in Watts/meter^2?
•I didn't fully grasp how the "Pressure and Doppler Broadening" but that may have been for lack of time and effort...
• What I see, though, is that the absorption coefficient doesn't drop off instantaneously... I would think that any absorption coefficient below 1/(10 km) is going to be NOT saturated. I think maybe the problem involves a lot more detailed calculus though because in those 10 km to to the top of the troposphere, there are pretty massive changes in the density and pressure, wouldn't there?
•According to the graph at LINK (which I used in the video above) it appears that Carbon Dioxide absorbs about 2% or more of the light in a continuous spectrum from 1.5 micrometers to 30 micrometers.
Is that graph accurate? And if so, wouldn't you say that Carbon Dioxide does *not* saturate the spectrum in the wavelengths where it is absorbing 2% of the light?
Finally, have you thought about trying to put together some kind of quantifiable problem... Could you give a functional representation of the absorption coefficient of CO2, as a function of wavelength and concentration?
Then a representation of the power-distribution emitted by the surface of the earth, as a function of wavelength (Planck distribution, yes, I know)
Then a calculation of the heat capacity of the atmosphere at large, with 70% nitrogen, 29% oxygen, etc.
And maybe a description of whether heat flows at the boundaries of air and water, and between troposphere and stratosphere... What kind of models are used in predicting heat conduction between the layers. I guess convection between air and water is completely halted, since clearly the water doesn't flow into the air, and the air doesn't flow into the water... But what about conduction? Is the phase change just as dramatic between the troposphere and the stratosphere?
[RH] Hot linked urls.
Jonathan Doolin... Just want to get something clear first. You're going to throw your lot in with two computer science guys, who have no special training in any of the science that they're commenting on, over that of 30,000+ actively publishing climate researchers, and all the National Academies, and pretty much every scientific organization who has a statement on AGW.
Have I got that right?
Jonathan, you'll get a response here, but if you're actually interested in going through the maths, save some time by going to SoD.
Johnathan Doolin @289, to begin with, the graph you rely on from Jo Nova incorrectly shows the distribution of IR radiation from the Earth. To get a better idea of the distribution, here are three satellite observed spectra of outgoing IR radation:
Units of wavenumber may be unfamiliar to you. They are a measurement of frequency in terms of number of waves per cm. For ease of conversion, here is another satellite observed spectrum showing both wave numbers and wavelengths, this time from over Barrow in Alaska, and also showing a simultaneous downward spectrum at the Earth's surface:
These graphs are drawn such that an equal area under the grap corresponds to an equal total power (in W/m^2) emitted to space at the top of the atmosphere (or in one instance at the bottom of the atmosphere to the Earth's surface). The large feature at about 666 cm-1 wave number, or 15 micrometers wavelength is the CO2 absorption/emission band. As you can see, it is displaced in the Jo Nova graph to suggest CO2 absorbs very little outgoing radiation - but from the actual observations above, it is evident that that displacement is (to be far kinder than she deserves) an error.
As an aside, all five graphs also show the blackbody curves at different temperatues. The "brightness temperature" is just the absorption spectrum rescaled at different wavelengths such that the black body curves form parralel lines with the x-axis. It is convenient for some purposes but not for others.
The most important fact shown in the graphs above is that at atmospheric temperatures, CO2 both absorbs and emits IR radiation at the same wavelengths. This can be seen in the top three images in the tiny spike of increased radiation from the point of greatest absorptivity by CO2. Because CO2 absorbs so efficiently at that wavelength, it also emits efficiently. More importantly, at that precise wavelength, most IR radiation as seen from space looking down comes from the stratosphere, which is warmer than the nearby troposphere, resulting in a peak in net emissions.
The emissions can also be seen (very obviously) in the downward spectrum at Barrow, where the near surface air is much warmer than the near tropospheric air. As a result, the emissions seen from space (which can see no further down than the upper troposphere) are very low and much lower than the nearby wavelengths without CO2 absorption where we can see down to the lower 4 kms of the troposphere (H2O band = 400-800 cm-1) or the surface ("atmospheric window" = 800-1000 cm-1), which being warmer emit more intensively. Seen from the surface, however, all emissions in the CO2 and H2O bands come from the lowest kilometer of the atmosphere and are much warmer than that from the neighbouring atmospheric window (where they effectively come from space).
Turning to your fog model, it contains three essential errors. First, at IR wavelengths, CO2 both absorbs and emits radiation. That is an important disanalogy to your headlights in the fog, for fog will absorb visible light, but not emit it. Second, early in the you define "saturation" in terms of whether or not headlights can be seen in the fog. You say, "If you can't see the headlights in front of you at all, that means the light is completely blocked." But, if you cannot see the headlights at all, then headlights at a shorter distance may well not be blocked. Absorption is a function of distance. Third, the theory of the greenhouse effect is a theory of radiative balance relative to space. You apply your assumptions from the perspective of light leaving the ground, but the proper perspective for the greenhouse effect is that of light escaping to space.
So, consider a hypothetical case in which a gas that absorbs equally in all frequencies. That gas will also emit as a black body, and hence emit according to its temperature. Supose also that the gas is thick enough in the atmosphere as to block all light from the surface. It cannot, however, at Earth's temperatures block all IR radiation, for it emits some. The higher in the atmosphere it is, the higher in the atmosphere from which it will emit so that while it may block all sight of the surface, it can never block all IR emission. So the question becomes, what is the lowest from which you can see an IR beacon on a satellite when looking up? Because from that same altitude, IR radiation emitted by that gas can escape to space. Looking from space, you will see a (very tiny) amount of IR radiation from that altitude, and more from higher levels. If that level is above the surface, the atmosphere is saturated, but that in no way prevents IR radiation from reaching space. It only prevents it from reaching it from the surface.
Suppose, that we take an atmosphere containing that gas, which is just saturated. You can just see the IR beacon from a km above the Earth's surface and from no lower. Now we double the concentration of the gas. It follows that the lowest altitude from which we can see the beacon will rise. Ergo, the IR escaping to space will come from a higher altitude. But, because temperatures fall with greater altitude, it will have a correspondingly less powerfull emission based on the Stefan Boltzmann law. As less energy is escaping to space, the result will be a build up in energy stored in the system until radiative balance is restored, ie, the temperature of the levels of the atmosphere from which IR radiation emitted to space rise to match those of the lower levels from which they previously were emitted.
Further, and minor points:
1) Absorption is best specified by molar units. The reason is that the atmosphere becomes less dense as you rise, so that the number of moles in a vertical column that is a meter squared at the base decreases, (ie, absorption per meter decreases with altitude).
2) IR can only absorb or emit CO2 at very specific frequencies, based on the natural resonant frequency of the molecular bonds. That frequency of absorption is blurred by the motion of the particles. A CO2 molecule moving in the same direction of the light will see the light as being redshifted (longer wavelength) and will consequently be able to absorb light of a slightly shorter wavelength than would normally be the case. Likewise in reverse. The doppler effect broadens the effective bandwidth of IR light that can be absorbed.
Pressure broadening (and collisional) broadening also broadane the effective bandwidth, but the physics involved is above my pay scale.
3) You would probably find it instructive to play around with the Modtran model. (Instructions and source code) Modtran is a moderate resolution model of atmospheric transmission. The version in the public domain dates from the late 1980s to early 1990s, and is slightly inaccurate for exact calculation. It is, however, very informative about basic effects.
Science of Doom developed his own model along similar lines, describing the process and maths involved in his blog as he did so. Also very informative. There are two relevant series of blog posts.
Hello. I found the graphs from Barrow Alaska very helpful.
The graphs from Barrow make it seem that Carbon Dioxide operates like a blackbody in wavelengths near 15 micrometers (667/cm) and is transparent in (most) other wavelengths.
Looking up, in the 600/cm - 760/cm range, there is roughly 100 milliWatt's per (square meter • steradian • cm^-1). Looking down, there's only 50. There is a much higher photon count in that range looking up than there is looking down.
I did a little calculation using these numbers; based on the units of the vertical and horizontal parts of the Barrow Alaska graph... I could draw a little rectangle 100 high and 150/cm wide.
This rectangle would have an area of 15,000 milliWatt per (square meter • steradian). I would multiply by the area of the entire sky in steradians, which is about 6.25. which comes out to about 93.75 Watts per square meter.
----
The graph that I referenced was not directly from joannova, but was from comment #58 at http://joannenova.com.au/2010/02/4-carbon-dioxide-is-already-absorbing-almost-all-it-can/
which in turn comes from http://theresilientearth.com/?q=content/why-i-am-global-warming-skeptic
Except for the color, this seems identical to the graph here.
http://noconsensus.wordpress.com/2010/04/19/radiative-physics-yes-co2-does-create-warming/
What has been changed is that the infrared spectrum of Earth has been added.
Wein's Law says that lambda_peak * Temperature = .0029 meter • Kelvin
But what temperature should you use? 290 Kelvin yields a peak wavelength around 10 micrometers. When I did this earlier today, I thought the resilientEarth graph was too far to the left... (Using a temperature near 325 Kelvin, perhaps--like the Sahara.) However, the Sahara graph has a peak elsewhere, I think... Is Wein's Law an approximation that doesn't work at these temperatures?
======
I worked a good portion of the morning making another video, but unfortunately the screen-capture program crashed. These weren't the only things I addressed but seemed worth mentioning.
Jonathan Doolin @294:
1) The formula you used is for wavelength. That is, for a graph with a constant scale per unit wavelength, it shows the point with the highest value by wavelength. For 320 K, I work out that wavelength to be 9 micrometers, which is equivalent to a wavenumber of 1100 cm-1. For a graph with a constant scale for units of frequency, however, you should use νmax = 5.879 x 10¹⁰ x T, or 18.8*10^12 Hertz. Converted into wavenumbers, that is 627 cm-1.
The reason for the difference is that one unit wavenumber corresponds to more units of wavelength at 627 cm-1 than at 1100 cm-1. Therefore the area shown under the graph at 627 cm-1 must be divided among more units wavelength. To retain the same area, it must show a correspondingly lower intensity per unit.
The graph you originally linked to does actually show a long tail over the 15 micrometer peak absorption band for CO2, so that the upper curve may not be a mistake per se. The red band, however, is deliberately drawn to exclude that peak even though it lies in the emission band and is fundamentally important. Further, by using a wavelength scale, the CO2 band is placed on the wings where it is hard to judge its impact. That impact will in fact be the same no matter whether you use a frequency or wavelength scale, and as can be seen on the frequency scale (wave number) is very important.
In any event, I do not believe Wein's law to be an approximation, but of necessity it takes different forms for frequency and wavelength.
2) I have not repeated your calculation for the Barrow figure, but it sounds like it is in the correct ball park.
Looking at the downward from space figure, you can see that in the absence of CO2 (and ignoring water vapour and clouds), the radiation to space around 666 cm-1 would follow the black body curve for 268 K, that is over the absorption band for CO2 it would have the same intensity as the downward radiation at the surface (or actually very slightly more). Therefore, the presence of CO2 at that location has a warming effect of, using your calculation, around 45 W/m^2. In fact, water vapour would create some of that warming because it does overlap, but at a lower and warme altitude. Consequently its effect in the absence of CO2 would be less than that of CO2. Therefore the warming effect of CO2 at that location at that time was probably closer to 20 W/m^2, and is impossible to calculate without a full fledged radiation model.
It is often noted that water vapour has a greater greenhouse effect than CO2. That, however, is because it has a lesser effect across a far wider band of frequencies. In the frequency in which CO2 is active, CO2 has the stronger effect. (Of course, water vapour only has any effect because the atmosphere is warm enough to evaporate, and without the warming contribution of CO2 that would not be the case, or almost entirely not the case. Therefore CO2 drives temperatures more than water vapour, even though it has the weaker greenhouse effect.)
Tom,
Does it make a difference when the spectrum was measured over Barrow? I cannot do the calculation, but it strikes me that in the winter there would be a different amout of radiation lost to space than during the summer. In the tropics the radiation would be more constant, but might not give as clear a spectrum.
Evans & Puckrin 2006 might be helpful, Jonathan.
Jonathan Doolin - I think I see some of the issues here; the image you are referring to is, well, a bit misleading in presentation.
A more detailed graph shows not just the results of atmospheric absorption on incoming and outgoing radiation, in a more clear fashion shows what would be expected for an Earth without an atmosphere (at the same temperatures):
Here you can more clearly see the absorption ranges for water vapor and CO2 that result in the more detailed spectra Tom Curtis linked. And see clearly the range of IR reduced by the greenhouse effect.
Quite frankly, the rather cartoon representation in the graph you linked gives the (incorrect) impression that the colored band is the sum radiation, wholly unaffected by GHG absorption, when in reality that band region is a complex spectra of what's left after passing through an atmosphere containing those GHGs. I consider your graph less than useful as a result.
As noted here and elsewhere, absorption of IR is effectively saturated near the ground at sea-level pressures, with the average absorption path length being quite short (in the order of meters). The more telling altitude is, however, that of effective radiation (roughly where half the radiated IR escapes to space without reabsorption). And that altitude rises as GHG concentrations increase, to cooler altitudes (by the lapse rate) that will radiate less energy. IR escapes across the thermal blackbody spectral range - but at levels determined by the temperature of where it radiates.
If you want to play with the math, I would suggest both looking into the freely available copies of MODTRAN as well as reading Myhre et al 1998, where they used line-by-line radiation codes for multiple locations (you cannot get correct global results by looking at a single locations, such as the Barrow atmospheric column) to compute the effective direct forcing change for 2x CO2, which results in the simplified formula:
ΔF = 5.35*ln(C/C0)
I don't know if Tom or KR has watched Jonathan's video, but I think there's a bit of an issue in how he's approaching the questions he's bringing up. But I don't know enough of the detailed science to address it.
At one point, while reading through the SkS material above, he comes to a point where the author starts applying a metaphor for how radiative absorption operates. But then Jonathan skips that metaphor and applies his own metaphor, one where he likens visible light to IR and CO2 to fog. In other words, he's trying to think of radiative absorption as similar to car headlights in the fog.
Rob Honeycutt - As I noted in a long ago comment here, you have to be very careful about reasoning from an analogy back towards a complex system that the analogy is trying to explain. In general the mapping from the complex system is only part of that system to one of the analogy relationships (forward mapping), and taking the analogy as 100% identity capable of outlining issues with the complex system (backward mapping) is an error. That's an incorrect use of analogy.
Far better to examine issues in the actual problem domain, as with the Myhre et al 1998 reference above - line by line radiative codes backed by detailed spectral data, later confirmed by satellite observations. Those are not amenable to nor contradicted by simple analogical reasoning and back of the envelope calculations.