


 Arguments


Is the CO2 effect saturated?
What the science says...
| Select a level... |
 Basic
Basic
|
 Intermediate
|
 Advanced
| ||||
|
The notion that the CO2 effect is 'saturated' is based on a misunderstanding of how the greenhouse effect works. |
|||||||
Climate Myth...
CO2 effect is saturated
"Each unit of CO2 you put into the atmosphere has less and less of a warming impact. Once the atmosphere reaches a saturation point, additional input of CO2 will not really have any major impact. It's like putting insulation in your attic. They give a recommended amount and after that you can stack the insulation up to the roof and it's going to have no impact." (Marc Morano, as quoted by Steve Eliot)
At-a-Glance
This myth relies on the use (or in fact misuse) of a particular word – 'saturated'. When someone comes in from a prolonged downpour, they may well exclaim that they are saturated. They cannot imagine being any wetter. That's casual usage, though.
In science, 'saturated' is a strictly-defined term. For example, in a saturated salt solution, no more salt will dissolve, period. But what's that got to do with heat transfer in Earth's atmosphere? Let's take a look.
Heat-trapping by CO2 in the atmosphere happens because it has the ability to absorb and pass on infra-red radiation – it is a 'greenhouse gas'. Infra-red is just one part of the electromagnetic spectrum, divided by physicists into a series of bands. From the low-frequency end of the spectrum upwards, the bands are as follows: radio waves, microwaves, infrared, visible light, ultraviolet, X-rays, and gamma rays. Gamma rays thus have a very high-frequency. They are the highest-energy form of radiation.
As our understanding of the electromagnetic spectrum developed, it was realised that the radiation consists of particles called 'photons', travelling in waves. The term was coined in 1926 by the celebrated physicist Gilbert Lewis (1875-1946). A photon's energy is related to its wavelength. The shorter the wavelength, the higher the energy, so that the very high-energy gamma-rays have the shortest wavelength of the lot.
Sunshine consists mostly of ultraviolet, visible light and infra-red photons. Objects warmed by the sun then re-emit energy photons at infra-red wavelengths. Like other greenhouse gases, CO2 has the ability to absorb infra-red photons. But CO2 is unlike a mop, which has to be wrung out regularly in order for it to continue working. CO2 molecules do not get filled up with infra-red photons. Not only do they emit their own infra-red photons, but also they are constantly colliding with neighbouring molecules in the air. The constant collisions are important. Every time they happen, energy is shared out between the colliding molecules.
Through those emissions and collisions, CO2 molecules constantly warm their surroundings. This goes on all the time and at all levels in the atmosphere. You cannot say, “CO2 is saturated because the surface-emitted IR is rapidly absorbed”, because you need to take into account the whole atmosphere and its constant, ongoing energy-exchange processes. That means taking into account all absorption, all re-emission, all collisions, all heating and cooling and all eventual loss to space, at all levels.
If the amount of radiation lost to space is equal to the amount coming in from the Sun, Earth is said to be in energy balance. But if the strength of the greenhouse effect is increased, the amount of energy escaping falls behind the amount that is incoming. Earth is then said to be in an energy imbalance and the climate heats up. Double the CO2 concentration and you get a few degrees of warming: double it again and you get a few more and on and on it goes. There is no room for complacency here. By the time just one doubling has occurred, the planet would already be unrecognisable. The insulation analogy in the myth is misleading because it over-simplifies what happens in the atmosphere.
Please use this form to provide feedback about this new "At a glance" section. Read a more technical version below or dig deeper via the tabs above!
Further details
This myth relies on the use of a word – saturated. When we think of saturated in everyday use, the term 'soggy' comes to mind. This is a good example of a word that has one meaning in common parlance but another very specific one when thinking about atmospheric physics. Other such words come to mind too. Absorb and emit are two good examples relevant to this topic and we’ll discuss how they relate to atmospheric processes below.
First things first. The effect of CO2 in the atmosphere is due to its influence on the transport of 'electromagnetic radiation' (EMR). EMR is energy that is moving as x-rays, ultraviolet (UV) light, visible light, infrared (IR) radiation and so on (fig. 1). Radiation is unusual in the sense that it contains energy but it is also always moving, at the speed of light, so it is also a form of transport. Radiation is also unusual in that it has properties of particles but also travels with the properties of waves, so we talk about its wavelength.
The particles making up radiation are known as photons. Each photon contains a specific amount of energy, and that is related to its wavelength. High energy photons have short wavelengths, and low energy photons have longer wavelengths. In climate, we are interested in two main radiation categories - firstly the visible light plus UV and minor IR that together make up sunshine, and secondly the IR from the earth-atmosphere system.
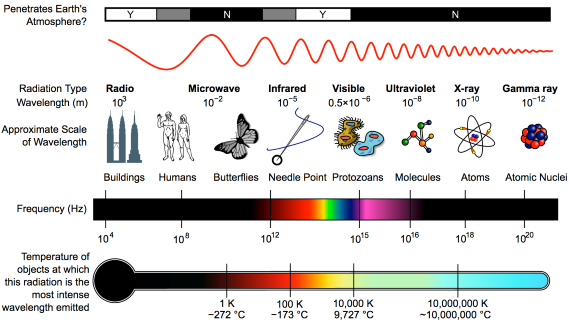
Fig. 1: diagram showing the full electromagnetic spectrum and its properties of the different bands. Image: CC BY-SA 3.0 from Wikimedia.
CO2 has the ability to absorb IR photons – it is a 'greenhouse gas'.So what does “absorb” mean, when talking about radiation? We are all familiar with using a sponge to mop up a water spill. The sponge will only absorb so much and will not absorb any more unless it's wrung out. In everyday language it may be described, without measurements, as 'saturated'. In this household example, 'absorb' basically means 'soak up' and 'saturated' simply means 'full to capacity'. Scientific terms are, in contrast, strictly defined.
Now let's look at the atmosphere. The greenhouse effect works like this: energy arrives from the sun in the form of visible light and ultraviolet radiation. A proportion reaches and warms Earth's surface. Earth then emits the energy in the form of photons of IR radiation.
Greenhouse gases in the atmosphere, such as CO2 molecules, absorb some of this IR radiation, then re-emit it in all directions - including back to Earth's surface. The CO2 molecule does not fill up with IR photons, running out of space for any more. Instead, the CO2 molecule absorbs the energy from the IR photon and the photon ceases to be. The CO2 molecule now contains more energy, but that is transient since the molecule emits its own IR photons. Not only that: it's constantly colliding with other molecules such as N2 and O2 in the surrounding air. In those collisions, that excess energy is shared with them. This energy-sharing causes the nearby air to heat up (fig. 2).
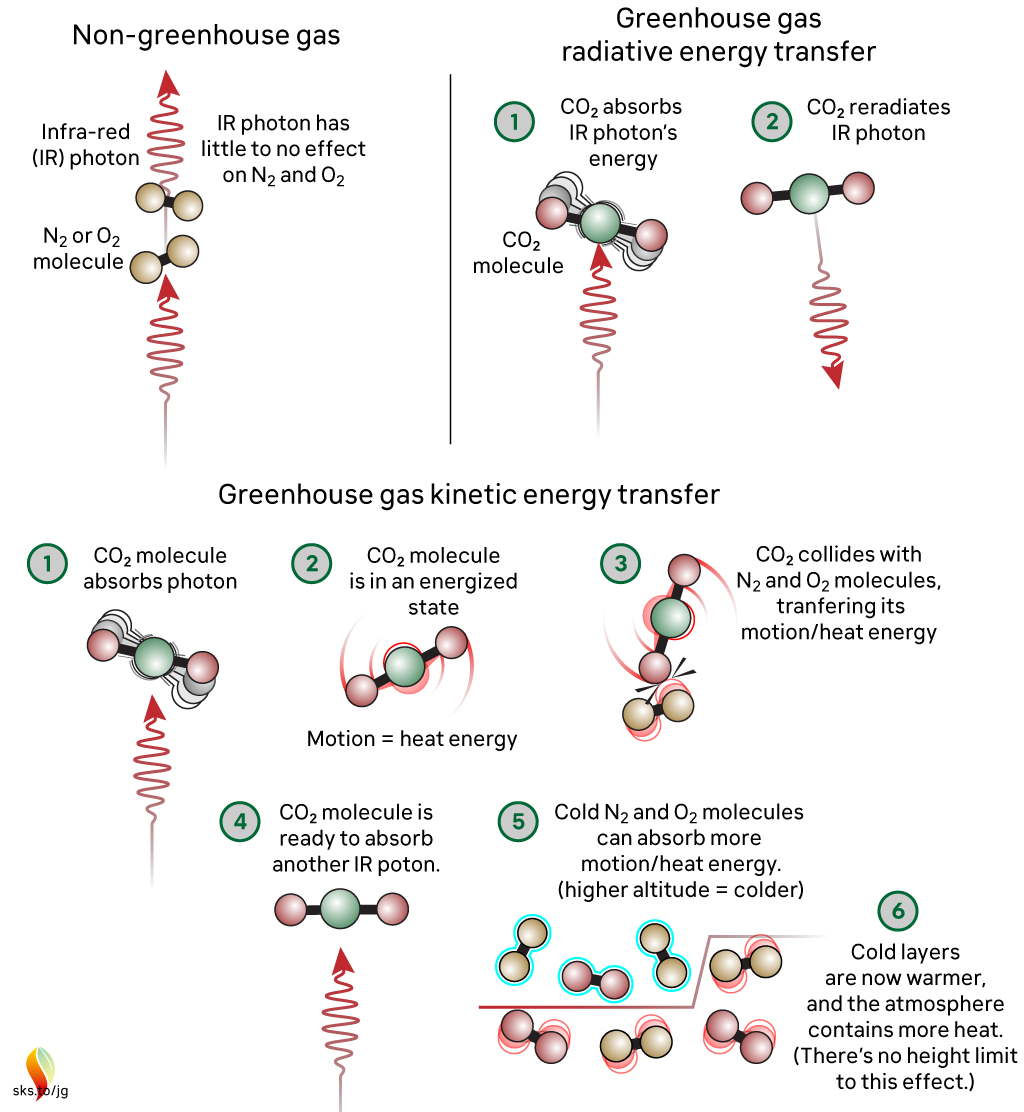
Fig. 2: The greenhouse effect in action, showing the interactions between molecules. The interactions happen at all levels of the atmosphere and are constantly ongoing. Graphic: jg.
The capacity for CO2 to absorb photons is almost limitless. The CO2 molecule can also receive energy from collisions with other molecules, and it can lose energy by emitting IR radiation. When a photon is emitted, we’re not bringing a photon out of storage - we are bringing energy out of storage and turning it into a photon, travelling away at the speed of light. So CO2 is constantly absorbing IR radiation, constantly emitting IR radiation and constantly sharing energy with the surrounding air molecules. To understand the role of CO2, we need to consider all these forms of energy storage and transport.
So, where does 'saturation' get used in climate change contrarianism? The most common way they try to frame things is to claim that IR emitted from the surface, in the wavelengths where CO2 absorbs, is all absorbed fairly close to the surface. Therefore, the story continues, adding more CO2 can’t make any more difference. This is inaccurate through omission, because either innocently or deliberately, it ignores the rest of the picture, where energy is constantly being exchanged with other molecules by collisions and CO2 is constantly emitting IR radiation. This means that there is always IR radiation being emitted upwards by CO2 at all levels in the atmosphere. It might not have originated from the surface, but IR radiation is still present in the wavelengths that CO2 absorbs and emits. When emitted in the upper atmosphere, it can and will be lost to space.
When you include all the energy transfers related to the CO2 absorption of IR radiation – the transfer to other molecules, the emission, and both the upward and downward energy fluxes at all altitudes - then we find that adding CO2 to our current atmosphere acts to inhibit the transfer of radiative energy throughout that atmosphere and, ultimately, into space. This will lead to additional warming until the amount of energy being lost to space matches what is being received. This is precisely what is happening.
The myth reproduced at the top – incorrectly stating an analogy with roof insulation in that each unit has less of an effect - is misleading. Doubling CO2 from 280 ppm to 560 ppm will cause a few degrees of warming. Doubling again (560 to 1130 ppm) will cause a similar amount of additional warming, and so on. Many doublings later there may be a point where adding more CO2 has little effect, but recent work has cast serious doubt on that (He et al. 2023). But we are a long, long way from reaching that point and in any case we do not want to go anywhere near it! One doubling will be serious enough.
Finally, directly observing the specific, global radiative forcing caused by well-mixed greenhouse gases has - to date - proven elusive. This is because of irregular, uncalibrated or limited areal measurements. But very recently, results have been published regarding the deep reinterrogation of years of data (2003-2021) from the Atmospheric Infrared Sounder (AIRS) instrument on NASA's Aqua Satellite (Raghuraman et al. 2023). The work may well have finally cracked the long-standing issue of how to make finely detailed, consistent wavelength-specific measurements of outgoing long-wave radiation from Earth into space. As such, it has opened the way to direct monitoring of the radiative impact (i.e. forcing + feedback) of greenhouse gas concentration changes, thereby complimenting the Keeling Curve - the longstanding dataset of measured CO2 concentrations, down at the planet's surface.
Note: Several people in addition to John Mason were involved with updating this basic level rebuttal, namely Bob Loblaw, Ken Rice and John Garrett (jg).
Last updated on 31 December 2023 by John Mason. View Archives


Satoh @322:
First, the graph I used was just a highlighted region used to show the agreement between model and observation closely. As Glenn correctly notes, it is one of three graphs in the original paper, two of which is shown by Science of Doom, including this one:
Second, Science of Doom also developed his own Line by Line model, and used it to calculate first the upward IR radiation at various altitudes with a clear sky:
And then just the transmitted upward IR radiation from the surface:
The light blue shows the transmission to 22.8 kilometers of altitude, ie, effectively to space. Except for very small amounts, almost all of it comes from the 750-1350 wave number "atmospheric window", in which around 90% of surface emitted IR radiation transits the atmosphere. Overall, there will be slightly more than 17% (=40/239) of surface radiation will be transmitted averaged over the Earth in clear sky conditions. That is because no IR radiation from the surface penetrates clouds. Taking clouds into account, the total is reduced to approximately 17%.
It should be noted that SOD's model does not differ on any principles relative to the models that produced the predicted result in Conrath et al (1970), nor those that produce so good a match to observations as shown in the scatterplot of 134,862 model/observation comparisons by Dessler et al (2008). Those models of prove accuracy, therefore, will produce equivalent results if atmospheric emission is eliminated from them as well.
Your mistake is to assume that the IR radiation to space consists of the surface emission minus atmospheric absorption. It is, however, overwhelmingly the result of atmospheric emission, with nearly all (90%) of surface emission being absorbed in the atmosphere.
IR satellites are able to produce usefull images because their IR sensors are tuned to the atmospheric window where only about 10% of surface emission is absorbed. Indeed, they will be tuned to the precise frequencies in which absorption is at a minimum. Even so, they do not see through clouds and have a degraded performance relative to optical cameras.
Glenn, the images I am talking about are generically known as FLIR which means Forward Looking IR. It's an old-fashioned military term for heat seeking and visualizing equipment that goes back many decades. There are many FLIR cameras / sights on many types of military weapons, where an enemy soldier's human form can clearly be seen using only the IR that he radiates. All objects that emit IR are as clear as if a light camera were taking them, and you can identify humans, tanks, hot weapons (and their ammunition) from 20,000 feet elevation. I don't see how this is possible if the atmosphere absorbs and re-emits IR. I believe FLIR operates at all wavelengths that CO2 emits. I believe that CO2 absorbs IR and turns it into kinetic heat. I do not believe in back-radiation in the troposphere, otherwise FLIR would not work at all.
Satoh from Wikipedia on the subject of FLIR
"Infrared light falls into two basic ranges: long-wave and medium-wave. Long-wave infrared (LWIR) cameras, sometimes called "far infrared", operate at 8 to 12 μm, and can see heat sources, such as hot engine parts or human body heat, a few miles away. Longer-distance viewing is made more difficult with LWIR because the infrared light is absorbed, scattered, and refracted by air and by water vapor. ...
Medium-wave (MWIR) cameras operate in the 3-to-5 μm range. These can see almost as well, since those frequencies are less affected by water-vapor absorption, but generally require a more expensive sensor array, along with cryogenic cooling."
Contrast this with Tom's just posted graph. 8-12μm is the 'atmospheric window' plus a bit of the H2O absorption bands on either side. No involvement from CO2. And virtually no backradiation since that only occurs at wavelenths where the GH gases can absorb and thus emit. And 3-5μm is completely off the graph to the right.
FLIR works precisely because it works around the absorption properties of the GH gases. Your belief that " FLIR operates at all wavelengths that CO2 emits" is incorrect.
And Back Radiation isn't something to be believed in or not. It is something routinely and directly observed.
Satoh @327, I was going to quote exactly the same secton from wikipedia as Glenn. To make the point clearer, however, here is the IR atmospheric transmittance from wikipedia:
You will notice that both IR camera frequency bands (3-5 micron and 8-12 microns) have relatively high transmittance. Indeed, the average transmittance over the 8-12 band is probably better, but atmospheric radiation is very low in the 3-5 micron band making it more suitable for long distance viewing. The difference between the two bands is that between looking through fog (3-5 micron) and looking through a glowing fog (8-12 microns).
The irony of your argument is that the chief database of emission frequencies for atmospheric gases (the HiTran database) was generated by the USAF in order to determine which frequencies were suitable for IR cameras (and heat seakers) and which were not. Having constructed their cameras using information from that database applied to radiative models equivalent to those which show the greenhouse effect (as shown above), you now cite the effectiveness of those cameras as disproof of the database and theories used in constructing them.
The irony is that you would include a graph that shows 80% transmittence in the N-Band (8 to 13 microns) which is a big fat region smack in the middle of the strongest part of earth's radiation curve, and use it as part of your argument that Trenberth's 10% figure, of blackbody surface radiation making it to space, is correct. I won't link to the article on the N-Band in Wikipedia, I'll let you do it, but if you add that to the J Band and the K Band, I just don't believe it's only 10%. There are more windows in the atmosphere than there are in Notra Dame. If we account for clouds, which cover roughly half the sky, then the figure would be 20%, half blocked by cloud, but that still seems way too low.
Satoh
The N Band is the only one relevent. J & K bands are at wavelengths too small to have any meaningful impact. They are used in Infrared Astronomy because they are studying stars. These obviously have surface temperatures much higher than the Earth so their Planck curves are shifted to lower wavelengths and the J&K bands then sit above regions of the planck curve where the intensity of radiation is significant. However at the Earth's temperature the amount of energy being radiated in those bands is utterly negligible. Look at the graphs Tom showed from SOD. 2.5 μm for one of those bads would be a wave number of 4000 - of the right of the graph where the intensity is utterly negligible.
Where I think you are perhaps tripping yourself up is just thinking about transmittance. What also has to be considered is how much energy is available at each wavelength. J & K bands allow 60-80% transmission; 60-80% of virtually nothing.
Also, even within the N band window, that still only allows 80% transmission in clear sky conditions. Under cloudy skies, clouds absorb across the entire spectrum and contribute to the GH effect. Clouds are estimated to contribute 25% to the GH effect. When there are clouds present transmission through the N band is essentially zero. Again what then escapes through the N bamd is reradiation from the clouds.
I suggest you familiarize yourself with all the bands. J, K and N are not the only ones. The newer microbolometers don't operate in the J or K band anyway, the energy consumed by the cryogenic cooling system proved prohibitive, even if you cool with liquid helium the weight would not permit use on drones. The newer ambient temperature microbolometers are sensitive to the entire range of CO2′s emission wavelengths and they work perfectly, due to the fact that at normal pressures and temperatures CO2′s emissivity is somewhere around 0.0019. The only thing operators ever worry about is water vapor, and never breathe a word about CO2, because the relative contribution of CO2 to skyglow is nill compared to H2O. Your argument where you discount the N band because some days are cloudy is what we all know of as straw man argument. We obviously are not talking about cloud.
Satoh @332:
We have long passed the point where Satoh is ready to say any absurd thing to defend his clearly mistaken original claims. One of those original claims was, in support of a merely distracting (and confusing if adopted) terminological preference, that "the 15 micron IR band radiates from earth's surface and is absorbed to extinction by CO2 in the lowest level of the atmosphere (the elevation of extinction is around 500 feet)". As the 15 micron bandwidth is significant for any near room temperature thermal emission, this contradicts his claim about the emissivity of CO2 "at normal pressures and temperatures". He may be misleadingly citing CO2's emissivity across all wavelengths rather than relative to wavelengths with significant thermal emissions at room temperatures, but then his claim is misleadingly phrased (at the least).
More to the point, IR microbolometers typically are tuned to the 7.5-14 micron bandwidth (ie, the atmospheric window as shown in the graph at 329). This is claimed to be the case by wikipedia, by Laser Focus World, and by Optics.org. While micro-bolometers can be, and have been tuned to other wavelengths, I have not found a single example tuned to dominant wavelengths for room temperature thermal emission which was not also tuned to the atmospheric window. Unless Satoh can provide citations with wavelengths specified in microns to at least one decimal place (or equivalently accurately specified frequencies), I have to suspect his claim is bogus.
As we are discussing globally averaged emissions to space, the claim that clouds are a "straw man argument" can be dismissed as rather brazen bluster. That is, unless Satoh is going to seriously argue either that the Earth has no clouds, or that clouds no not absorb IR radiation ;)
Brazen bluster is saying that 80% transmission in the N band doesn't matter because sometimes it's cloudy, and making the straw man "when it's cloudy, transmission through the N band is essentially zero". Is there anybody who doesn't know about clouds? Since clouds cover around half the sky, that cuts it from 80% to 40% but it does the same to all other radiation. It's a complete straw man, tin man, and cowardly lion in one swell foop, and you can throw in the man behind the curtain.
Brazen bluster is claiming that CO2 is a grey body. Emissivity of a perfect black body is 1.0 (no units), so anything slightly less than that is a grey body. What shade of grey is 0.009 (no units). There are 50 shades of gray and that one wasn't in the book. Claiming CO2 acts like a bb radiator at the top of the atmosphere is brazen bluster, especially since the emissivity of CO2 goes up as the temperature goes down.
[RH] Please ratchet the tone down a few notches.
Satoh,
If you could provide some citations to support your claims it would be helpful. Tom has provided copius graphs and citations to support his claims. You have only your unsupported word. If you provided citations to support your claims it would be easier to judge them.
Michael, the classic reference that CO2 emissivity increases with decreasing temperatures is the Hottel charts, in use for at least 50 years and still the benchmark. I think this has them on page 552 of this old gem:
LINK
[RH] Fixed link that was breaking page format. Please check out the link feature on the second formatting tab above the text box.
OK I checked my reference, those charts were for a mixture of H2O and CO2, with an emissivity 10 times higher than that of CO2 alone. I'll try to find a link to the Hottel charts. Otherwise, if you need citations, can you please tell me what information you need a citation for? I don't know what needs references and what is "widely known" and/or can easily be googled or wikipedia'd
Satoh,
In general, in a scientific argument you must provide citations for any claim you make that is in dispute. If you say that Tom's claim is a "Brazen Bluster" you must provide support for your claim, which you have not done. Tom provided data to support his claims. If you fail to provide support (as you have done so far for all of your arguments), I presume that the support does not exist.
The unsupported claim of a random internet guy is not worth anything in a scientific discussion. When you finally provide a citation and it is the incorrect graph that does not make you look very well informed. I am not expert in IR spectroscopy, but I can read and understand the references. You must provide those references to support your claims to be taken seriously. It is not my job to Google all your claims.
Satoh,
While I am not expert in IR spectroscopy, it flys in the face of reason for the total emmisivity to increase as the temperature decreases. The percent of emmisivity at a single wavelength could increase, but if the total emmisivity increased than a colder body would heat a nearby hotter body. That violates the first law of thermodymanics. Perhaps you need to review your posts and ensure you are not accidently claiming total emmisivity is increasing when you really mean relative emmisivity is increasing. But perhaps I misunderstand emmisivity since I am not an expert.
As the discussion has turned to Hottel Emissivity, graphs, here are two, one for CO2 and the other for H2O:
And another with metric units for pressure length, but degrees Rankine for temperatures, CO2 alone:
I have been unable to find graphs with metric units both for pressure-length, and temperature (or Imperial units for both). The second comes from a comment by DeWitt Payne on Science of Doom.
Elsewhere DeWitt Payne has two comments on how to interpret, and use such graphs. In the first, he attempts to clariffy a misconception about how to use the charts:
That clarrifies the relevance of the units of the curves, ie, the pressure-length, atmospheres per meter in the graph shown by DeWitt Payne (ie, the second graph above). That is, to determine the emissivity of CO2 at a given temperature, you determine the atmosphere-length by multiplying the partial pressure of the CO2 in atmospheres by the path length in meters. If the path length is 10 horizontal kilometers, and the partial pressure is 0.0004 atmospheres, the atmosphere-length is 4 atmosphere-meters (and hence well of the charts above). In an earlier post (@322) Satoh referred to "...the fact that at normal pressures and temperatures CO2′s emissivity is somewhere around 0.0019". The lowest line on the second graph above shows a atmosphere-length of 0.0003 amtmosphere meters (ie, about 300 ppmv over one meter). At 1500 Rankine (560 C), its lowest temperature value it shows an emissivity of 0.005, or about 2.5 times that quoted by Satoh. I presume the chart Satoh used had a shorter unit than a meter. Regardless he is clearly making the error DeWitt Payne attempts to correct in his discussion on SOD.
Having said that, DeWitt Payne's estimate of a 0.2 emisivity at standard pressures and temperatures for the full height of the atmospheric column is probably fairly close. That is because the emissivity is the total irradiated energy divided by the total irradiated energy of a black body with the same temperature. (See DeWitt Payne's worked example.) The consequence of this is that as temperature rises, total emission of a black body rises with the fourth power of temperature. Total emission of CO2 as a thermal emitter will also rise, but in bandwidths in which it already radiates strongly, at a far lower rate than with the fourth power of temperature. The result is a general decline in emissivity even while emissions at every wavelength in which emissions exist actually increase. The general decline is not absolute. If a potential emitting wavelength comes within the range of thermal radiation, it will initially increase its emissions at faster than the 4th power of temperature resulting a temporary rise in emissivity with temperature, as can be seen on the CO2 charts for temperatures between 1000 and 2000 Rankine (280-840 C).
The upshot of all this is that emission at a given wavelength for thermal emission always increases with increased temperature. When Satoh claims that "We all know, 200 K is very cold. If the elevation of this emitting layer of CO2 climbs higher, and therefore becomes colder, it makes the temperature closer to 200K and therefore the emission would be STRONGER, not weaker" (@320, refuted @321) he is simply wrong, and is not supported by the Hottel charts in that conclusion. On the other hand, when he says, as @334, "... the emissivity of CO2 goes up as the temperature goes down", he is (in general) correct, but it does not have the consequences he assumes. Put simply, emission is not emissivity. Satoh incorrectly assumes they are.
This diversion has not been without benefit, however. Contrary to his claim @337, his reference is a good one, showing Hotel charts for H2O alone (Figure 2) and CO2 alone (Figure 3) as well as both combined in other figures. I also claims that the Exponential Wide Band Model (EWBM) as well as Narrow Band Models (NBM) perform well, with accuracy primarilly limited only by the accuracy of the original spectral absorption lines in such databases as Hitran. Satoh, apparently, did not notice the endorsement, and that he has cited in his argument against the results of NBMs a paper that endorses them.
Tom, excellent work, except the second graph is for water vapor. The first is for CO2, which demonstrates the sea level values, seasonally averaged, that I gave in @322. I don't mean to criticize, it's a simple mistake.
I meant @332
Convert 1 foot = .3 meters and visualize the line
Ok see now, when you said 2nd graph you meant the 3rd graph at the bottom. Looking at that graph, which is for high pressure industrial use and doesn't come close to the atmospheric value, using 400 ppm and sea level path length of 33 meters you'd get a line that would read .0000121 atm m
Satoh @341, at one point I refer to the graph posted by DeWitt Payne as the "second graph". That was potentially ambiguous, but was intended to refer to the graph with units of degrees Rankine on the x-axis (which is for CO2). Fig 1 (b) is, of course, for H2O, while figure 1 (a) is also for CO2. Refering to that, and considering the upper most line (4 foot atmospheres). With a CO2 partial pressure of 0.0004 (ie, 400 ppmv), that equates to 10,000 feet or 3,048 meters. As can be seen, that approximates to an emisivity of 0.2.
For the same distance, a pressure-distance of 20, corresponds to a partial pressure of 0.002 atmospheres which is a very low value for water vapour concentration, yet yields an emisivity of approx 0.6.
Cearly there are overlaps between CO2 and H2O absorption bands, but given the depth of the atmosphere, these are underestimates of the emissivities of the two gases for the full depth of the atmosphere. Therefore, as a reasonable sanity check on your claims, we can simply combine them by addition for a combined emissivity of 0.8 - indicating just 20% of surface emissions escape to space - and that in clear sky conditions. Therefore, correctly used as a sanity check, the Hotel emission graphs support the findings of Khiel and Trenberth.
Satoh @343:
It is atmosphere - meters, not "atmosphere/meters". Ergo 400 ppmv (= 0.0004 atm) with a path length of 33 meters equates to 0.0132 atmosphere meters. The closest contour shown to that is 0.012 atmosphere meters (ie, pathlength of 30 meters with current atmospheric concentration of CO2). 15 degrees C (=288 K) is 519 Rankine, at which temperature the 0.012 contour approximates to an emissivity of 0.06. That is, just 30 meters of atmosphere at current CO2 concentrations and excluding the effects of water vapour eliminates 6% of upward surface emissions.
Satoh, you're acting a lot like the Black Knight.
I don't know where your 10,000 feet comes from. I think you are confused by path length. When a solid or liquid emits a photon, it emits from a patent surface, the solid surface or the liquid surface, but when a gas emits a photon, being a gas, it emits from a region of space. Emissitivy is not calculated the same for a gas. The path length refers to the length between emitting molecules, in a straight line. The shorter that path, the greater the emissivity. The mean path length at sea level for photons between CO2 molecules was 33 mm years ago but I'm saying 30 mm now which is .03 m. The emissivity of CO2 at sea level goes along the curve of .0004 x .03 which is the .000021 I mentioned, which is not on the graph but you can visualize it.
Wait, did you think that 10,000 feet was the length the photons went, the column of air, from surface to top of atmosphere or something? There is no possible way an IR photon at 15 microns is going through 10,000 feet of air. It's blocked right near the ground. Gee whiz. Blocked and turned into kinetic heat. Please tell me where your 10,000 feet comes from.
I see what you did. You randomly picked the top line and said "it's 4 foot atmospheres which is .0004 X 10,000 feet" so it would point to the 0.2 mark. That's pretty arbitrary. The mean free path length of 15 micron photons at sea level is definitely not 10,000 feet so you can't use that line.
This paper has been floating around the web which says the mean path length for photons in CO2 at sea level is 32 meters. I don't buy it. They first measured it many years ago and it was in millimeters. I'd like to know what the latest calculations are for that.
Mean path length applies to absorption, and it also applies to emission. They are inverse of the same process.
The paper I just cited says the emissivity of CO2 is .0027 (no units)