


 Arguments


Is the CO2 effect saturated?
What the science says...
| Select a level... |
 Basic
Basic
|
 Intermediate
|
 Advanced
| ||||
|
The notion that the CO2 effect is 'saturated' is based on a misunderstanding of how the greenhouse effect works. |
|||||||
Climate Myth...
CO2 effect is saturated
"Each unit of CO2 you put into the atmosphere has less and less of a warming impact. Once the atmosphere reaches a saturation point, additional input of CO2 will not really have any major impact. It's like putting insulation in your attic. They give a recommended amount and after that you can stack the insulation up to the roof and it's going to have no impact." (Marc Morano, as quoted by Steve Eliot)
At-a-Glance
This myth relies on the use (or in fact misuse) of a particular word – 'saturated'. When someone comes in from a prolonged downpour, they may well exclaim that they are saturated. They cannot imagine being any wetter. That's casual usage, though.
In science, 'saturated' is a strictly-defined term. For example, in a saturated salt solution, no more salt will dissolve, period. But what's that got to do with heat transfer in Earth's atmosphere? Let's take a look.
Heat-trapping by CO2 in the atmosphere happens because it has the ability to absorb and pass on infra-red radiation – it is a 'greenhouse gas'. Infra-red is just one part of the electromagnetic spectrum, divided by physicists into a series of bands. From the low-frequency end of the spectrum upwards, the bands are as follows: radio waves, microwaves, infrared, visible light, ultraviolet, X-rays, and gamma rays. Gamma rays thus have a very high-frequency. They are the highest-energy form of radiation.
As our understanding of the electromagnetic spectrum developed, it was realised that the radiation consists of particles called 'photons', travelling in waves. The term was coined in 1926 by the celebrated physicist Gilbert Lewis (1875-1946). A photon's energy is related to its wavelength. The shorter the wavelength, the higher the energy, so that the very high-energy gamma-rays have the shortest wavelength of the lot.
Sunshine consists mostly of ultraviolet, visible light and infra-red photons. Objects warmed by the sun then re-emit energy photons at infra-red wavelengths. Like other greenhouse gases, CO2 has the ability to absorb infra-red photons. But CO2 is unlike a mop, which has to be wrung out regularly in order for it to continue working. CO2 molecules do not get filled up with infra-red photons. Not only do they emit their own infra-red photons, but also they are constantly colliding with neighbouring molecules in the air. The constant collisions are important. Every time they happen, energy is shared out between the colliding molecules.
Through those emissions and collisions, CO2 molecules constantly warm their surroundings. This goes on all the time and at all levels in the atmosphere. You cannot say, “CO2 is saturated because the surface-emitted IR is rapidly absorbed”, because you need to take into account the whole atmosphere and its constant, ongoing energy-exchange processes. That means taking into account all absorption, all re-emission, all collisions, all heating and cooling and all eventual loss to space, at all levels.
If the amount of radiation lost to space is equal to the amount coming in from the Sun, Earth is said to be in energy balance. But if the strength of the greenhouse effect is increased, the amount of energy escaping falls behind the amount that is incoming. Earth is then said to be in an energy imbalance and the climate heats up. Double the CO2 concentration and you get a few degrees of warming: double it again and you get a few more and on and on it goes. There is no room for complacency here. By the time just one doubling has occurred, the planet would already be unrecognisable. The insulation analogy in the myth is misleading because it over-simplifies what happens in the atmosphere.
Please use this form to provide feedback about this new "At a glance" section. Read a more technical version below or dig deeper via the tabs above!
Further details
This myth relies on the use of a word – saturated. When we think of saturated in everyday use, the term 'soggy' comes to mind. This is a good example of a word that has one meaning in common parlance but another very specific one when thinking about atmospheric physics. Other such words come to mind too. Absorb and emit are two good examples relevant to this topic and we’ll discuss how they relate to atmospheric processes below.
First things first. The effect of CO2 in the atmosphere is due to its influence on the transport of 'electromagnetic radiation' (EMR). EMR is energy that is moving as x-rays, ultraviolet (UV) light, visible light, infrared (IR) radiation and so on (fig. 1). Radiation is unusual in the sense that it contains energy but it is also always moving, at the speed of light, so it is also a form of transport. Radiation is also unusual in that it has properties of particles but also travels with the properties of waves, so we talk about its wavelength.
The particles making up radiation are known as photons. Each photon contains a specific amount of energy, and that is related to its wavelength. High energy photons have short wavelengths, and low energy photons have longer wavelengths. In climate, we are interested in two main radiation categories - firstly the visible light plus UV and minor IR that together make up sunshine, and secondly the IR from the earth-atmosphere system.
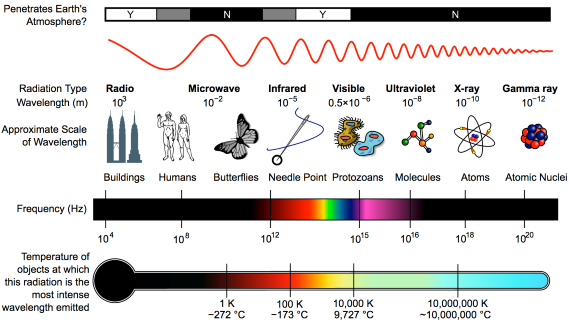
Fig. 1: diagram showing the full electromagnetic spectrum and its properties of the different bands. Image: CC BY-SA 3.0 from Wikimedia.
CO2 has the ability to absorb IR photons – it is a 'greenhouse gas'.So what does “absorb” mean, when talking about radiation? We are all familiar with using a sponge to mop up a water spill. The sponge will only absorb so much and will not absorb any more unless it's wrung out. In everyday language it may be described, without measurements, as 'saturated'. In this household example, 'absorb' basically means 'soak up' and 'saturated' simply means 'full to capacity'. Scientific terms are, in contrast, strictly defined.
Now let's look at the atmosphere. The greenhouse effect works like this: energy arrives from the sun in the form of visible light and ultraviolet radiation. A proportion reaches and warms Earth's surface. Earth then emits the energy in the form of photons of IR radiation.
Greenhouse gases in the atmosphere, such as CO2 molecules, absorb some of this IR radiation, then re-emit it in all directions - including back to Earth's surface. The CO2 molecule does not fill up with IR photons, running out of space for any more. Instead, the CO2 molecule absorbs the energy from the IR photon and the photon ceases to be. The CO2 molecule now contains more energy, but that is transient since the molecule emits its own IR photons. Not only that: it's constantly colliding with other molecules such as N2 and O2 in the surrounding air. In those collisions, that excess energy is shared with them. This energy-sharing causes the nearby air to heat up (fig. 2).
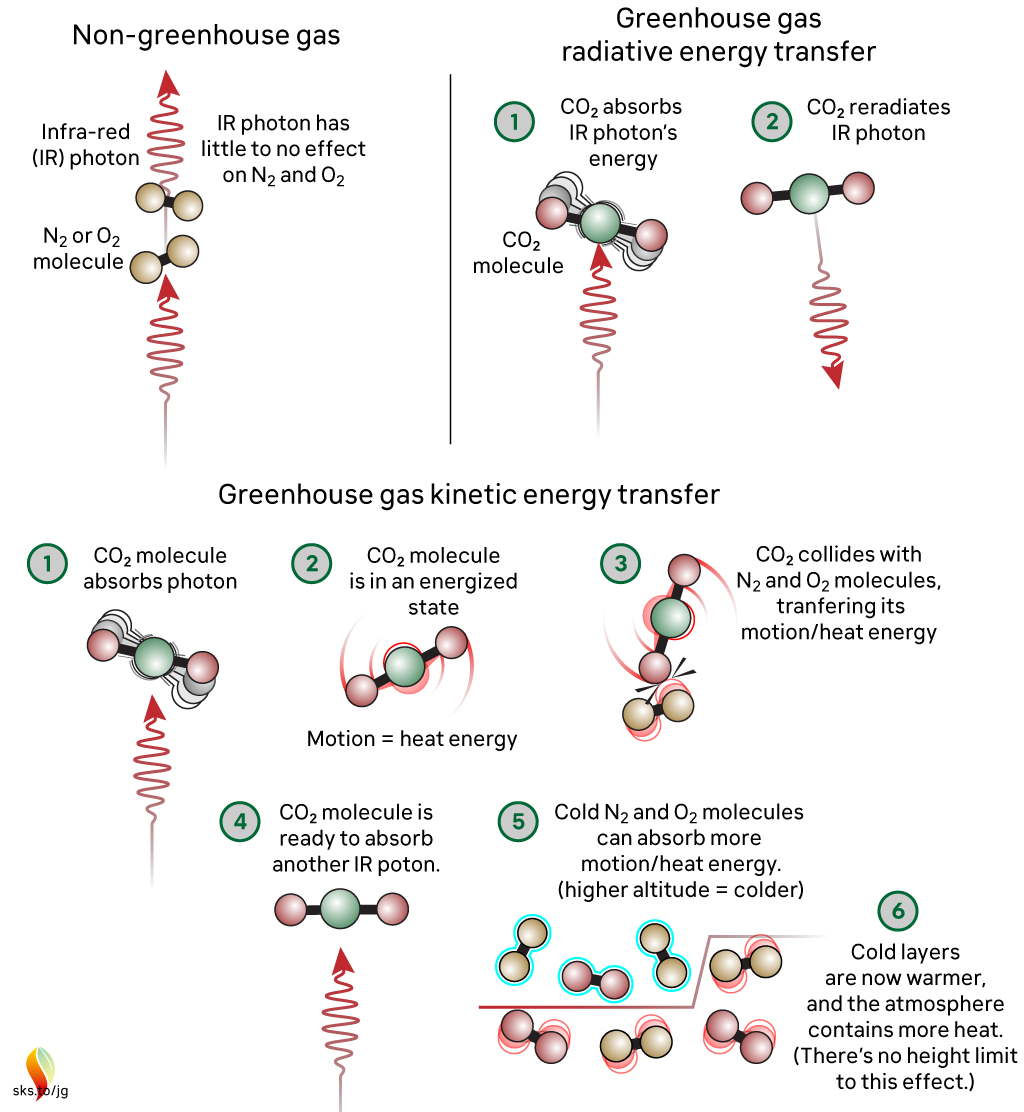
Fig. 2: The greenhouse effect in action, showing the interactions between molecules. The interactions happen at all levels of the atmosphere and are constantly ongoing. Graphic: jg.
The capacity for CO2 to absorb photons is almost limitless. The CO2 molecule can also receive energy from collisions with other molecules, and it can lose energy by emitting IR radiation. When a photon is emitted, we’re not bringing a photon out of storage - we are bringing energy out of storage and turning it into a photon, travelling away at the speed of light. So CO2 is constantly absorbing IR radiation, constantly emitting IR radiation and constantly sharing energy with the surrounding air molecules. To understand the role of CO2, we need to consider all these forms of energy storage and transport.
So, where does 'saturation' get used in climate change contrarianism? The most common way they try to frame things is to claim that IR emitted from the surface, in the wavelengths where CO2 absorbs, is all absorbed fairly close to the surface. Therefore, the story continues, adding more CO2 can’t make any more difference. This is inaccurate through omission, because either innocently or deliberately, it ignores the rest of the picture, where energy is constantly being exchanged with other molecules by collisions and CO2 is constantly emitting IR radiation. This means that there is always IR radiation being emitted upwards by CO2 at all levels in the atmosphere. It might not have originated from the surface, but IR radiation is still present in the wavelengths that CO2 absorbs and emits. When emitted in the upper atmosphere, it can and will be lost to space.
When you include all the energy transfers related to the CO2 absorption of IR radiation – the transfer to other molecules, the emission, and both the upward and downward energy fluxes at all altitudes - then we find that adding CO2 to our current atmosphere acts to inhibit the transfer of radiative energy throughout that atmosphere and, ultimately, into space. This will lead to additional warming until the amount of energy being lost to space matches what is being received. This is precisely what is happening.
The myth reproduced at the top – incorrectly stating an analogy with roof insulation in that each unit has less of an effect - is misleading. Doubling CO2 from 280 ppm to 560 ppm will cause a few degrees of warming. Doubling again (560 to 1130 ppm) will cause a similar amount of additional warming, and so on. Many doublings later there may be a point where adding more CO2 has little effect, but recent work has cast serious doubt on that (He et al. 2023). But we are a long, long way from reaching that point and in any case we do not want to go anywhere near it! One doubling will be serious enough.
Finally, directly observing the specific, global radiative forcing caused by well-mixed greenhouse gases has - to date - proven elusive. This is because of irregular, uncalibrated or limited areal measurements. But very recently, results have been published regarding the deep reinterrogation of years of data (2003-2021) from the Atmospheric Infrared Sounder (AIRS) instrument on NASA's Aqua Satellite (Raghuraman et al. 2023). The work may well have finally cracked the long-standing issue of how to make finely detailed, consistent wavelength-specific measurements of outgoing long-wave radiation from Earth into space. As such, it has opened the way to direct monitoring of the radiative impact (i.e. forcing + feedback) of greenhouse gas concentration changes, thereby complimenting the Keeling Curve - the longstanding dataset of measured CO2 concentrations, down at the planet's surface.
Note: Several people in addition to John Mason were involved with updating this basic level rebuttal, namely Bob Loblaw, Ken Rice and John Garrett (jg).
Last updated on 31 December 2023 by John Mason. View Archives


Satoh @347:
Ah! So because partial pressure has increased from 360-400, pathlength has decreased from 0.033 to 0.03, or in other words (on your interpretation) atmosphere meters is a constant for any given gas at a constant temperature. Do you perhaps want to rethink that?
Satoh @349/350.
That paper you cite manages to conclude saying:-
This is not the only argument from the author Nasif S. Nahle that purports to have disproved AGW. He has even shown that CO2 is cooling the planet, rather than warming it. This, of course, is 'men-in-white-coats' territory and not the stuff that should be presented here at SkS.
Nahle claims to disprove AGW by pointing out that the earth is not an actual physical greenhouse, which suggests the concept of metaphor is completely lost on him.
Tom@351
Yes, of course, if the partial pressure goes up, the path length goes down. Naturally.
I still need to know why you said 10,000 feet and why you used the top curve on graph 1.
Satoh,
Citing unpeer reviewed internet blogs that claim everyone else is wrong is not very useful in a scientific discussion, although it is better than nothing. Please raise your game. Nahles claim that his "paper" was "peer reviewed" by his friends in the Physics department is not a suitable scientific citation. Think: if this is the best you can find, is it really comparable to the recent AR5 report? That report was written by several thousand specialists and peer reviewed by tens of thousands of scientists. You must provide stronger evidence to get informed people to believe what you say.
You will look better if you think longer before you post. Tom's graphs A and B were clear to me.
Tom: thank you for defining emissivity and emission.
MA Rodger, thanks for the link to Nasif Nahle's claim that CO2 is cooling the planet. On that thread, a commenter named Neutrino heroically corrected Nahle's "logic." After revealing many of Nahle's astonishingly sloppy transcriptions of equations, misplacing of parentheses in equations, inconsistencies in units, and more, Neutrino summarized the crux of Nahle's error as treating the emissivity of one meter of atmosphere as if it is of the entire atmospheric column. Nahle then vanished from the discussion.
Satoh
Most people try to figure out extinction, absorption or emissivity over an arbitrary length scale of interest — say, the depth of the atmosphere or 10,000m. That is the pathlength TC is using. That length scale is not simply a random choice to get a result, but central to the entire point of the conversation, so it's a mystery why you should be surprised that he uses it. You appear to be saying that the amount of CO2, or water vapor, in that 10,000 meter column of air has no effect on the opacity of the atmosphere to absorb IR emitted from earth. I doubt that is what you mean, because we would have to throw spectroscopy right out the window...just to start.
You seem to be using "pathlength" to mean something completely different, maybe the average distance a photon emitted by a CO2 molecule must travel before (possibly) running into another CO2 molecule? or an extinction length scale? I can't tell for sure. If I as cynical I would say that you seem to change depending on which definition gives you the number for emissivity that you want.
Stephen, you are quite wrong. The definition of mean free path is well known and nothing new. You can't call a column of air the path length. The path length for CO2 is clearly defined as the mean length a photon will go before bumping into a CO2 molecule. It can't be scattered or re-radiated, and still be called the same path. Your comment is in grave error. The concept of mean free path length applies to moving molecules, atoms, electrons, photons, cosmic rays, etc. Emissivity of a solid or liquid is a surface phenomenon, emissivity of a gas uses the path length for obvious reasons...the photons that originate behind the path length don't originate at the surface....which is the path length.
Michael, I did not cite that Nahle paper. I brought it up because it's the only paper online that estimates the path length for CO2 at sea level, and is cited several times around the web. In fact, I said it was wrong as part of my argument.
Tom Dayton, atmospheric column? Read what I said to Stephen.
Stephen again, TC did not say 10,000 meters as the column length, he said 10,000 FEET so he could use the top curve on the graph, because it gave the higher emissivity of 0.3 for his argument.
Everybody, if the path length of CO2 was 10,000 feet, photons would go 10,000 feet on average before hitting a CO2 molecule, there would be no greenhouse effect from CO2, and we would not be here.
Satoh,
I read some of your cite. It contains chemistry calculations which I am familiar with. The first equation is:
"The density of the gas carbon dioxide in the atmosphere is obtained by the following formula:
ρCO2 = (12.187 * Molar mass of CO2 * volumetric fraction of CO2) / (276.69 K) = 756 mg/m^3. (Ref. 7)
Where 12.187 is the molar mass of elemental carbon, 44.01 is the molar mass of carbon dioxide, 390 ppmV is the volumetric fraction of CO2 and 276.69 K is its temperature."
I went to his reference 7 and got 756 mg/m3 for 390 ppmV. I found several problems with this calculation.
1) The units of Nahle's calculation are g/mol carbon*g/mol atmosphere/K. He incorrectly uses the units from reference 7 of mg/m3.
2) The textbook I teach chemistry from lists the molar mass of carbon as 12.0107 not 12.187. Nahle's number appears to have been made up to get the correct result.
3) Reference 7 uses 273.15K as the temperature not 276.69. Once again Nahle appears to have made up his number.
4) Additonal errors are smaller and not worth the text space.
Tom Dayton above links many additional basic errors.
How can you rely on a citation which has so many basic errors? Why do you think such junk is worth sharing? What websites are you reading to pick up this junk? Why do you believe what those websites say?
If you continue to rely on websites that think pseudoscience rife with basic errors can counter the IPCC report you will never understand the greenhouse effect and AGW. Perhaps you should start asking questions to become more informed, rather than citing obvious junk to support your mistaken notions.
"The definition of mean free path is well known and nothing new. You can't call a column of air the path length. "
Satoh, this is getting tiresome. You can't simply refer to mean free path and then call it path length and expect anyone to understand what you are saying. Those are two different concepts. If you conflate them (and others) noone can have a sensible conversation with you.
And yes, I accidentally said 10,000 m instead of feet. Mea culpa, but you are completely missing the main point.
TC picked that line because on that graph it best reflects the combination of the real ppmv of CO2 in the atmosphere (~400) and the real thickness of the atmosphere (which is actually thicker than 10,000', but you take what you can get.) Thus, 0.0004atm*10,000' = 4 ft.atmospheres.
The concept is simple...you need to consider the distance over which light traverses as well as the concentration of substances that may absorb light to determine the fraction of IR that is absorbed as it passes along that path. It's the basis of Beer-Lambert law in spectrometry and underlies a lot of quantitative chemistry.
Michael, I am not interested in discussing that Nahle paper. I did not cite it and don't care about it. I didn't even read it. Attacking that paper is a straw man.
Stephen, the mean free path length is the path length. The photon leaves the surface and hits a CO2 molecule. That's the path. After that, the energy converts to kinetic heat when the CO2 molecule bumps into an O2, N2, H2O, Argon, another CO2 molecule, a tree, a drop of rain, or anything else. It another photon gets emitted by the H2O, tree, raindrop or anything else, it's not a continuation of the "path." It's a new path.
Please end that line of argument because your line of argument has already bumped into something and was absorbed.
[JH]
Please note that posting comments here at SkS is a privilege, not a right. This privilege can be rescinded if the posting individual treats adherence to the Comments Policy as optional, rather than the mandatory condition of participating in this online forum.
Please take the time to review the policy and ensure future comments are in full compliance with it. Thanks for your understanding and compliance in this matter.
Stephen, the curve for 4.0 atm ft doesn't tell us anything about the combination. They could be 4 atmosphere with a path of 1 foot, .04 atmospheres with a path of 100 feet, or .000000000004 atmospheres with a path of 100000000000 feet. Like I said, if you increase the partial pressure you decrease the path, and are still on the same curve of the graph and have the same emissivity.
Satoh,
You cite the paper I referenced at 249 and 250.
Since you now deny what you previously cited I will no longer post responses to you. It is impossible to resolve diferences when one side denys what they previously claimed.
[Dikran Marsupial] The comment numbers should be 349 and 350 respectively, in both of which Satoh cited this article by Nasif Nahle (note it appears that it is not actually a peer reviewed scientific article).
"Stephen, the mean free path length is the path length."
Satoh, saying so does not make it so. I linked to the wikipedia definitions for both terms that make the difference in common usage clear. You refused to acknowledge those links. Hottel et al did not mean mean free path when they refer to pathlength, nor does anyone who uses the graphs. Simply saying they mean something different does not change that.
"Stephen, the curve for 4.0 atm ft doesn't tell us anything about the combination. They could be 4 atmosphere with a path of 1 foot, .04 atmospheres with a path of 100 feet, or .000000000004 atmospheres with a path of 100000000000 feet. Like I said, if you increase the partial pressure you decrease the path, and are still on the same curve of the graph and have the same emissivity."
So, why are their multiple lines on the Hottel emissivity graph if the meaning of pathlength, as used by the authors, corresponds to what you say? By your definition, there should only be one line, as concentration and pathlength would be perfectly anticorrelated for a given gas, although varying with temperature.
(BTW..I must apologize to everyone for getting issue involving emmisivity and absorptivity mixed up above in discussion of pathlength. Unnecessarily confusing that.)
Satoh @347, 348, 349, 350, and 354 criticized my understanding of path length as used as a measure of pressure-length (pL) in Hottel diagrams. This is despite the fact that he responded to my post @340 in which I describe my understanding by saying "excellent work" with no expressed quibble about my understanding of pL or emissivity, both of which he now disputes. In particular, he wrote @349:
The first and most crucial point is that L is not defined as "mean free path length", and that "mean free path length" is not the same thing as "mean path length". Indeed, Mehrota et al (1995) (download PDF), define L in pL as "mean Beam width". Further, in a worked example, they calculate estimates of emissivity for a Claus plant (described in Nasato et al, 1994), saying, "A mean beam length of L = 0.9 x diameter = 0.04 m can be used." (The inside diameter of the tube in question was 43.99 mm.)
Further, that is consistent with the lecture slides by Dr Prabal Talukdar on Gas Radiation in which he defines "Mean Beam Length":
He then shows a slide of a table of formula for different shapes including a "Circular cylinder of semi-infinite height" radiating to "an element at the center of the base" for which the formula is 0.9 *D. As these formula are not restricted as to the actual volumes enclosed, and as the worked example by Mehrota et al has a Beam Length significantly greater than your estimated Mean Free Path Length, I take this to show how experts in the field interpret L for the pL contours in Hottel diagrams (as opposed to the interpretation of biologists working outside of their field that even Anthony Watts considers to be a pseudo-scientist).
Worse, however, the mean free path length is given by the general formula l=1/(nσ), where l is the mean free path length, n is the number of particles involved, and σ is the effective cross sectional area of collision. (In Nahle's varian he uses "l=m/(nσ)" where m is the mass of the gas, and n is the number of molecules per unit mass which is equivalent.) However, by the ideal gas law,
P=nRT/V, where n is the number of molecules in moles, P is pressure, T is temperature, V volume and R a constant. Ergo, for constant temperature and volume, P is proportional to n. But n is inversely proportional to l (free path length), so that if L in pL is mean free path length, pL is constant for a constant temperature and volume. Ergo, if L were mean free path length, contours of constant pL in Hottel diagrams (which assume constant volume) would by necessity be vertical, ie, have a constant value in the x-axis (Temperature). Therefore it is mathematically impossible that L from pL = mean free path length. (Put another way that may be less obscure, because p is the inverse of l, of L=l then Hottel diagrams should revert to a mapping of Temperature directly onto emissivity, and shoud require no pL contours for that mapping.)
Turning to emissivity, we have the statement of Byun and Chen (2013) that Hottel diagrams model total emissivity, not spectral emissivity. The latter is the emission at a given wavelength or frequency relative to that predicted by the appropriate form of Planck's law for a black body at that wavelength or frequency. The former is the integral of the spectral emissivions as a ratio to the emission predicted by the Steffan-Boltzmann law for the total emission of a black body. Both, or course, are relative to a particular temperature.
Because the emissivity plotted in Hottel diagrams is total emissivity, it is irrelevant that the emission at 15 microns is absorbed within a very short distance. Emissions just above or just below 15 microns may not be absorbed for meter, or even kilometers and hence make a substantial contribution to mean Beam Length (L). Therefore, in determining the total emissivity of the atmosphere, you cannot assume very short mean beam lengths. (Nor should you assume mean beam lengths equivalent to the total height of the atmosphere because of decreasing pressure with altitude.) But looking horizontally, mean beam lengths of multiple kilometers are possible with near constant pressure. Hence my example of 10 horizontal kilometers, which with CO2 and amtospheric concentrations gives a total emissivity of approximately 0.2 (which I know independently to be the approximate total emissivity of CO2 looking vertically in clear sky conditions).
Here is a thought experiment. If 15-micron photons are streaming up from the surface, being absorbed, re-emitted, absorbed, re-emitted, all the way from the surface for 10,000 feet, how can you consider that 10,000 feet would ever come into any sort of calculation for total emissivity? Do you think anything gets bigger and bigger for 10,000 feet? If photons are absorbed and re-emitted 100 times from the surface to the TOA, that somehow that means there are 100 times more photons than if you only considered the uppermost photon paths? When a photon is absorbed and re-emitted, it's still just one photon? The amount of emissivity at the surface depends ONLY on the number of photons coming from the uppermost path length. That is the reason they say path length, and not total distance that all these have traveled. Only the top photons even REACH the surface, the others were all absorbed!
In a relay race, where 4 runners pass the baton, the emissivity at the end of the race is one baton, not 4.
Satoh @367, I thought you would take that line. That is why I pre-rebutted it, writing:
I will illustrate what I mean with an example from Modtran, a Broad Band Model of atmospheric radiation. The example shows the downward IR radiation from CO2 only for a tropical atmosphere with no clouds at 0 and 5 kms:
Because the IR spectra are show the net downward flux from CO2 in the absence of other radiative molecules, it shows the net emission from CO2 (ie, total downward emission by CO2 less total absorption of downward emission by CO2). This is not observed data, for which we cannot obtain H2O (and O3, and CH4 etc) free conditions. The model is of the type that has been shown to be reasonably accurate at predicting emissions from CO2 in furnaces and flames (ie, reasonably approximate to Hottel diagrams), especially near room temperatures. Ergo they will show the correct basic principles.
In atmospheric conditions pL is ill defined because, as shown in the side graph pressure is not constant with altitude, and nor is temperature. For this reason, Hottel diagrams are useless in determining atmospheric emissivities. However, pL in Hottel diagrams is proportional to the number of molecules in the mean beam length. Obviously, there are fewer molecules from 5 km to the top of the atmosphere (TOA) than there are from the ground to the TOA, so that the 5 km look up corresponds to having a smaller pL in a Hottel diagram.
The crucial difference between the two as seen above is that the emission in weak bands is stronger for 0 km looking up than it is for 5 km looking up. This is partially obscured by the lower base temperature for the 5 km looking up, but is very clear in the 10 micron emission range which is moderately strong for 0 km looking up, but near non-existent for 5 km looking up. That difference results in a reduced total emissivity for the 5 km looking up example than for the 0 km looking up example.
In fact, the model output gives the emission over the wavelengths shown in the graph, and the temperatures for the different levels. From that it can be calculated that the total emissivity of CO2 for the tropical atmosphere from 0 km up is 0.264 and for 5 km looking up it is 0.18. Because the calculation does not include the full spectrum, these will be slight over estimates of the emissivity. However, the total emissivity from 0 km looking up will not drop appreciably below 0.2.
SOD shows that it cannot be below 0.13 from observational evidence by SOD using measurements of back radiation spectra:
But that, is known to be an underestimate, not least because the example used is from an Arctic autumn (a factor not mentioned by SOD). It is possible to constrain the lower limit of total emissivity of CO2 in the atmosphere like this for a given surface temperature because CO2 absorbs so strongly in the 15 micron band, making it easy to distinguish.
So, while your reasoning is approximately valid the 15 micron peak of CO2 emissions, it is not valid for total emissivity. That mean beam length at 15 microns is so constrained is one of the reasons why emissivity does not increase linearly with pL.
A slight correction and clarrification for my preceding post. The emissivities calculated with modtran are for the tropical atmosphere only. Further, as I took the ratio of the integrated emission across the wave lengths shown to the total emissions for a black body with the surface temperature the emissivities are underestimates, within the limits of accuracy of the model, not over estimates as I indicated.
Yes, but emissions just above and below the 15 micron band, that go for kilometers, have nothing to do with CO2. They come from water vapor, cloud, and terrestrial. The ones from right next to 15, along the sides of the band that do come from CO2, are negligible in amplitude compared to the emissions from 15, or more exactly, 14.9, and even they don't go for kilometers.
Your attempt to rationalize a path length of 10,000 feet, in an attempt to rationalize a curve on the graph that shows a CO2 emissivity of 0.3, need to come to an end. Especially since you just said the Hottel charts don't work for atmospheric emissivities. (Correct, they don't. The Hottel charts are industrial charts for short distances in factory settings, under high pressure and very high heat.)
Satoh @370, you are evidently determined in your decision to be absolutely resistant to evidence. In this case, the modtran graphs shown above the only emissions shown are from CO2. The show emissions from an altitude of 80 km, and a difference of 5 km makes a difference in the emissivity. A difference of 10 km would also make a difference. Ergo, your introduction of Hottel graphs into the discussion, and your insistence that only values for the free path length of photons with a wave length of 14.9 microns with respect to a CO2 gas are shown (respectively) to be a red herring, and a blunder. Further, your insistence that you know more on this subject than the scientists who have spent their career pursuing the topic and wrote textbooks on the subject is simple arrogance of a breath taking quantity.
TC...lest your get frustrated, I just wanted to say that the only reason I followed this discussion was because I am less familiar with this aspect of atmospheric physics thanI should be (it's off my specialty by quite a ways) and I wanted to learn some more. And I have certainly learned a lot in this exchange, perhaps more than if you had simply been trying to explain things de novo.
[JH] Moderator's Comment
Satoh: Your "Artful Dodger" schtick has run its course. Any future posts by you will be summarily deleted.
Stephen Baines @372, firstly, thanks. Second, the reason I have persisted so long in the discussion is because of a hope that it would prove instructive to interested readers. I judge that by now, any questions that need to be answered have already been answered (several of them several times). However, if somebody other than Satoh has questions, I would be happy to address them if I am able.
I have a question. This debunking depends on the fact that stratospheric temperatures decrease with increasing elevation, so the CO2 gets colder as you gp higher, and radiates less. But I was always told that the stratosphere does not decrease in temperature with increased height. Please explain.