


 Arguments


Is the CO2 effect saturated?
What the science says...
| Select a level... |
 Basic
Basic
|
 Intermediate
|
 Advanced
| ||||
|
The notion that the CO2 effect is 'saturated' is based on a misunderstanding of how the greenhouse effect works. |
|||||||
Climate Myth...
CO2 effect is saturated
"Each unit of CO2 you put into the atmosphere has less and less of a warming impact. Once the atmosphere reaches a saturation point, additional input of CO2 will not really have any major impact. It's like putting insulation in your attic. They give a recommended amount and after that you can stack the insulation up to the roof and it's going to have no impact." (Marc Morano, as quoted by Steve Eliot)
At-a-Glance
This myth relies on the use (or in fact misuse) of a particular word – 'saturated'. When someone comes in from a prolonged downpour, they may well exclaim that they are saturated. They cannot imagine being any wetter. That's casual usage, though.
In science, 'saturated' is a strictly-defined term. For example, in a saturated salt solution, no more salt will dissolve, period. But what's that got to do with heat transfer in Earth's atmosphere? Let's take a look.
Heat-trapping by CO2 in the atmosphere happens because it has the ability to absorb and pass on infra-red radiation – it is a 'greenhouse gas'. Infra-red is just one part of the electromagnetic spectrum, divided by physicists into a series of bands. From the low-frequency end of the spectrum upwards, the bands are as follows: radio waves, microwaves, infrared, visible light, ultraviolet, X-rays, and gamma rays. Gamma rays thus have a very high-frequency. They are the highest-energy form of radiation.
As our understanding of the electromagnetic spectrum developed, it was realised that the radiation consists of particles called 'photons', travelling in waves. The term was coined in 1926 by the celebrated physicist Gilbert Lewis (1875-1946). A photon's energy is related to its wavelength. The shorter the wavelength, the higher the energy, so that the very high-energy gamma-rays have the shortest wavelength of the lot.
Sunshine consists mostly of ultraviolet, visible light and infra-red photons. Objects warmed by the sun then re-emit energy photons at infra-red wavelengths. Like other greenhouse gases, CO2 has the ability to absorb infra-red photons. But CO2 is unlike a mop, which has to be wrung out regularly in order for it to continue working. CO2 molecules do not get filled up with infra-red photons. Not only do they emit their own infra-red photons, but also they are constantly colliding with neighbouring molecules in the air. The constant collisions are important. Every time they happen, energy is shared out between the colliding molecules.
Through those emissions and collisions, CO2 molecules constantly warm their surroundings. This goes on all the time and at all levels in the atmosphere. You cannot say, “CO2 is saturated because the surface-emitted IR is rapidly absorbed”, because you need to take into account the whole atmosphere and its constant, ongoing energy-exchange processes. That means taking into account all absorption, all re-emission, all collisions, all heating and cooling and all eventual loss to space, at all levels.
If the amount of radiation lost to space is equal to the amount coming in from the Sun, Earth is said to be in energy balance. But if the strength of the greenhouse effect is increased, the amount of energy escaping falls behind the amount that is incoming. Earth is then said to be in an energy imbalance and the climate heats up. Double the CO2 concentration and you get a few degrees of warming: double it again and you get a few more and on and on it goes. There is no room for complacency here. By the time just one doubling has occurred, the planet would already be unrecognisable. The insulation analogy in the myth is misleading because it over-simplifies what happens in the atmosphere.
Please use this form to provide feedback about this new "At a glance" section. Read a more technical version below or dig deeper via the tabs above!
Further details
This myth relies on the use of a word – saturated. When we think of saturated in everyday use, the term 'soggy' comes to mind. This is a good example of a word that has one meaning in common parlance but another very specific one when thinking about atmospheric physics. Other such words come to mind too. Absorb and emit are two good examples relevant to this topic and we’ll discuss how they relate to atmospheric processes below.
First things first. The effect of CO2 in the atmosphere is due to its influence on the transport of 'electromagnetic radiation' (EMR). EMR is energy that is moving as x-rays, ultraviolet (UV) light, visible light, infrared (IR) radiation and so on (fig. 1). Radiation is unusual in the sense that it contains energy but it is also always moving, at the speed of light, so it is also a form of transport. Radiation is also unusual in that it has properties of particles but also travels with the properties of waves, so we talk about its wavelength.
The particles making up radiation are known as photons. Each photon contains a specific amount of energy, and that is related to its wavelength. High energy photons have short wavelengths, and low energy photons have longer wavelengths. In climate, we are interested in two main radiation categories - firstly the visible light plus UV and minor IR that together make up sunshine, and secondly the IR from the earth-atmosphere system.
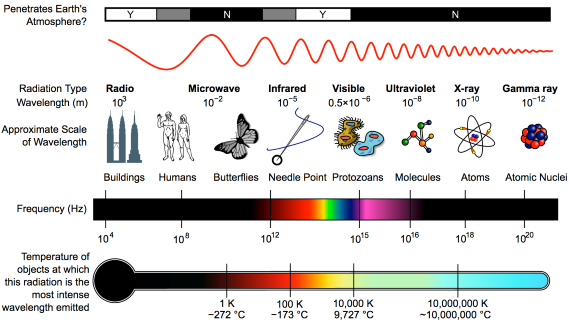
Fig. 1: diagram showing the full electromagnetic spectrum and its properties of the different bands. Image: CC BY-SA 3.0 from Wikimedia.
CO2 has the ability to absorb IR photons – it is a 'greenhouse gas'.So what does “absorb” mean, when talking about radiation? We are all familiar with using a sponge to mop up a water spill. The sponge will only absorb so much and will not absorb any more unless it's wrung out. In everyday language it may be described, without measurements, as 'saturated'. In this household example, 'absorb' basically means 'soak up' and 'saturated' simply means 'full to capacity'. Scientific terms are, in contrast, strictly defined.
Now let's look at the atmosphere. The greenhouse effect works like this: energy arrives from the sun in the form of visible light and ultraviolet radiation. A proportion reaches and warms Earth's surface. Earth then emits the energy in the form of photons of IR radiation.
Greenhouse gases in the atmosphere, such as CO2 molecules, absorb some of this IR radiation, then re-emit it in all directions - including back to Earth's surface. The CO2 molecule does not fill up with IR photons, running out of space for any more. Instead, the CO2 molecule absorbs the energy from the IR photon and the photon ceases to be. The CO2 molecule now contains more energy, but that is transient since the molecule emits its own IR photons. Not only that: it's constantly colliding with other molecules such as N2 and O2 in the surrounding air. In those collisions, that excess energy is shared with them. This energy-sharing causes the nearby air to heat up (fig. 2).
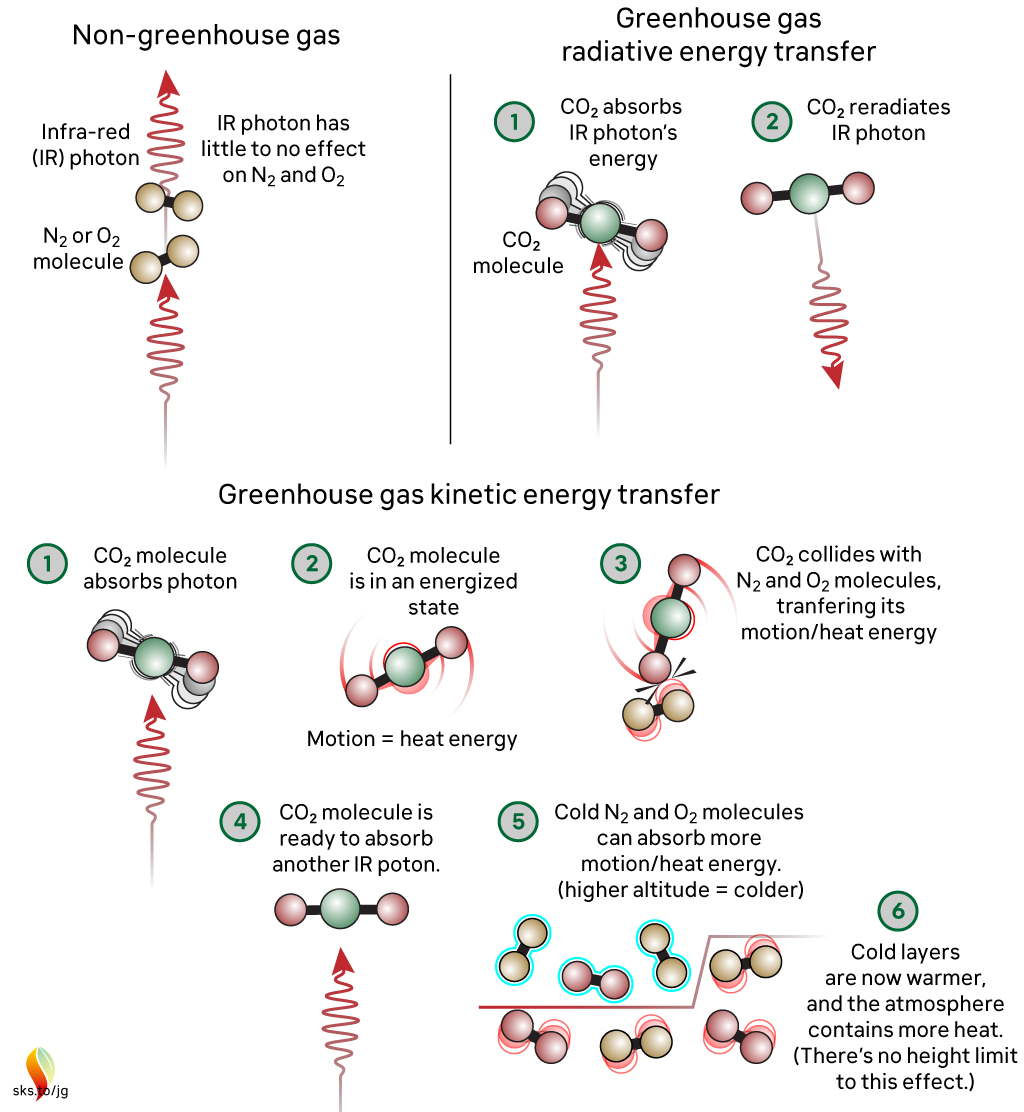
Fig. 2: The greenhouse effect in action, showing the interactions between molecules. The interactions happen at all levels of the atmosphere and are constantly ongoing. Graphic: jg.
The capacity for CO2 to absorb photons is almost limitless. The CO2 molecule can also receive energy from collisions with other molecules, and it can lose energy by emitting IR radiation. When a photon is emitted, we’re not bringing a photon out of storage - we are bringing energy out of storage and turning it into a photon, travelling away at the speed of light. So CO2 is constantly absorbing IR radiation, constantly emitting IR radiation and constantly sharing energy with the surrounding air molecules. To understand the role of CO2, we need to consider all these forms of energy storage and transport.
So, where does 'saturation' get used in climate change contrarianism? The most common way they try to frame things is to claim that IR emitted from the surface, in the wavelengths where CO2 absorbs, is all absorbed fairly close to the surface. Therefore, the story continues, adding more CO2 can’t make any more difference. This is inaccurate through omission, because either innocently or deliberately, it ignores the rest of the picture, where energy is constantly being exchanged with other molecules by collisions and CO2 is constantly emitting IR radiation. This means that there is always IR radiation being emitted upwards by CO2 at all levels in the atmosphere. It might not have originated from the surface, but IR radiation is still present in the wavelengths that CO2 absorbs and emits. When emitted in the upper atmosphere, it can and will be lost to space.
When you include all the energy transfers related to the CO2 absorption of IR radiation – the transfer to other molecules, the emission, and both the upward and downward energy fluxes at all altitudes - then we find that adding CO2 to our current atmosphere acts to inhibit the transfer of radiative energy throughout that atmosphere and, ultimately, into space. This will lead to additional warming until the amount of energy being lost to space matches what is being received. This is precisely what is happening.
The myth reproduced at the top – incorrectly stating an analogy with roof insulation in that each unit has less of an effect - is misleading. Doubling CO2 from 280 ppm to 560 ppm will cause a few degrees of warming. Doubling again (560 to 1130 ppm) will cause a similar amount of additional warming, and so on. Many doublings later there may be a point where adding more CO2 has little effect, but recent work has cast serious doubt on that (He et al. 2023). But we are a long, long way from reaching that point and in any case we do not want to go anywhere near it! One doubling will be serious enough.
Finally, directly observing the specific, global radiative forcing caused by well-mixed greenhouse gases has - to date - proven elusive. This is because of irregular, uncalibrated or limited areal measurements. But very recently, results have been published regarding the deep reinterrogation of years of data (2003-2021) from the Atmospheric Infrared Sounder (AIRS) instrument on NASA's Aqua Satellite (Raghuraman et al. 2023). The work may well have finally cracked the long-standing issue of how to make finely detailed, consistent wavelength-specific measurements of outgoing long-wave radiation from Earth into space. As such, it has opened the way to direct monitoring of the radiative impact (i.e. forcing + feedback) of greenhouse gas concentration changes, thereby complimenting the Keeling Curve - the longstanding dataset of measured CO2 concentrations, down at the planet's surface.
Note: Several people in addition to John Mason were involved with updating this basic level rebuttal, namely Bob Loblaw, Ken Rice and John Garrett (jg).
Last updated on 31 December 2023 by John Mason. View Archives


Anne Hyzer @375, you are correct about the stratosphere increasing in temperature with altitude. Most IR radiation from the atmosphere comes from the tropospheresphere, however, so the above explanation is a reasonable simplification.
For a more detailed explanation, considering the following spectrum of outgoing IR radiation from an unknown (by me) location:
The spectrum has conveniently placed black body curves for particular temperatures (dashed lines). From that you can see that the chief absorption band for CO2 (centered at 650 cm^-1) has a broad flat base at approximately 220 K. That flat base represents the tropopause, where temperatures are unchanging with altitude for several kilometers (see temperature profile below). At the center of that flat base are two peaks, one much larger than the other. That represents radiation from the stratosphere. Also, and very importantly, on either side of the broad absorption band, at about 240 K, and againg at 250 K temperature, you will see notches in the wall, with the former being deeper and the latter broader. These are notches are from local peaks in absorption (emission) which are located within the troposphere.
As CO2 concentration increases, emissions at all wavenumbers in the CO2 brand will come from higher altitudes. That will have several effects. First, the broad plateau at 220 K will become wider emissions from the upper troposphere move into the tropopause. Second, the notches at 240 and 250 K will become wider and deeper as the emissions causing them move higher in the stratosphere. Also, the small notch at 800 cm^-1 will also deepen and widen (that notch also being due to CO2). Against this, the two peaks at the center will grow higher and widen. The combination of the other effects, however, will result in a greater reduction in IR radiation than will the increase due to increased emission from the stratosphere. As an added nuance, the increased CO2 will cool the stratosphere, which will tend to limit the increase in height and bredth of the central peak.
So, overall, outgoing IR emissions will decrease with increasing CO2, and that decrease will be entirely due to higher emission in the troposphere as indicated in the original post. The increase will be only partly offset by an increase in radiation from the stratosphere. All of this is included in determinations of CO2 forcing from standard radation models and Global Circulation Models, although arguably it was neglected prior to the correction to the basic formular for CO2 forcing by Myrhe et al, 1998.
Anne Hyzer - In the troposphere convective overturning dominates, with the atmosphere warmed from below, under a state of constant inversion. Once past the GHG effective radiating altitude (where more than ~50% of upward emission for the wavelength in question is escaping to space without further absorption) and into the stratosphere, the dominant influence is UV warming from the sun, which is strongest at higher altitudes. And since the stratosphere is thermally stable, warmer at the top, convective overturning doesn't occur there.
I understand that most radiation comes from the troposphere as you say, outside the CO2 band, but this source says almost all of the CO2 band's radiation comes from the upper stratosphere.
This source
Anne, I'm not sure that you're correctly interpreting the Iacono and Clough graph. It is essentially a heat loss diagram and shows the role of various GHG in stratospheric cooling. I'm sure Tom Curtis can help more.
Anne Hyzer @379, that is a very complicated graph that has been launched like an iceberg on an unsuspecting public. It is unsurprising that you have misinterpreted it (as I have on a previous occasion).
Teasing out the complexities, the first thing to note is that it is a graph of spectral cooling rates by pressure altitude and wave number. Because it shows cooling rates, positive values show a net cooling effect at that wave number. It is important to recognize that it is by wavenumber, as integrated across all wavenumbers (ie, into the ultraviolet), ozone has a net warming effect rather than the net cooling effect shown which appears to be shown here.
The second complexity is that the spectral cooling rate is the total emission less total absorption at that altitude and wave number divided by density times the heat capacity of the atmosphere at that level. The heat capacity is in fact not constant with altitude because atmospheric composition is not constant with altitude. In particular, the water vapour concentrations falls rapidly as you ascend in the troposphere. Further, density falls rapidly with altitude as well. Density scales very approximately with pressure in the atmosphere, so that at a pressure of 100 mb, the energy emitted minus energy absorbed is very approximately one tenth of what it would be for an equivalent spectral cooling rate at sea level. At 1 mb pressure, it is 1000th. That is a significant underestimate of the actual scaling due to the greatly reduced heat capacity at altitude as a result of the greatly reduced water vapour content.
Combining these two factors, and the title of the graph seen when you run your mouse over it here (which I assume you put in) and your interpretation of the graph are both completely wrong and misleading.
Adding further complexity is that the scale is not uniform (being linear below six, and logarithmic above it), and the colour scale was chosen to emphasize features in the stratosphere and hence are not terribly informative in the troposphere. Further, this graph is for Mid Latitude Summer conditions, and do not represent a global average.
As it happens, the original paper has a host of interesting figures which would obviate the confusion caused by the above graph without detailed discussion. Most helpful in this case is Table1:
As can be seen both upward and downward flux are highest at the surface, where the difference between them (net flux) is also smallest. At the surface, upward flux is 423.5 W/m^2 but downward flux is 346.9 W/m^2 leaving a net upward flux of 76.6 W/m^2. At the tropopause, upward is 287.6 W/m^2, downward is 22.3 W/m^2 and net is 265.3 W/m^2. At the TOA, there is no downward, so upward= net = 283.3 W/m^2. Further, because at any location, upward emissions from that location equals downward emissions from that location, we know that upward emissions from the stratosphere never exceed the downward emissions at the bottom of the stratosphere, ie, the 22.3 W/m^2 downward emissions at the Tropopause.
With that in mind, consider the chart of net upward IR flux below:
As you can clearly see, the net upward IR flux is smallest at the surface, and rises rapidly with altitude up to the tropopause. You will also see that doubling CO2 reduces the net upward IR flux. Table 1 from the original paper specifies the reduction in net upward IR flux due to doubling CO2 to be 2.8 W/m^2 at the TOA, and 5.6 W/m^2 at the tropopause. Given that the normal definition of radiative forcing is the change in net upward IR flux at the tropopause after equilibrium adjustment for the stratosphere, and that this is a Mid Latitude Summer atmosphere, these figures are consistent with the accepted forcing of 3.7 W/m^2.
Finally, one more figure from Clough and Iacono 1995:
This figure shows the change in spectral cooling rate for an increase in CO2 concentration from 335 to 350 ppmv (approx) among other changes. As you can clearly see, the effect is a warming effect in the troposphere (100 mb and lower) with most of the warming being in the wings of the CO2 band. There is a cooling effect in the stratosphere. (Note, this graph uses a more detailed resolution, allowing more detail of differences in wave number to emerge than in the more commonly shown graph.)
So, as figure 5 and plate 9 of Clough and Iacono 1995 clearly show, the CO2 effect is not saturated, and increasing CO2 warms the troposphere.
Note: In the original version of this comment, I made a blunder in interpreting Fig 5. The original text is preserved below in the interests of transparency. I have, however, struck it through to make it clear that (except where it agrees with the text above) it no longer represents my opinion.
Most helpful in this case is their plot of net upward IR flux by altitude integrated across the spectrum:
As you can clearly see, the net upward IR flux is greatest at the surface, and falls rapidly with altitude up to the tropopause. You will also see that doubling CO2 reduces the net upward IR flux. Table 1 from the original paper specifies the reduction in net upward IR flux due to doubling CO2 to be 2.8 W/m^2 at the TOA, and 5.6 W/m^2 at the tropopause. Given that the normal definition of radiative forcing is the change in net upward IR flux at the tropopause after equilibrium adjustment for the stratosphere, and that this is a Mid Latitude Summer atmosphere, these figures are consistent with the accepted forcing of 3.7 W/m^2.
WRT the effective radiating altitude, it's worth comparing the spectra of emitted IR to the atmospheric temperature profile.
Emitted IR, single point, US Standard Atmosphere:
[Source]
Atmospheric temperature profile:
[Source]
What's interesting is that for any GHG wavelength you can go from the amount of IR radiating to the temperature to the effective radiating altitude.
In the CO2 trough you can see emissions bottoming out around 220K, or -53C. At the tropopause temperatures are around -50 to as low as -70C, ~223 to 203K, indicating that valley and those wavelengths represent an effective CO2 emission altitude at the tropopause.
In the center of the CO2 trough where absorbance is particularly high there is a smaller peak - that comes from a small band of IR emitted by CO2 in the warming stratosphere. For most of the IR spectra the tropopause represents the upper limit on the effective radiating altitude. And for that very reason the upper end of convective overturning, as the energy necessary for the tropospheric inversion and convection radiates to space at that point.
KR, you say the 220 K value in your first graphic corresponds with the -50 to -70 C temps of the tropopause, but your second graphic shows that the temperature of the atmosphere does not change at all between the tropopause, at 10 km, and the lower stratospphere up to around 20 km. This is seen more clearly in the graph in post #376 in Tom's post. It means, judging by temperature, the CO2 radiates anywhere from the tropopause to the lower stratosphere, or, anywhere from 10 km up to 20 km.
Digby @383, if you look at the right hand panel of the second figure in KR's post you will see three "typical" temperature profiles. The temperature profile in my post @376 corresponds to the green profile in KR's post, ie, middle latitude. As you can see, the profile varies based on latitude, but also on season and local conditions (including local humidity). The profile over desert, for example, would be different to that over ocean.
KR's refference to a temperature range, therefore, does not represent a range of temperatures in the tropopause. It represents a range of temperatures of the tropopause at different latitudes (as shown in the right hand panel of his second figure). While it would be possible with a sufficiently distant instrument to get a whole hemisphere IR spectrum for the Earth, the actual instruments used are in low Earth orbit and so can only profile a limited area at a time so the brightness temperature of the base of the CO2 trough will vary depending on where and when the profile was taken.
Digby - And as Tom Curtis and I have noted, this means that the upper stratosphere is not the location of the effective radiating altitude, nor where the majority of the CO2 radiated energy comes from.
Digby, I think you are furiously agreeing with KR. The only thing you are not noting is that KR's post was a response to "Anne Hyzer" who claimed the majority of CO2 radiation came from the upper stratosphere (see 378).
I'd venture to guess that Digby is M. Wright -> Satoh -> Anne Hyster -> Anne HysterII. Each of these folks has been banned for excessive repetition, sock puppetry and sloganeering.
I would propose to allow continued commenting if Mr Wright can abide by the rules. But that will require the capacity to actually move the discussion forward when shown where he is in error.
Note that Mr Wright has an extensive blog post where he contradicts nearly every aspect of established scientific research related to climate change (which, if any of it were actually correct, would earn him a Nobel Prize).
[DB] Yes, sock puppetry is indeed confirmed. Reprehensible activities such as this are subject to automatic forfeiture of posting rights, permanently.
I think what Digby fails to realize is that the radiation along the side wings of the CO2 band do come from the troposphere, yet are radiated and/or absorbed by CO2. If you study Toms graph in post 376, you see that along the sides of the CO2 band, around 650/cm and on the other side at around 750/cm., the radiation matches up with 240 K or even 250 K, which correspond with temperatures in the troposphere. Adding CO2 to the atmosphere would push those jagged edges downward on the graph and closer to 220K, which is colder.
Digby is partially correct by saying the bulk of the CO2 band radiates from 220 K which is the lower stratosphere, which does not get colder with altitude, and he is also corect that the bulk of the radiation from the troposhere is well outside the region of the spectrum which is affected by CO2, but he fails to note that the wings of the CO2 band would be pushed slightly downward on the graph, and into colder regions on the graph (because, in the real world outside the graph, radiation of those 650 and 750 wave numbers would have to travel higher up in the atmosphere to get around all the extra CO2 molecules).
Mike Hills
That spreading oof the CO2 'notch' due to the sides dropping can be seen in this image. I have used Modtran to show the OLR spectrum for 400 and 4000 ppm of CO2, everything else kept the same.
There is a concern about saturation of CO2 absorption that I haven't seen addressed. Most of the action - like increased IR aborption - takes place at 16+ km above ground level. How can this affect ground level temperature?
Take into account that the greenhouse effect will not let radiation through.
commonsense - Two words: lapse rate. Rising air decreases in pressure and cools, descending air rises in pressure and warms (by the ideal gas law, PV - nRT). Surface temperatures will be directly related to tropospheric emission temperatures by altitude difference and the lapse rate. See Fig. 4 at this Realclimate article.
At the surface IR in GHG wavelengths is absorbed within meters - but the real action takes place around the tropopause where pressures and absolute amounts of GHGS decrease to the point that ~50% of IR escapes to space. And the more GHGs, the higher that altitude is, and the larger the difference between the emission altitude temperature and that of the surface.
commonsense @390, in the troposphere, convection induces a lapse rate (fall of temperature with altitude) of about 6.5 C per kilometer. The exact value depends on the specific heat of the atmosphere, the local graviational acceleration, and the mixing ratio of water to dry air in the atmosphere. Because of this, any change in temperature at any level of the troposphere will in general be reflected across all altitude levels in the troposphere. Specifically, if a 1.2 C increase in temperature at the effective altitude of radiation to space is required to balance the energy effect of doubling CO2, because of the effect of the lapse rate that same temperature change will also be felt at all lower altitudes.
This is not a magical effect. Suppose the effective altitude of radiation to space increases in height, ie, lifts to a cooler altitude. It follows that less radiation to space will occur, so that the temperatures will warm. The warmer temperature at higher altitudes will then slow convection, reducing the rate at which energy leaves the surface, which will in turn warm the surface. This process will continue until the lapse rate is restored to its former value, ie, the temperature increase at the surface equals that at altitude.
All this ignores feedbacks. As it happens, one of the feedbacks, the lapse rate feedback slightly decreases the lapse rate due to increased water vapour in the atmosphere with increased temperatures (the cause of the tropospheric hotspot). This is more than balanced by the increased greenhouse effect from the water vapour (the water vapour feedback) so that the net feedback is positive. Consequently the final change in temperature is much more than the 1.2 C found in the no feedback case (and mentioned above).
A lot the trouble here is around trying to make a plain english explanation of physics as opposed to the "shut up and calculate approach".
So commonsense, you have identified an issue with the explanation but not with the physics. At the heart of this is the Radiative Transfer equations. Solve these and the hard-to-explain stuff like saturation, stratagraphic cooling etc fall out of the solution. The solutions to the RTEs can be verified with equisite accuracy by measurement. (eg Harries 2001, Evans 2006, and most recently directly see here).
commonsense:
To add another analogy to the concept, if you had a person suffering from hypothermia, witha low body core temperature, and all you had on hand was a blanket, do you think it would be worth wrapping the person with the blanket? After all, that only adds insulation on the outside, not the body core. The fact is that the body core will continue to lose heat to the body surface, and insulating the surface (reducing the heat loss to the air) will help maintain core temperature. A heavier blanket --> higher core temperature.
The earth-atmosphere system is similar: all portions of the system are linked together, and changing one component of heat transfer will cascade through the entire system. To know exactly how, you need to apply the known physics and "do the math". The math says "increasing atmospheric CO2 leads to increased surface temperatures".
With 8 pages of comments, I am not sure that I covered all of the conversations. However, the original premise of the article seems to contradict the study and paper by Hermann Harde. It is a 45+ page paper so it is impossible to shorten in this comment however it is clear that the study disagrees with the analysis of the original post and points out that the IPCC estimate of 1.5C to 4.5C is likely to be in error with a more realistic sensitivity of 0.6C including a declining increase of CO2 impact due to absorption and emission spectra of greenhouse gases.
http://www.scipublish.com/journals/ACC/papers/download/3001-846.pdf
We present an advanced two-layer climate model, especially appropriate to calculate the influence of an increasing CO2-concentration and a varying solar activity on global warming. The model describes the atmosphere and the ground as two layers acting simultaneously as absorbers and Planck radiators, and it includes additional heat transfer between these layers due to convection and evaporation. The model considers all relevant feedback processes caused by changes of water vapour, lapse-rate, surface albedo or convection and evaporation. In particular, the influence of clouds with a thermally or solar induced feedback is investigated in some detail. The short- and long-wave absorptivities of the most important greenhouse gases water vapour, carbon dioxide, methane and ozone are derived from line-by-line calculations based on the HITRAN08-databasis and are integrated in the model. Simulations including an increased solar activity over the last century give a CO2 initiated warming of 0.2 ˚ C and a solar influence of 0.54 ˚ C over this period, corresponding to a CO2 climate sensitivity of 0.6 ˚ C (doubling of CO2) and a solar sensitivity of 0.5 ˚ C (0.1 % increase of the solar constant).
[PS] You might want to look at discussion that begins here. You might want to sharpen your critical skills by seeing if can spot some reasons why there might be an issue.
SeanO, HotWhopper dealt with that paper last year: http://blog.hotwhopper.com/2014/10/anthony-watts-has-found-another.html?m=1
[PS] Fixed link
[PS] Since the input is the hitran database, this isnt really about CO2 saturation. Any further discussion should take place on "Climate sensitivity is low"
SeanO - Harde is a very good spectroscopist with an absolutely lousy climate model, see the discussion on Rabett Run:
http://rabett.blogspot.com.es/2011/03/toy-model.html
The major problem is the use of a 'toy' model with only two atmospheric levels; as I understand it MODTRAN results don't start to stabilize until you use at least 20 levels - too few levels result in a poor approximation. It's like attempting numerical integration of a complex curve with only two intervals - use too few samples, and your answer will be wrong.
Two-level models are fine for demonstrating basic principles in intro classes, but insufficient for obtaining realistic answers.
A better discussion on this runs in a Comments section on the EIKE website (German climate denial group) where Harde's paper was discussed, in particular the comments by Dr. Gerhard Kramm - an expert on climate modeling. From his first comment (translated, emphasis added):
Enough said.
Since CO2 is only present in our atmosphere at 0.04%, I've always thought it strange that it could have such a large impact. I've looked into "Radiative Forcing" and found out that as a model, it's not fitting, so there's another model that's more accurate that's being used instead for most climate models.
At the center of it all tho, as this article describes, is the effective "greenhouse" effect of CO2. If CO2 makes up 20% of our greenhouse effect, light from stars at this wavelength should be diminished by 20%.
According to this article, it isn't even a concern in IR astronomy.
(I apologize for the tone of this article, I don't think it should be as inflamatory as it is, yet the points he makes seem valid to me)
https://stevengoddard.wordpress.com/2014/01/25/ir-expert-speaks-out-after-40-years-of-silence-its-the-water-vapor-stupid-and-not-the-co2/
If IR at CO2's wavelengths aren't affecting light coming from stars (almost undetectable amount) then IR at CO2 wavelenghts is free to radiate to space even from the surface. That should be easily measurable using a light source at that frequency pointed out to hit a sattelite, or even one of the mirrors we have on the moon.
If the article I listed or the premise I've asserted is false, please let me know.
Thank you...
Quick FYI... Stevengoddard (not his real name) is probably one of the worst sources of information on climate change available on the internet.